![]() ISSN 0798 1015
ISSN 0798 1015

![]() ISSN 0798 1015
ISSN 0798 1015
Vol. 41 (Issue 01) Year 2020. Page 14
BISWAL, Saroj Kanta 1 & MISHRA, Satyakama 2
Received: 13/09/2019 • Approved: 12/12/2019 • Published 15/01/20
5. Major findings, recommendations and conclusion
ABSTRACT: The main purpose of the study is to examine the relative efficiency of the Indian Nationalized Banks and also to analyse the efficiency and profitability connexion. This paper is unique in the sense that it analyses the banks by using the Non-parametric methods. This piece of work classified the banks in terms of efficient and inefficient which may help the banks to take remedial measures in order to improve the efficiency and profitability. With a view to cultivate a base for performance appraisal and relate it to nationalized banks in India, Data Envelopment Analysis (DEA) and Free Disposal Hull (FDH) programming mathematical models are used to assess the financial performance of the banks in India. |
RESUMEN: El objetivo principal del estudio es examinar la eficiencia relativa de los bancos nacionalizados de la India y también analizar la eficiencia y la rentabilidad de la conexión. Este documento es único en el sentido de que analiza los bancos utilizando los métodos no paramétricos. Este trabajo clasificó a los bancos en términos de eficiencia e ineficiencia, lo que puede ayudar a los bancos a tomar medidas correctivas para mejorar la eficiencia y la rentabilidad. Con el fin de cultivar una base para la evaluación del desempeño y relacionarla con bancos nacionalizados en India, los modelos matemáticos de programación de Análisis de envolvente de datos (DEA) y Casco de libre disposición (FDH) se utilizan para evaluar el desempeño financiero de los bancos en India. |

Even though many methods are available in computing efficiency in financial institutions, the finest method rests in disagreement. (Berger & Humphrey, 1997) Recognized two components boundary analysis methodologies are, the parametric and the non-parametric approaches. The parametric method comprises econometric (stochastic) frontier approach, distribution-free approach (DFA) and thick Frontier approach (TFA), while the non-parametric method comprises of Free Disposal Hull (FDH), Index Numbers (IN), Mixed Optimal Strategy (MOS) and Data Envelopment Analysis (DEA). In the parametric approaches, one postulates an unambiguous efficient form for the frontier and econometrically approximates the parameters using sample data for inputs and outputs, so the correctness of the resultant technical efficiency estimate is subtle to the nature of the functional form quantified.
(Ferrier & Lovell, 1990) & (Berger & Humphrey, 1997) Discussed the comparative benefits and difficulties of DEA against Econometrics for gauging efficiency. Although it is established that the DEA frontier covered the data more closely than a stochastic frontier, the enormousness of inefficiency described by DEA was minor. Besides, the rank correlation among the sets of technical inefficiency scores were not statistically significant.
The importance of the study is to judge nationalized banks operational in India. The enactment of financial institutions is appropriate from the strategy point of view because as finance-growth suggests, if banks become better-functioning units, it is expected to be mirrored in firming capital buffer, safety and soundness of the financial systems. Efficiency estimates are foremost pointers, by itself, efficiency dimension of individual banks is avital investigation activity accepted by the central bank of India in order to recognise the properties of deregulation, merger, market structure as well as their scale and latitude of action. Segmenting the business into diverse tactical clusters can help the bank's place themselves and take long-term renovating of their distribution design process.
Productivity, in broad, is a reckoning of the aberration between actual performance and desired performance. The stakeholders in bank performancecomprise managers, credit-rating companies, shareholders, bondholders, competitors, regulators, financial markets, depositors, as well as other market participants.
For many years, The Financial Management Tool acknowledged as Ratio Analysis Technique [RAT] has been used to assess the performance of the Banks. The financial statements are inspected to catchdissimilar ratios and then relate them with the distinctyardstick. In this research paper, the traditional parametric technique is substituted with the non – parametric method DEA to examine the performance of the Nationalized Banks.
(Levine & Min, 1998) Oppose that concrete foreign bank presence is related with ainferior probability of crises. (Barth, Caprio, et al, 2001) Claimed that less restrictions on foreign bank entry lessen the probability of crises.
(Seiford & Zhu, 1999) Studied the success and marketability of the top 55 U.S. commercial banks by smearing the DEA model and established that large banks achieved better with respect to productivity than small size banks, while small size banks have the better characteristic of marketability as related to large size banks.
(Maudos, Pastor, et al, 2002) Calculated the cost and profit efficacy of 832 European banks built in ten European Union Countries (period 1993 – 1996). The return on assets (ROE) and return on equity (ROA) were picked up as performance measures to check profit efficiency of banks using DEA by allowing for the four dimensions namely the market characteristics, differences in size, other bank characteristics and specialization. Disparities in profit terms were found to be more than the differences in cost terms.
(Sangeetha & Mathew, 2013) Verified the profitability of all Korean banks by analysing market structure hypothesis against efficient structure hypothesis applied after inspection of the panel data (for the period of 1992-2002); with the help of (DEA) model. The consequence of this study shows that the performance measures significantly shakes the profitability of banks.
(Pastor, Lovell, et al, 2006) Debated the financial performance of branch offices. They considered 573 branch offices, for a six-month accounting period, of large European savings banks. They established that the financial performance assessmentfeatures can be abridged without statistical loss of significant information to the bank management.
(Sufian, 2009) Deliberate the competence of the Malaysian banking sector during the Asian Crisis of 1997 for the period of 1995-1999. The competence of individual banks was calculated by DEA technique. They measured the Profitability as the major component which was used to assess the competence with other descriptive variables, like bank size and ownership also measured that as there is a positive association between the Efficiency of banks and loans amount and the association is otherwise for the economic settings and expense preference behaviour.
(Izah, Nor, et al, 2009) Appraised the complete pure technical and scale efficiencies for Malaysian commercial banks during the period 2000-2006. The resultrecommended that domestic banks were comparatively more competent than foreign banks. They recommended that the domestic banks’ inefficiency were accredited to the pure technical inefficiency reasonably than scale inefficiency. In divergence, foreign banks inefficiency was accredited to scale inefficiency reasonably than pure technical inefficiency.
(Al Khathlan & Malik, 2010) Examined the comparative efficiency of Saudi Banks using annual data from 2003 over 2008 using DEA. The study show that that, Saudi banks were well-organized in the management of their financial resources, on a relative scale. Besides, the results deliveredvital information about the Saudi banks’ financial conditions and management performance.
(Nigmonov, 2010) Deliberate the banks’ performance and efficiency in Uzbekistan for the period of 2004-2006. The elementary two DEA models were used to analyse the data under the supposition of a constant and variable return to scale. The results have discovered that inefficiency happens due to technical efficiency and generally banks average efficiency level decreased.
(Mehmet & Kale, 2011) Calculated the performance model for gauging the comparative efficiency and latentdevelopmentabilities of banks by classifying their assets and faultsalong with the production and profitability. Under both themethods, efficiency features of branches, which are assembledconferring to different sizes and regions, have similar propensities. In both studies, it is seeming that branch size and scale efficiency are connected to each other. As branch size surges scale efficiency surges too and after the most productive scale size, though, as size increases efficiency decreases. Too small and too large branches need special care. Putin production and profit efficiency scores on two scales tells the performing features of branches. Individually, every region needs diverse handling. Branches with low production-low profit efficiency should be progressedto high production-high profit efficiency region.
(Tobias & Shipho, 2011) Examined the properties of bank-specific features like Capital adequacy, Asset quality, liquidity, operational cost efficiency and income diversification on the profitability of commercial banks operating in Kenya. The objective of the paper was to appraise the propertiesof market structure factors. This study used panel data research design for the study.The result reveal that there is a relationship between foreign ownership and market absorption, on the profitability of commercial banks in Kenya.
(Bhuia, Baten, Deb, et al, 2012) Examined the comparative efficiency of Bangladesh online banks during 2001 – 2007 by using Data Envelopment Analysis. The resultsdisclose that the best efficient banks were AL-ArafahIslami Bank Limited, ShahajalalIslami Bank Limited, Eastern Bank Limited, and the less efficient banks over the study period were Janata Bank Limited, Uttara Bank Limited, United Commercial Bank Limited, Pubali Bank Limited, and AB Bank Limited. It was also found that the individual efficiency level of banks increased group by group. The technical efficiency and scale efficiency of the sampled banks was found to be lower rather than pure technical efficiency.
(Charnes, Cooper, et al, 1978) Assessed the efficiency of the major commercial banks that functioned in Greece in the financial year 2009 by using DEA with multiple inputs and outputs. The results found out various inefficiencies that may or may not have direct impact on the profitability the banks. But, presence of these inefficiencies shows the susceptibility of the Greek banking system. In this case, FSF (Financial Stability Fund) is of great help as suggested by the author.
(Farrel, 1957) Verified the reliability and the efficiency of 12 banks (both public and private sector) based on market capitalization. In this study, CAMEL approach is used over a period of twelve years (2000-2011). It is found that the private sector banks top of the list for best reliability. It is also found that the public sector banks like Union Bank and SBI are lagging in economic soundness.
For this study, the essential data of all the Nationalized Banks have been taken from their individual official websites for the financial years 2013 – 2018.
Studying the works on the presentation of data envelopment analysis (DEA), diverse studies have used diverse amalgamation of inputs and outputs. In this study the researcher well-thought-out four input variables [Operating Expenses; Deposits; Total Expenditure and Labor] and three output variables [Net Interest Income, Investments and Assets] in order to have an intricate study.
To begin with the DEA approach, the correlation values were calculated and used to inspect whether the connotation of the input and output variables obey the isotonic hypothesis. The values show that important positive association occurs between the input and output variables, which precisely positions that the isotonic hypothesis exists. It additionally states that the DEA can be used to see the efficiency of the banks.
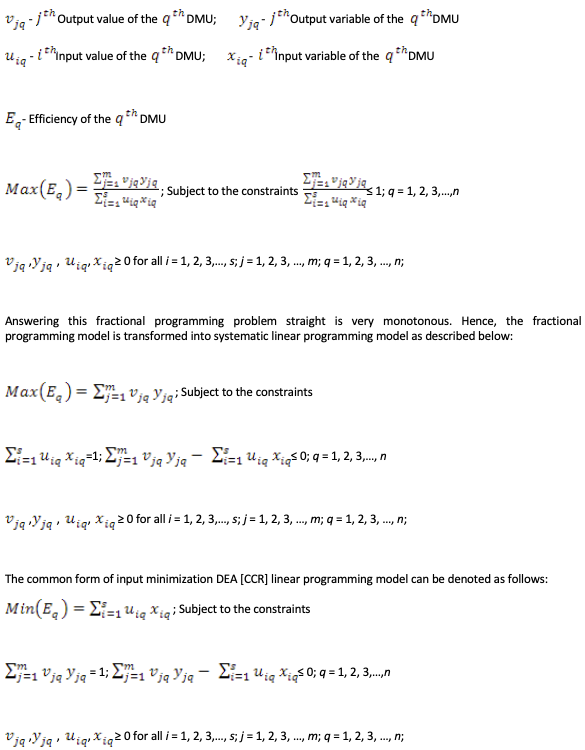
The new CCR model was relevant only to that knowledge which is characterized by constant returns to scale. The main progression was protracted by Charnes, and Cooper (BCC) model to enable know-how that discloses variable returns to scale. This study has used input-oriented DEA model, which underlines the minimization of inputs and the maximization of outputs held at their current levels. Also the BCC model with variable return to scale is measured.
The universal method Output Maximization DEA [CCR] model can be embodied in the form of Fractional Programming Model as follows where the general model is built to maximize the efficiency of the qth output variable:
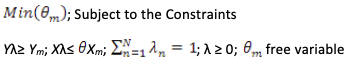
The DEA envelopment program for considering variables return to scale is as follows:
In current years, numerous DEA claims employ a two-stage procedure linking both DEA and Efficiency – Profitability Matrix. Firstly the efficiency of the banks were designedchanging their resources into earning ability using DEA and develop a scale and size independent profitability measures. Secondly, by using the efficiency-profitability matrix initiallyprojected by Boussofiane&Camanho and used by Camanhoto benchmark Cyprus and Portuguese banks correspondingly.
The cataloguing of units into homogeneous groups that fall into four discrete quadrants is shown in Figure 1 below:
1. “Star”;
2. “Sleeper”;
3. “Question mark”;
4. “Dog.”
The quadrant labelled “Star” consists of banks that accomplished both superior technical efficiency and profitability.
“Sleepers” are those banks that are highly profitable yet they are inefficient. Hence, their profitability can be further amplified if they are awakened to advance on their technical efficiency. “Question mark” banks are casing in profits and a key reason for this is in their technical inefficiency. To conclude, the “Dog” banks operate at high efficiency but low profitability.
Figure 1
The Efficiency - Profitability Matrix
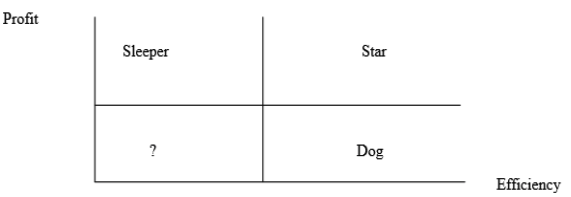
In this study, profitability would be learned by which financial ratio has a greater correlation coefficient with the efficiency result. The selected profitability is plotted against the efficiency values. The resulting Efficiency-Profitability matrix isseparated into four mutually exclusive quadrants where the boundary positions are informed by the arithmetic averages (i.e., mean values) of the technical efficiency (TE) scores and profitability figures.
The study uses an intermediation method whereby financial institutions are regarded as intermediating funds between savers and investors at the least cost. Banks yield intermediation services through the assortment of deposits and other liabilities and their application in interest-earning assets. Return on equity represents a measure of profitability (ROE= [Net Income / Average Stock Holder Equity]).
Table 1 comprises with the yearly mean efficiency of the Individual bank based on CRS and VRS model using DEA method and also the values of the Return on Equity of each bank is measured and organised.
Table1
Mean Efficiency (based on CRS & VRS)
and Return on Equity (ROE)
Sl. No. |
Name of the Bank |
2013-14 |
2014-15 |
2015-16 |
2016-17 |
2017-18 |
|||||
ME |
ROE |
ME |
ROE |
ME |
ROE |
ME |
ROE |
ME |
ROE |
||
1 |
Allahabad Bank |
0.922 |
0.186 |
0.985 |
0.131 |
0.999 |
0.179 |
1 |
0.167 |
1 |
0.178 |
2 |
Andhra Bank |
0.969 |
0.177 |
1 |
0.179 |
0.973 |
0.237 |
0.942 |
0.195 |
0.904 |
0.179 |
3 |
Bank of Baroda |
1 |
0.182 |
1 |
0.234 |
1 |
0.115 |
1 |
0.119 |
1 |
0.097 |
4 |
Bank of India |
1 |
0.188 |
0.977 |
0.220 |
1 |
0.121 |
0.944 |
0.141 |
0.866 |
0.125 |
5 |
Bank of Maharashtra |
0.977 |
0.183 |
0.984 |
0.144 |
0.924 |
0.154 |
0.916 |
0.045 |
0.924 |
0.090 |
6 |
Canara Bank |
0.965 |
0.048 |
1 |
0.0890 |
1 |
0.138 |
0.963 |
0.115 |
0.915 |
0.043 |
7 |
Central Bank of India |
1 |
0.149 |
1 |
0.169 |
0.879 |
0.206 |
0.862 |
0.201 |
0.843 |
0.145 |
8 |
Corporation Bank |
1 |
0.143 |
1 |
0.164 |
1 |
0.186 |
1 |
0.169 |
1 |
0.182 |
9 |
Dena Bank |
1 |
0.199 |
1 |
0.195 |
0.929 |
0.197 |
0.959 |
0.168 |
0.955 |
0.179 |
10 |
IDBI Bank |
1 |
0.083 |
1 |
0.091 |
1 |
0.101 |
1 |
0.113 |
1 |
0.098 |
11 |
Indian Bank |
1 |
0.194 |
1 |
0.175 |
0.872 |
0.188 |
0.856 |
0.180 |
0.745 |
0.163 |
12 |
Indian Overseas Bank |
0.854 |
0.248 |
1 |
0.185 |
1 |
0.094 |
0.859 |
0.115 |
1 |
0.088 |
13 |
Oriental Bank of Commerce |
1 |
0.061 |
1 |
0.122 |
0.988 |
0.134 |
1 |
0.135 |
0.936 |
0.096 |
14 |
Punjab National Bank |
0.934 |
0.166 |
1 |
0.211 |
0.850 |
0.220 |
0.846 |
0.206 |
0.848 |
0.176 |
15 |
State Bank of India |
0.942 |
0.137 |
0.961 |
0.157 |
0.987 |
0.139 |
0.901 |
0.113 |
0.901 |
0.139 |
16 |
Syndicate Bank |
1 |
0.198 |
1 |
0.182 |
1 |
0.186 |
1 |
0.149 |
1 |
0.145 |
17 |
UCO Bank |
0.948 |
0.141 |
0.932 |
0.141 |
0.758 |
0.194 |
0.942 |
0.122 |
0.917 |
0.129 |
18 |
Union Bank of India |
1 |
0.189 |
1 |
0.198 |
0.973 |
0.199 |
0.880 |
0.163 |
0.865 |
0.122 |
19 |
Vijaya Bank |
0.983 |
0.145 |
0.939 |
0.066 |
1 |
0.139 |
0.939 |
0.108 |
0.959 |
0.109 |
Table 2 expresses about the ranks secured by the banks based on the mean of the mean efficiency and the ROE.
Table 2
Overall Mean of Mean Efficiency, Mean
ROE and Mean ROA with their Ranks
Sl. No. |
Name of the Bank |
Mean of Mean Efficiency |
Rank Based Mean on Efficiency |
Average [ROE] |
Rank [ROE] |
1 |
Allahabad Bank |
0.981 |
3 |
0.168 |
9 |
2 |
Andhra Bank |
0.958 |
7 |
0.194 |
2 |
3 |
Bank of Baroda |
1 |
1 |
0.149 |
11 |
4 |
Bank of India |
0.958 |
8 |
0.159 |
10 |
5 |
Bank of Maharashtra |
0.945 |
9 |
0.123 |
15 |
6 |
Canara Bank |
0.969 |
4 |
0.086 |
19 |
7 |
Central Bank of India |
0.917 |
13 |
0.174 |
5 |
8 |
Corporation Bank |
1 |
1 |
0.169 |
8 |
9 |
Dena Bank |
0.969 |
5 |
0.188 |
3 |
10 |
IDBI Bank |
1 |
1 |
0.097 |
18 |
11 |
Indian Bank |
0.894 |
16 |
0.179 |
4 |
12 |
Indian Overseas Bank |
0.943 |
11 |
0.146 |
12 |
13 |
Oriental Bank of Commerce |
0.985 |
2 |
0.110 |
17 |
14 |
Punjab National Bank |
0.895 |
15 |
0.196 |
1 |
15 |
State Bank of India |
0.938 |
12 |
0.137 |
14 |
16 |
Syndicate Bank |
1 |
1 |
0.172 |
7 |
17 |
UCO Bank |
0.899 |
14 |
0.145 |
13 |
18 |
Union Bank of India |
0.944 |
10 |
0.174 |
6 |
19 |
Vijaya Bank |
0.964 |
6 |
0.114 |
16 |
According to the mean efficiency our study reveals that
Table 3
Profitability Vs Technical Efficiency of Banks with Quantified Approximated Value
Sl. No. |
Name of the Bank |
2013-14 |
2014-15 |
2015-16 |
2016-17 |
2017-18 |
Mean |
Efficiency |
Ratings |
1 |
Allahabad Bank |
2 |
1 |
4 |
5 |
5 |
3 |
D |
|
2 |
Andhra Bank |
2 |
5 |
4 |
5 |
4 |
4 |
ST |
Good |
3 |
Bank of Baroda |
5 |
5 |
3 |
3 |
3 |
4 |
ST |
Good |
4 |
Bank of India |
5 |
2 |
3 |
3 |
1 |
3 |
D |
|
5 |
Bank of Maharashtra |
4 |
1 |
1 |
2 |
1 |
2 |
SL |
|
6 |
Canara Bank |
1 |
3 |
3 |
3 |
3 |
3 |
D |
|
7 |
Central Bank of India |
3 |
5 |
2 |
2 |
2 |
3 |
D |
|
8 |
Corporation Bank |
3 |
5 |
4 |
5 |
5 |
4 |
ST |
Good |
9 |
Dena Bank |
5 |
5 |
2 |
4 |
4 |
4 |
ST |
Good |
10 |
IDBI Bank |
3 |
5 |
3 |
3 |
3 |
3 |
D |
|
11 |
Indian Bank |
5 |
5 |
2 |
2 |
2 |
3 |
D |
|
12 |
Indian Overseas Bank |
2 |
5 |
3 |
1 |
3 |
3 |
D |
|
13 |
Oriental Bank of Commerce |
3 |
3 |
3 |
3 |
3 |
3 |
D |
|
14 |
Punjab National Bank |
2 |
5 |
2 |
2 |
2 |
3 |
D |
|
15 |
State Bank of India |
1 |
1 |
3 |
1 |
2 |
2 |
SL |
|
16 |
Syndicate Bank |
5 |
5 |
5 |
4 |
5 |
5 |
ST* |
Very Good |
17 |
UCO Bank |
1 |
1 |
2 |
3 |
3 |
2 |
SL |
|
18 |
Union Bank of India |
5 |
5 |
4 |
2 |
1 |
3 |
D |
|
19 |
Vijaya Bank |
3 |
1 |
3 |
3 |
2 |
2 |
SL |
|
ST*-Super Star [5] ST-Super Star [4] D-Dog [3] SL-Sleeper [2] Q-Question Mark [1]
Based on Table 3 one can categorise the position of banks as:
• The northwest quadrant categorised as ‘Sleeper’ contains those banks whose TE scores are below average and whose ROE is above average. They are likely to improve in efficiency by better management skills. The Bank of Baroda, SBI, UCO Bank and Vijaya Bank have been recognized as ‘Sleeper’ banks. Thus this quadrant contains 21.05 % of the Nationalized banks.
• The southwest quadrant is labelled ‘?’. The banks placed in this quadrant are those that work with low efficiency and low profitability. Luckily no banks are falling in this quadrant.
• The southeast quadrant labelled ‘Dog’ banks are categorised by great efficiency and low profitability. Ten banks are falling in this quadrant. This set has the highest average efficiency. Thus this quadrant contains 52.63 % of the nationalized banks.
• The northeast quadrant considered ‘Star’ comprisessuch banks having both TE score and ROE above average. It is the yardstickfixed with both high efficiency and profitability that the inefficient banks can take a clue from to resolve on their business strategies. The Syndicate Bank, Dena Bank, Corporation Bank, Bank of Baroda and Andhra Bank are located in the ‘Star’ quadrant. The five banks in this quadrant the Syndicate Bank can be measured as super star as its efficiency score is 1. Banks in this quadrant are likely to take the principal role in the banking industry.
This piece of work is based on the use of Data Envelopment Analysis to calculate the comparative efficiency of nationalized banks of India. The result of this piece of work tellsdefiniteproductive managerial acumens into appraising and progressing of banking operations. The projectedoutcomestudy shows that 21% banks are fairly efficient with the maximum efficiency score 1 throughout the study period.
It is witnessed that there is a fluctuatingtendency in their mean of technical efficiency [CRS] of Nationalized Banks of India from 2013 to 2018, the score lies in the interval [0.8694, 1.000]. The average efficiency of all the banks for the entire period is less than 1.
The Investigationaccountintenselytalks that six banks reached maximum efficiency score 1 for the year 2013 – 2018. It is detected that there is a fluctuatingtendency in their mean of technical efficiency of commercial banks of India from 2013 – 2018, the score lies in the interval [90.92, 1.000]. The average efficiency of all the banks for the entire period is less than 1.
The piece of work engaged the Efficiency-Profitability Matrix methodologyto part the Nationalized Banks of India into four groups as follows:
The piece of workestablish that about 26.32 % Nationalized Banks of India can be picked as ‘Star’ banks. A further divisioninside the ‘Star’ shows those banks that have attained a technical efficiency score equal to 1 and an above average value of ROE, considered as ‘ super star’. The Syndicate Bank is in the “super star” group.
The ‘?’ banks musttruly re-think their long-term business plans, or else as they remain ‘weak’ or ‘distressed’ they may be marks for potential merger or acquisition scenarios in the banking industry. Lucky no bank lies in this quadrant.
Total, four banks have positioned in the ‘Sleeper’ quadrants. The resource employmentprocedure of these four banks does not task well and features substantialconsumption of resources. These are latentgoals for mergers & acquisitions by more efficient banks. With these banks establishing 21.05% of the banking population we can announce quite securely that substantialinadequacies exist in the Nationalized Banks in India.
Ten banks are in the group categorised ‘Dog’ banks. This cluster has the highest average efficiency but their profitability level is quite small. The Supreme of 52.63% of the Nationalized Banks of India lies in this Quadrant. Most prominently, the reading sets up aassociation table for the banks to contest and progress with some quantifiable guides.
AlKhathlan, K and Malik, S. A. (2010), Are Saudi Banks Efficient? Evidence Using Data Envelopment Analysis (DEA), International Journal of Economics and Finance, Vol. 2, No.2, pp. 53-58.
Barth, J, Caprio, G. and Levine, R (2001), The Regulation and Supervision of Banks Around the World, A New Database. In: Litan, R. and Herring, R. (Eds.), IntegratingEmerging Market Countries into the Global Financial System, Brookings Institution Press, (Washington, D.C).
Berger, A. N, Humphrey, D. D (1997), Efficiency of financial institutions: international survey and directions for future research, European Journal of Operational Research, Vol. 98, No. 2, pp. 175-212.
Boussofiane, A, Dyson, R.G and Thanassoulis E (1991), Applied Data Envelopment Analysis, European Journal of Operational Research, Vol. 52, No. 1, pp. 1–15.
Camanho, A.S and Dyson, R.G (1999), Efficiency, size, benchmarks and targets for bank branches: an application of data envelopment, Journal of the Operational Research Society, Vol.50, No. 9, pp. 903.
Charnes, A., Cooper, W.W and Rhodes, E (1978), Measuring the efficiency of decision making units, European Journal of Operation Research, Vol. 2, pp. 429-444.
Demirgüç-Kunt, A, Levine, R and Min, H. G (1998), Opening to Foreign Banks: Issues of Stability, Efficiency and Growth, In Proceedings of Bank of Korea Conference on the Implications of Globalization of World Financial Markets, December 1998.
Farrel, M.J (1957), The measurement of Productivity efficiency, Journal of Royal Statistical Society (A), Vol. 120, pp. 253 – 281.
Ferrier, G. D., and Lovell, C. A. K., (1990). “Measuring Cost Efficiency in Banking: Econometric and Linear Programming Evidence”, Journal of Econometrics, Vol. 46, p. 229245.
Izah Mohd Tahir, Nor Mazlina Abu Bakar and SudinHaron (2009), Evaluating Efficiency of Malaysian Banks Using Data Envelopment Analysis, European Journal of Scientific Research, Vol. 4, No.8, pp. 96 – 106.
Maudos, J, Pastor, J. M., Perez, F and Quesada, J (2002), Cost and profit efficiency in European banks, Journal of International Financial Markets, Institutions and Money, Vol. 12, pp. 33-58.
Mehmet Hasan Eken and Suleyman Kale, (2011), Measuring bank branch performance using Data Envelopment Analysis (DEA): The case of Turkish bank branches, African Journal of Business Management, Vol. 5, No. 3, pp. 889-901.
Mohammad Romel Bhuia, Azizul Baten, Anaton Abdulbasah Kamil and Nandini Deb (2012), Evaluation of Online Bank Efficiency in Bangladesh: A Data Envelopment Analysis (DEA) Approach, Journal of Internet Banking and Commerce, Vol. 17, No. 2, pp. 1-17.
Nigmonov, A (2010), Bank Performance and Efficiency in Uzbekistan, Eurasian Journal of Business and Economics, Vol. 3, No. 5, pp. 1-25.
Pastor J, Lovell, C. A and Tulkens, H (2006), Evaluating the financial performance of bank branches, Annals of Operations Research, Vol. 145, pp. 321–337.
Sangeetha, R and Jain Mathew (2013), A study on technical efficiency of public sector banks in India, International Journal of Business and Economics Research, Vol. 2, No. 2, pp. 15-21.
Seiford, L. M and Zhu, J. (1999), Profitability and Marketability of the Top 55 U.S. Commercial Banks, Management Science, Vol. 45, No. 9, pp. 1270-1288.
Sufian, F (2009), Determinants of bank efficiency during unstable macroeconomic environment: Empirical evidence from Malaysia, Research in International Business and Finance, Vol. 23, pp. 54–77.
Tobias Olweny and Themba Mamba Shipho (2011), Effects Of Banking Sectoral Factors On The Profitability Of Commercial Banks In Kenya, Economics and Finance Review, Vol. 1, No. 5,pp. 01-30.
1. Associate Professor, Faculty of Management Sciences, Siksha O Anusandhan (Deemed to be University), Bhubaneswar, Corresponding Author, Email: sarojkantabiswal@soa.ac.in Research Scholar, Faculty of Management Sciences, Siksha O Anusandhan (Deemed to be University), Bhubaneswar. India
2. Research Scholar, Faculty of Management Sciences, Siksha O Anusandhan (Deemed to be University), Bhubaneswar. India
[Index]
revistaespacios.com

This work is under a Creative Commons Attribution-
NonCommercial 4.0 International License