![]() ISSN 0798 1015
ISSN 0798 1015

![]() ISSN 0798 1015
ISSN 0798 1015
Vol. 38 (Nº 09) Año 2017. Pág. 14
Valdete Campos AMBROZIO 1; Marco Antonio Aparecido BARELLI 2; Alessandro Aparecido Brito dos SANTOS 3; Claudete Rosa da SILVA 4; Carla GALBIATI 5; Juliana Poletine PARISOTTO 6; Leonarda Grillo NEVES 7
Recibido:01/09/16 • Aprobado: 01/10/2016
ABSTRACT: This work aimed to evaluate the resistance of different Phaseolus vulgaris L. genotypes under no choice tests, by using 34 bean genotypes belonging to BAG-UNEMAT, two genotypes from IAC (resistant) and EMBRAPA (susceptible). The experiment was conducted at Laboratório de Recursos Genéticos & Biotecnologia belonging to UNEMAT, Caceres Campus, Mato Grosso State, in randomized entirely design with eight repetitions. It was possible to identify significant differences for almost all evaluate characteristics, making it possible to classify studied genotypes according to resistance levels: genotype 36 resistant, 3, 5, 12, 19, 31 and 33 genotypes as intermediaries (moderately resistant) and the other genotypes were classified as susceptible. |
RESUMO: Este trabalho teve como objetivo avaliar a resistência de diferentes genótipos de Phaseolus vulgaris L., em teste sem chance de escolha, utilizando 34 genótipos de feijoeiro do BAG-UNEMAT, e dois genótipos oriundos do IAC (resistente) e EMBRAPA (suscetível). O experimento foi conduzido no Laboratório de Recursos Genéticos & Biotecnologia da UNEMAT, Campus de Cáceres – MT, com oito repetições. Constatou-se que os genótipos avaliados foram classificados de acordo com os graus de resistência, genótipo 36 resistente, genótipos 3, 5, 12, 19, 31 e 33 como intermediários (moderadamente resistente) e os demais genótipos como suscetíveis. |

Common bean (Phaseolus vulgaris L.) is a legume with expressive importance agricultural and food, widely distributed throughout Brazilian territory, constituting a sort of great interest for sustainable development (Angioi et al., 2010).
The stage of bean grains store deserves attention, since the quality of grains is highly compromised by the presence of stored insect. In this context, pests that attack stored grain, includes bruchids Zabrotes subfasciatus(Boh) (Insecta: Coleoptera), able to compromise the stores when the storage is not conducted adequately (Mazzonetto, 2002).
Storage pests may cause quantitative losses, reaching up to 10% of total produced, each year in Brazil, but qualitative losses are the most worried and may compromise totally the use of produced grain (Lorini, 2008).
Z. subfasciatus larvae promote seed damage by opening galleries for their food, completely destroying cotyledons, affecting gain quality due to reduction of nutritional value, dejections presence, eggs and dead insects, also causing commercial product devaluation, by loss of grain germination capacity destined for sowing and by favoring the attack of secondary pests and microorganisms (Gallo et al., 2002; Lorini, 2002).
Several studies developed in order to evaluate the resistance of common bean genotypes to the bean weevil have been conducted. In searches conducted by Botelho et al. (2002) it was possible to verify resistance sources to this storage pest in Arc. 3 and Arc. 2 lines. Arc. 1S and Arc. 2 genotypes were classified as resistant by Baldim & Lara (2004).
Non-preference for oviposition was detected by Ribeiro-Costa et al. (2007) who also verify this resistance in IAPAR 44 genotype. Resistance type non-preference for food and/or antibiosis was studied by Bottega et al. (2012), when HAV 56 genotype showed this kind of resistance. Moraes et al. (2011), verify that RAZ 56, Arc.2, RAZ 55, RAZ 49 and RAZ 59 genotypes showed resistance for non-preference for food and/or antibiosis.
Baldin & Pereira (2010) determined the same kind of resistance for Arc.1s, Arc.1 genotypes, when these expressed high antibiosis levels and Arc.2, Arc.3 and Arc.4 genotypes showing the same mechanism, however, in inferior levels, presenting the major development periods, smaller adult weight and fewer number of emerged insects. Lara (1997) verifies the non-preference for food in Arc. 3 and Arc.4 lines, however Boiça Junior et al. (2002) constates it in IAPAR-MD-806 genotype.
Girão Filho et al. (2012), verified that UFPI 468 and UFPI 495 accesses showed resistance evidence kind antixenosis with minor preference for oviposition, while UFPI 515 and UFPI 220 accesses were the most attractive and consequently, the most preferred for oviposition. Bottega et al. (2013), verified that UEG05 genotype was less preferred for oviposition and UEG13 genotype showed resistance kind non-preference for food and/or atibiosis with less female mass.
In this context, the present study aimed to evaluate the resistance of common bean genotypes from the southwestern region of Mato Grosso State to Zabrotes subfasciatus.
Common bean genotypes were evaluated at Laboratório de Recursos Genéticos & Biotecnologia (LRG&B), located at Campus Universitário de Cáceres, belonging to Departamento de Agronomia da Universidade do Estado de Mato Grosso – UNEMAT.
Pests used in the experiment came from Universidade Estadual Paulista, Faculdade de Ciências Agrárias e Veterinária, Departamento de Fitossanidade (UNESP - Jaboticabal, SP), created in carioca bean (susceptible) normally used for storage generations in Brazil (Boiça Junior et al., 2002; Mazzonetto & Boiça Junior,1999; Mazzonetto & Vendramim, 2002; Ribeiro-Costa et al., 2007) and multiplied in plastic flasks of 2,0 L, with surface covered by cloth, hold on with elastics for allowing intern aeration. Every 30 days material was waddled and adults separated in order to initiate the infestation in new flasks.
In studies about common bean genotypes resistance, it was used 34 genetic materials from Banco Ativo de Germoplasma belonging to Universidade do Estado de Mato Grosso- UNEMAT (BAG-UNEMAT), collected from rural producers in Caceres region, Mato Grosso State and submitted to genetic divergence analysis, with a susceptible genotype provided by Instituto Agronômico de Campinas - IAC and the resistant one holding arcelin (Arc 1) donated by Centro Nacional de Pesquisa de Arroz e Feijão (CNPAF- EMBRAPA), as follow: 1) Bag-Unemat–18; 2) Bag-Unemat–28; 3) Bag-Unemat–11; 4) Bag-Unemat–24; 5) Bag-Unemat–22; 6) Bag-Unemat–39; 7) Bag-Unemat–17; 8) Bag-Unemat – 04; 9) Bag-Unemat – 03; 10) Bag-Unemat – 29; 11) Bag-Unemat – 19; 12) Bag-Unemat – 35; 13) Bag-Unemat- 42; 14) Bag-Unemat – 26; 15) Bag Unemat – 31; 16) Bag-Unemat – 37; 17) Bag-Unemat – 36; 18) Bag-Unemat – 41; 19) Bag-Unemat – 38; 20) Bag-Unemat – 56; 21) Bag-Unemat – 45; 22) Bag-Unemat – 47; 23) Bag-Unemat – 53; 24) Bag-Unemat – 54; 25) Bag-Unemat – 60; 26)Bag-Unemat – 58; 27) Bag-Unemat – 61; 28) Bag-Unemat – 05; 29) Bag-Unemat – 07; 30) Bag-Unemat – 02; 31) Bag-Unemat – 33; 32) Bag-Unemat – 44; 33) Bag-Unemat – 08; 34) Bag-Unemat – 14; 35) Bolinha and 36) Arc 01.
The experiment was installed using randomized entirely design with eight repetitions with plots comprised of 10 grams of grain beans. Insects from multiplying containers were placed in a room with low temperature in order to reduce mobility and allow a better handling. Then, pests have been removed from the seeds by using a sieve and separated by sex for later test constitution.
In each repetition it was used seven couple of adult insects (Moraes et al., 2011; Bottega et al., 2012; Bottega et al., 2013), located in plastic recipients of 140 ML with 6.0 cm height and 5.8 cm diameter containing samples of 10 grams of grain from different genotypes.
Experimental units with different bean genotypes were capped after receiving the insects to prevent and in order to maintain these ones under laboratory conditions with controlled temperature and relative humidity.
Insects remained in contact with grains for seven days, according to the methodology described by Schoonhoven & Cardona (1982). After this confinement period, pests were removed with the aid of a sieve and subsequently oviposition evaluation process started determined by counting the number of viable eggs and total ones per repetition; number of emerged adult insects, around twenty-five days from confinement period with daily observations.
Later, newly emerged insects were packed in bottles (2.5 x 5.0 cm) and immediately conducted to a freezer with -26o C for a quick interruption of life cycle, avoiding weight losses of and keeping the perfect conservation state. Containers with grain beans were kept under the same conditions until the experiment conclusion. The development period from eggs to adults was evaluated by the sum of days elapsed from plots infestation until the last emergency day. Daily it was assessed emerged insects number, up to the moment it was not observed adults emergence for three consecutive days (Marsaro Junior & Vilarinho, 2011; Carvalho et al., 2011).
The percentage of emergency insects evaluated in relation to total number of eggs and number of emerged adult insects, mean weight of emerged adult insects (mg): ratio between insects total weight and total number of emerged insects. At emergency end adults were separated by sex and weighted in analytical balance with accuracy to 0.0001 grams, Tecnal®. For insects total dry weight determination it was used recipients containing the insects, opened and placed in forced air sterilization chamber Deleo®, for 48 hours at 50o C. Insects dry weight was determined by the difference in relation to aliquots weight. Mortality percentage was calculated in relation to the number of viable eggs and the number of emerged insects.
Obtained data were subjected to Shapiro-Wilk normality and Levene (1960) homogeneity tests by using SAS computer program SAS (2003). Data outside normal range were transformed into (x + 0.5) ½ with variance analysis performed. Means of all characteristics were compared by Dunnett test. It was also conducted clustering analysis, dissimilarity measure (Euclidean Distance) with posterior use UPGMA method and principal component analysis in order to classify genotypes presenting maximum similarity between the groups. For all statistical analysis it was employed Genes program (Cruz, 2010).
The characteristics viable eggs, eggs total number and percentage of viable eggs, showed no significant difference between the evaluated genotypes exhibiting uniformity in oviposition. Therefore oviposition related parameters are not sufficient to determine the resistance present in these genotypes, while for other characteristics it was identified significant difference.
According to Dunnett test, for the characteristic number of emerged males the following genotypes 15, 12, 3, 19, 5 and 33 were grouped in intermediate form with values ranging from the ones found for resistant and susceptible controls, while the remaining genotypes were allocated with susceptible control (35) indicating the susceptibility of these genotypes (Table 1).
For the characteristic number of females emerged all genotypes were clustered with susceptible control. Analyzing the total number of emerged insects, it was found that all genotypes were grouped with susceptible control. However, when comparing the percentage of viable eggs with emerged insects’ total, resistant control showed the lowest average mean. According to Lara (1991), not necessarily genotypes with most oviposition are most susceptible, because there are other factors that prevent insect larval development, and so, a genotype with high oviposition may still reveal to be resistant.
In relation to the period of development from egg to adult stage, except for genotype 13 that was classified as intermediary all other genotypes were clustered as susceptible. When it’s possible to compare both controls, it may be observed that susceptible control showed average of 35.11 emergency days, while resistant control resulted in 39.43 emergency days.
On the contrary, genotype that presented the highest development period was 13 with 36.93 emergency days and genotypes that showed the lowest development period were 33, 18 and 16 with 33.87; 33.75 and 33.43 emergency days, respectively. Such data showed evidence of genotypes susceptibility, since it presented the lowest period of Z. subfasciatus development. According to Girão Filho et al. (2012), when insect’s development period shows low range among treatments, there is an insight of uniform susceptibility.
Results found in this work are similar to those published by Ribeiro-Costa et al. (2007), that working with beans, verified a insects development period stretching, with values ranging from 27.8 in a genotype without arcelin and 41.7 days in genotypes Arc 1 with arcelin.
In relation to emergency percentage, there was no significant difference between evaluated genotypes. However all genotypes were clustered with the susceptible ones: 31, 34 and 19 showing the smallest emergency percentages (68.97; 68.60 and 67.52% respectively). According to these results, it may be inferred that the resistance is classified as antibiosis type. In relation to feed preference in immature stages, genotype 27 presented the highest percentage (87.72%) when compared with other evaluated genotypes including the susceptible control.
For the characteristic males weight, there was significant difference among evaluated genotypes, with genotype 19 (1.08 mg) showed the lowest males weight being grouped with resistant control (1.02 mg), suggesting insights of no preference resistance type for feed or antibiosis. Genotype 11 (1.39 mg) was classified as intermediate between susceptible and resistant controls, while remaining genotypes were grouped with susceptible control indicating the susceptibility of them.
For female’s weight all genotypes behaved as the susceptible control, soon there is evidence of these genotypes susceptibility. Reducing weight in males and females fed with arcelin carrying materials (Arc1) was recorded by Lara (1997), Mazzonetto & Vendramim (2002) and Ribeiro-Costa (2007).
In relation to males dry weight it was observed that 5, 19, 3 and 33 genotypes were allocated to intermediate form where values ranged from those ones found to resistant and susceptible controls. Remaining genotypes were grouped along with susceptible control (35). For female’s dry weight, all genotypes were grouped along with susceptible control (35).
In relation to insect’s total dry weight, it was observed that genotypes evaluated, were grouped with susceptible control, also consumed by insects. However, 31, 33 and 5 genotypes, evidenced insights of non-resistance preference for feed, not excluding the possibility of 31 and 33 genotypes also present resistance of antibiosis type, since presented one of the lowest percentages of insects emergency with 68.97 and 68.60%, respectively. Bottega et. al. (2012) verified that genotypes less consumed were also those one who showed the lowest percentages of emerged insects.
Analyzing mortality percentage in immature stages (larval instars and/or pupa), it was verified that all genotypes evaluated clustered with susceptible control, ranging from 12.27% to 31.39% of mortality, being susceptible control showing 24.46% mortality while resistant control presented 92.66% in immature stages, reducing emergency percentage and lengthening Z. subfasciatus biological cycle. In studies conducted by Ribeiro-Costa et al. (2007), assessing P. vulgaris genotypes, authors observed values of mortality percentage ranging from 10.4% to 86.6% in Perola cultivar and Arc 1 genotype, respectively.
The high resistance antibiosis type verified by these authors is due to the action of arcelin protein, in this genotype arcelina (Raja-Costa et al. 2007). Studies conducted by Wanderley et al. (1997) showed that lines with arcelina 1 and 2 exerted drastic effect on Z. subfasciatus biology, when compared to the cultivars and lines without protein, showing the resistance mechanism of antibiosis type.
Through hierarchical cluster analysis, it was observed that there was no distinction among genotypes, dividing them into groups according to similarity degree (Figure 1). So, it was fixed Euclidean distance in 40%, suggesting evaluated genotypes division in three distinct groups, where the first group allocated 31 genotypes characterized as susceptible, the second group composed by 33, 3, 5 and 19 genotypes classified as intermediaries and third group formed by genotype 36 (resistant). Cofenetic correlation coefficient (CCC), applied to T test clustering method showed significant values, with r = 0.91 (P < 0.01) demonstrating reliability in the ratio between dissimilarity matrix and dendrogram, with a satisfactory fit, enabling the realization of inference by means of visual evaluation. For Monteiro et al. (2010), as closer the unity, better the representation of similarity matrix in dendogram form.
Observing the results obtained by principal component analysis, it was possible to verify that first component principal (CP1) concentrated 63.55% of variability contained in original characteristics, with these ones the characteristics that contributed most: total of emerged insects, insects total dry weight, emergency percentage, dry weight of males insects and mortality percentage (Figure 2). Second component principal (CP2) concentrated 19.22% of variability present in original characteristics and characteristics that contributed most were number of emerged male insects, females insects weight and males insects weight.
It was observed that, in principal component analysis, it was possible to obtain results similar to UPGMA clustering analysis, with genotypes showing similarity, with the same common components, that contributed to groups division.
From the results obtained in cluster analysis and its principal components, it was possible to classify genotypes according to resistance type, no preference for feed and/or antibiosis; genotype 36 (resistant); genotypes 3, 5, 12, 19, 31 and 33 as intermediaries (moderately resistant) and the other ones (susceptible). According to Bottega et al. (2013), the use of obtained results from clustering analysis and principal components it is possible to classify genotypes according to resistance degree present in them. In this way it is recommended the use of intermediate genotypes in future crop breeding works.
Plant breeding, with the genetic engineering tools has contributed to plant resistance to insects, such as the insertion of genes that confer resistance to certain pests on plants of commercial interest, promoting rapid advances in obtaining the process, as well as identifying resistance sources and incorporation of these crop breeding programs or pest integrated management.
From results obtained it was possible to classify genotypes based on resistance, no preference for feed and/or antibiosis, genotype 36 as resistant; genotypes 3, 5, 12, 19, 31 and 33 as intermediaries/moderately resistant and other genotypes as susceptible.
Genotypes 13 and 33 genotypes presented prolonged development period indicating resistance of antibiosis type. Minor means of emerged insects were verified in 19, 31, 34 and 36 genotypes, showing no preference resistance type for feed and/or antibiosis.
Genotypes 31 and 33 showed the lowest means for emergence percentage, mortality in immature stages and total dry weight, suggesting the resistance type no preference for feed and/or antibiosis.
Angioi, S., Rau, D,, Attene, G., Nanni, L., Bellucci, E., Logozzo, G., Negri, V., Spagnoletti Zeuli, P., Papa, R. (2010) Beans in Europe: origin and structure of the European landraces of Phaseolus vulgaris L. Theoretical and Applied Genetics. 121: 829-843
Baldin, E. L. L., Lara, F. M. (2004) Efeito de temperaturas de armazenamento e de genótipos de feijão sobre a resistencia de Acanthoscelides obtectus (Say)(Coleoptera: Bruchidae). Neotropical Entomology. 33(3): 365-369
Baldin, E. L. L., Pereira, J. M. (2010) Resistência de genótipos de feijão a Zabrotessubfasciatus(bohemann, 1833) (coleoptera: bruchidae). Ciência e Agrotecnologia. 34(6): 1507-1513
Barbosa, F. R., Yokoyama M., Pereira, P. A. A., Zimmermann, F. J. P. (1999). Efeito da proteína arcelina na biologia de Zabrotes subfasciatus (Boheman 1833) em feijoeiro. Pesquisa Agropecuária Brasileira. 34: 1805-1810
Boiça Junior, A. L., Botelho, A. C. G., Toscano, L. C. (2002) Comportamento de genótipos de feijãoao ataque de Zabrotes subfasciatus (Boheman, 1833) (Coleoptera: Bruchidae) em condições de laboratório. Arquivos do Instituto Biológico.69: 51-55.
Botelho, A. C. G., Arthur, V., Amaral Filho, B. F. (2002) Influência de linhagens de feijão portadoras de variantes da proteina arcelina irradiadas sobre a reprodução de Acanthoscelides obtectus (Say)(Coleoptera: Bruchidae). Arquivos do Instituto Biológico. 69 (2): 95-94
Bottega, D. B., Rodrigues, C. A., Jesus, F.G., Silva, A. G., Peixoto, N. (2012) Resistência de genótipos de feijão-vagem ao ataque de bruquíneos, em condições de laboratório. Revista Caatinga. 25: 92-97
Bottega, D. B., Rodrigues, N. E. L., Silva, A. G., Costa, E. N., Boiça Junior, A. L. (2013) Resistência de genótipos de feijão-vagem ao ataque de Zabrotes subfasciatus(Bohemam, 1933) (Coleoptera: Chrysomelidae). Pesquisa Agropecuaria Tropical. 43:18-25
Carvalho, R. O., Lima, A. C. S., Alves, J. M. A. (2011) Resistência de genótipos de feijão-caupi ao Callosobruchus maculatus (Fabr.) (Coleoptera, Bruchidae). Revista agroambiente. 5:50-56
CRUZ, C. D. (2010) Programa Genes – Versão Windows. Viçosa: UFV
Gallo, D., Nankano, O., Silveira Neto, S., Carvalho, R. P. L., Baptista, G. C., Berti Filho, E,. Parra, J. R. P., Zucchi, R. A., Alves, S. B., Vendramim, J. D., Marchini, L. C., Lopes, J. R. S., Omoto, C. (2002) Entomologia agrícola. Piracicaba: EALQ, 920p.
Girão Filho, J. E., Pádua, L. E. M., Silva, P. R. R., Gomes, R. L. F. G., Pessoa, E. F. (2012) Resistência genética de acessos de feijão-fava ao gorgulho Zabrotes subfasciatus (Boh.) (Coleoptera: Bruchidae). Comunicata Scientiae. 3:84-89
LARA, F. M. (1997) Resisteance of wild and near isogenic bean lines with arcelin variants to Zabrotessubfasciatus (Boheman). I- Winter crop. Anais da SociedadeEntomológica do Brasil. 26: 551-560.
Levene, H. (1960) Robust Test for Equality of Variances, in Olkin, I., Grurye, S. G., Hoeffding, W., Madow, W. G., Mann, H. B. (ed) Contributions to Probability and Statistics: Essays in Honor of Harold Hotteling. Stanford University Press, California, United States, 278–292.
Lorini, I. (2002) Descrição, biológica e danos das principais pragas de grãos armazenados. In: Lorini, I., Miike, L. H., Scussel, V. M. (Ed.). Armazenamento de grãos. Campinas, IBGE, p 381-397
Lorini, I. (2008) Manejo integrado de pragas de grãos de cereais armazenados. Passo Fundo, Embrapa Trigo, p 72.
Marsaro Júnior, A. L., Vilarinho, A. A. (2012) Resistência de cultivares de feijão-caupi ao ataque de Callosobruchus maculatus (Coleoptera: Chrysomelidae: Bruchidae) em condições de armazenamento. Revista Acadêmica Ciências Agrárias e Ambientais. 9: 51-55
Mazzonetto, F., Boiça Junior, A. L. (1999) Determinação dos tipos de resistência de genótipos de feijãoao ataque de Zabrotessubfasciatus(Boheman, 1833) (Coleoptera: Bruchidae). Anais da Sociedade Entomológica do Brasil. 28:307-311
Mazzonetto, F., Vendramim, J. D. (2002) Aspectos biológicos de Zabrotes subfasciatus (Boh.) (Coleoptera: Bruchidae) em genótipos de feijão com e sem arcelina. Neotropical Entomology. 31: 435-439
Mazzonetto, F. (2002). Efeito de genótipos de feijãoe de pós de origem vegetal sobre Zabrotes subfasciatus (BOH.) e Acanthoscelidesobtectus (SAY), (Col.: Bruchidae). 134p. Tese (Doutorado). Escola Superior de Agricultura Luiz de Queiroz, Piracicaba.
Monteiro, E. R., Bastos, E. M., Lopes, Â. C. A., Gomes, R. L. F., Nunes, J. A. R. (2010) Diversidade genética entre acessos de espécies cultivadas de pimentas. Ciência Rural. 40:288-293
Moraes, C. P. B., Boiça Junior, A. L., Souza, J. R., Costa, J. T. (2011) Determinação dos tipos de resistência em genótipos de feijão ao ataque de Zabrotes subfasciatus (Coleoptera: Bruchidae). Revista Ceres. 58: 419-424
Ribeiro-Costa, C. S., Pereira, P. R. V. S., Zukovski, L. (2007) Desenvolvimento de Zabrotes subfasciatus (Boh.) (Coleoptera: Chrysomelidae, Bruchinae) em genótipos de Phaseolus vulgaris L. (Fabaceae) cultivados no Estado do Paraná e contendo arcelina. Neotropical Entomology. 36: 560-564
Schoonhoven, A. V., Cardona, C. (1982) Low levels of resistance to the Mexican bean weevil in dry bean. Journal of Economic Entomology.76: 567-569
Wanderley, V. S., Oliveira, J. V., Andrade Junior, M. L. A. (1997) Resistência de cultivares e linhagens de Phaseolus vulgaris L. a Zabrotes subfasciatus (Boh.) (Coleoptera: Bruchidae). Anais da Sociedade Entomológica do Brasil.26: 315- 320
Table 1. Means of oviposition, emergence, feed and mortality of Zabrotes subfasciatus in distinct common bean genotypes with test without choice by Dunnett test, Caceres, Mato Grosso State, 2014.
GEN |
ME1 |
FE |
TE |
PD |
% E |
PM |
PSM |
PF |
PSF |
TPS |
% M |
1 |
21,25 a2 |
17,87 a |
39,12 a |
34,81 a |
80,68 a |
1,53 a |
14,85 a |
2,75 a |
23,06 a |
37,91 a |
19,31 a |
2 |
18,37 a |
20,00 a |
38,37 a |
34.31 a |
80,85 a |
1,48 a |
13,06 a |
2,66 a |
26,36 a |
39,42 a |
19,15 a |
3 |
10,37 ab |
12,75 a |
23,12 a |
34.37 a |
83,15 a |
1,40 a |
6,70ab |
2,34 a |
16,71 a |
23,41 a |
16,84 a |
4 |
16,50 a |
15,75 a |
32,25 a |
34.43 a |
83,29 a |
1,47 a |
11,53 a |
2,77 a |
22,11 a |
33,65 a |
16,70 a |
5 |
9,00ab |
8,87ª |
17,87 a |
35.06 a |
77,15 a |
1,56 a |
6,96ab |
2,71 a |
11,76 a |
18,72 a |
22,84 a |
6 |
19,00 a |
21,87 a |
40,87 a |
34.31 a |
86,22 a |
1,49 a |
13,63 a |
2,78 a |
30,43 a |
44,07 a |
13,77 a |
7 |
23,62 a |
24,37 a |
48,00 a |
35.37 a |
76,97 a |
1,47 a |
17,25 a |
2,69 a |
32,40 a |
49,65 a |
23,02 a |
8 |
14,87 a |
13,37 a |
28,25 a |
34.00 a |
75,68 a |
1,54 a |
10,98 a |
2,78 a |
18,65 a |
29,63 a |
24,31 a |
9 |
19,12 a |
19,00 a |
38,12 a |
34,56 a |
86,18 a |
1,49 a |
13,77 a |
2,42 a |
25,87 a |
39,65 a |
13,81 a |
10 |
15,00 a |
19,00 a |
34,00 a |
35,37 a |
86,48 a |
1,51 a |
11,95 a |
2,69 a |
24,74 a |
36,69 a |
13,52 a |
11 |
18,50 a |
22,50 a |
40,75 a |
36,18 a |
82,85 a |
1,39 ab |
15,07 a |
2,55 a |
27,81 a |
42,88 a |
17,15 a |
12 |
11,12 ab |
11,37 a |
22,50 a |
34,94 a |
75,27 a |
1,49 a |
7,66a |
2,78 a |
15,44 a |
23,10 a |
24,72 a |
13 |
19,75 a |
16,50 a |
36,25 a |
36,94 ab |
86,06 a |
1,41 a |
12,91 a |
2,66 a |
21,02 a |
33,94 a |
13,93 a |
14 |
19,62 a |
20,50 a |
40,12 a |
34,50 a |
86,44 a |
1,55 a |
14,22 a |
2,83 a |
29,42 a |
43,65 a |
13,55 a |
15 |
11,12 ab |
14,12 a |
25,25 a |
34,00 a |
80,65 a |
1,50 a |
7,85a |
2,73 a |
18,61 a |
26,46 a |
19,34 a |
16 |
15,87 a |
16,00 a |
31,87 a |
33,44 a |
74,51 a |
1,41 a |
11,26 a |
2,75 a |
23,12 a |
34,39 a |
25,48 a |
17 |
17,25 a |
15,62 a |
32,87 a |
34,19 a |
84,66 a |
1,49 a |
12,21 a |
2,73 a |
22,45 a |
34,66 a |
15,33 a |
18 |
17,75 a |
12,50 a |
30,25 a |
33,75 a |
82,74 a |
1,54 a |
12,61 a |
2,79 a |
18,61 a |
31,22 a |
17,25 a |
19 |
13,00 ab |
15,00 a |
28,00 a |
30,31 a |
67,52 a |
1,08b |
9,33ab |
2,41 a |
19,97 a |
29,31 a |
19,97 a |
20 |
15,62 a |
17,25 a |
32,87 a |
35,50 a |
83,77 a |
1,61 a |
12,26 a |
2,54 a |
22,86 a |
35,12 a |
16,22 a |
Continue...
Table 1. Continue...
GEN |
ME |
FE |
TE |
PD |
% E |
PM |
PSM |
PF |
PSF |
TPS |
% M |
21 |
18,50 a |
18,62 a |
37,12 a |
34,06 a |
79,36 a |
1,45 a |
14,06 a |
2,67 a |
21,66 a |
35,72 a |
20,63 a |
22 |
20,62 a |
17,75 a |
38,37 a |
34,50 a |
79,19 a |
1,49 a |
15,92 a |
2,77 a |
25,20 a |
41,12 a |
20,80 a |
23 |
14,50 a |
16,00 a |
30,50 a |
34,56 a |
84,76 a |
1,47 a |
10,02 a |
2,71 a |
23,42 a |
33,45 a |
15,24 a |
24 |
24,25 a |
22,12 a |
46,37 a |
35,25 a |
85,53 a |
1,51 a |
17,61 a |
2,81 a |
34,79 a |
52,40 a |
14,47 a |
25 |
15,75 a |
13,62 a |
29,37 a |
35,81 a |
82,30 a |
1,39 a |
10,83 a |
2,57 a |
17,29 a |
28,12 a |
17,69 a |
26 |
14,75 a |
17,25 a |
32,00 a |
34,81 a |
83,33 a |
1,48 a |
10,68 a |
2,65 a |
22,18 a |
32,87 a |
16,66 a |
27 |
15,50 a |
14,12 a |
29,62 a |
34,75 a |
87,72 a |
1,46 a |
10,95 a |
2,50 a |
19,26 a |
30,21 a |
12,27 a |
28 |
16,00 a |
14,37 a |
30,37 a |
34,56 a |
81,21 a |
1,43 a |
10,66 a |
2,69 a |
19,14 a |
29,80 a |
18,79 a |
29 |
18,12 a |
21,62 a |
39,75 a |
35,44 a |
82,56 a |
1,42 a |
12,55 a |
2,69 a |
30,25 a |
42,80 a |
17,43 a |
30 |
17,87 a |
17,75 a |
35,62 a |
35,18 a |
80,28 a |
1,61 a |
14,96 a |
2,50 a |
21,80 a |
36,76 a |
19,71 a |
31 |
12,25 a |
10,25 a |
22,50 a |
34,81 a |
68,97 a |
1,52 a |
8,83a |
2,75 a |
13,62 a |
22,46 a |
31,02 a |
32 |
14,62 a |
14,50 a |
29,12 a |
34,12 a |
84,06 a |
1,48 a |
10,52 a |
2,75 a |
20,97 a |
31,50 a |
15,94 a |
33 |
9,37ab |
11,62 a |
21,00 a |
33,87 a |
73,24 a |
1,49 a |
6,53ab |
2,48 a |
16,48 a |
23,02 a |
26,75 a |
34 |
12,87 a |
13,37 a |
26,25 a |
34,43 a |
68,60 a |
1,44 a |
8,20a |
2,74 a |
18,45 a |
26,65 a |
31,39 a |
35 |
12,00 a |
14,87 a |
26,87 a |
35,11 a |
75,53 a |
1,41 a |
8,21a |
2,54 a |
18,15 a |
26,36 a |
24,60 a |
36 |
2,87 b |
1,00 b |
3,87 b |
39,43b |
6,22 b |
1,02b |
1,12 b |
0,81b |
1,10 b |
2,22 b |
80,16b |
DMS |
1,63 |
1,61 |
2,20 |
0,19 |
1,37 |
0,13 |
1,43 |
0,21 |
1,94 |
2,30 |
2,63 |
1/emerged males (ME), emerged females (FE), total of emerged insects (TE), development period from egg to adult (PD), emergency percentage (% E), males weight (PM), males dry weight (PSM), females weight (PF), females dry weight (PSF), total dry weight of insects (TPS) and percentage of mortality in adult stages (% M). Original data. Data transformated in (x+0,5)1/2 for analysis. 2Means followed by the same letter in column do not differ significantly, at 5%, by Dunnett test; ns = non significative.
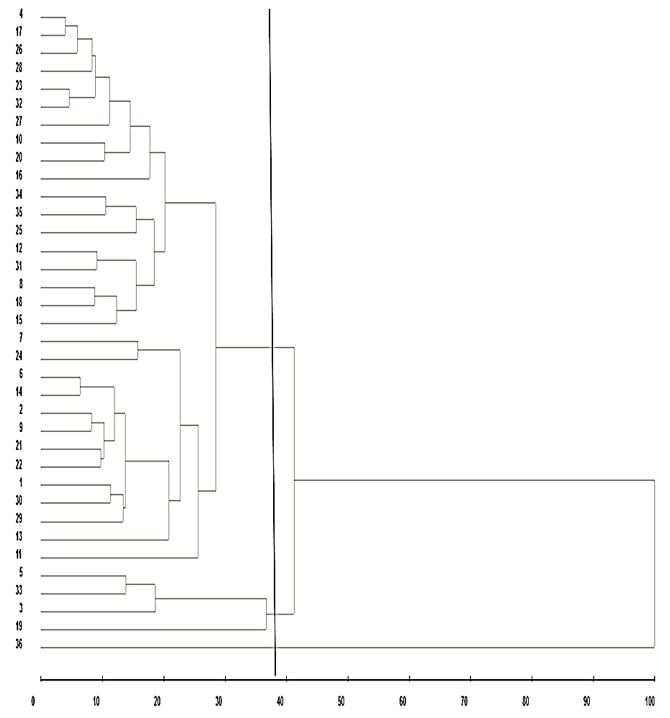
Figure 1. Illustrative dendogram for Z. subfasciatus resistance among 36 common bean genotypes
by test without choice, obtained by UPGMA, based in dissimilarity matrix Caceres, Mato Grosso State, 2014.
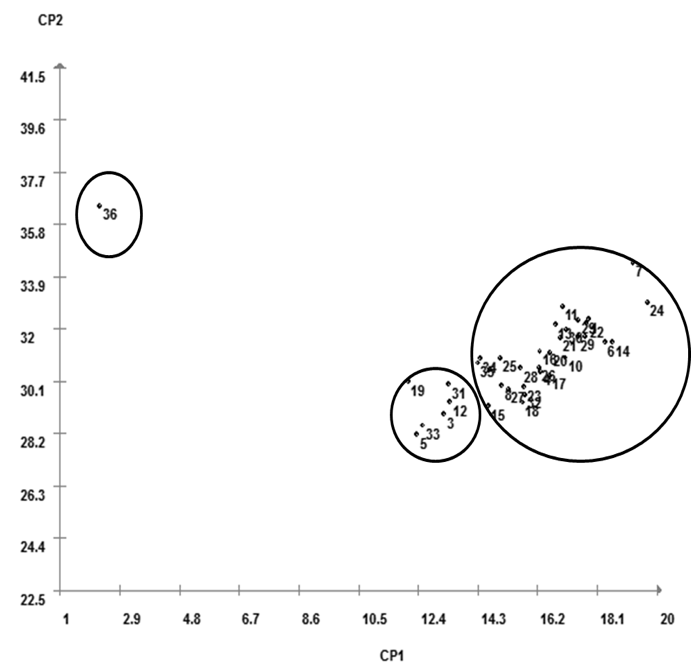
Figure 2. Distribution of resistance to Z. subfasciatus in common bean genotypes,
according to principal components analysis, for the test without choice, Caceres, Mato Grosso State, 2014.
1. Universidade do Estado de Mato Grosso (UNEMAT), Departamento de Agronomia, Cáceres, MT, Brasil. E-mails: vallcamposs@hotmail.com , marcobarelli@terra.com.br , carla@unemat.br , leonardaneves@unemat.br
2. Universidade do Estado de Mato Grosso (UNEMAT), Departamento de Agronomia, Cáceres, MT, Brasil. E-mails: vallcamposs@hotmail.com , marcobarelli@terra.com.br , carla@unemat.br , leonardaneves@unemat.br
3. Doutorando em Genética e Melhoramento de Plantas, Universidade do Estadual de Maringá, UEM, Maringá, PR. E-mail: alessandro.agrocerrado@hotmail.com
4. Universidade Federal Rural da Amazônia (UFRA), Departamento de Agronomia, Parauapebas, PA, Brasil.E-mail:clararoze@yahoo.com.br
5. Universidade do Estado de Mato Grosso (UNEMAT), Departamento de Agronomia, Cáceres, MT, Brasil. E-mails: vallcamposs@hotmail.com , marcobarelli@terra.com.br , carla@unemat.br , leonardaneves@unemat.br
6. Universidade Estadual de Maringá (UEM), Departamento de Ciências Agronômicas, Maringá, PR, Brasil. E-mail: juliparisotto@hotmail.com
7. Universidade do Estado de Mato Grosso (UNEMAT), Departamento de Agronomia, Cáceres, MT, Brasil. E-mails: vallcamposs@hotmail.com , marcobarelli@terra.com.br , carla@unemat.br , leonardaneves@unemat.br