
Vol. 39 (Number 42) Year 2018 • Page 35
Alexander FAERMAN 1; Dmitri IVANOV 2; Anastasia KURILOVA 3
Received: 19/05/2018 • Approved: 10/06/2018
ABSTRACT: The article dwells upon specific features of operation of agro-industrial enterprises involved in cultivation of agricultural products under the conditions of protected ground. The most significant factors which place significant restrictions on the economic component of activity are seasonal demand for the products, and, consequently, significant fluctuations in prices, limited number of areas of protected and heated plots of ground, as well as the need to sell considerable volume of yield through the wholesale buyers due to limited storage life of products. These factors must be taken into account in the formulation of economic and mathematical problems of optimization of the operating activities of these enterprises. The article is aimed at simulating the productive-economic activity of agro-industrial enterprises under the conditions of protected ground. The authors have developed the optimization model for the utilization of agriculturally used areas by the enterprises which cultivate agricultural products with the use of hothouses, taking into account the restrictions on the area of the piece of land, yield values, possible volume of sales and assortment policy during a particular period of time. This model allows forming the optimal program of cultivation of products which ensures the maximum economic effect. In addition, an optimal pricing model has been developed for the products sold which allows harmonizing the economic interest the interests of the producer and the wholesale buyers and receive additional economic effect in the system under consideration. |
RESUMEN: El artículo se basa en las características específicas de la operación de las empresas agroindustriales involucradas en el cultivo de productos agrícolas bajo las condiciones de un terreno protegido. Los factores más importantes que imponen restricciones significativas al componente económico de la actividad son la demanda estacional de los productos y, en consecuencia, fluctuaciones significativas en los precios, un número limitado de áreas de parcelas de terreno protegidas y climatizadas, así como la necesidad de vender considerables Volumen de rendimiento a través de los compradores mayoristas debido a la limitada vida de almacenamiento de los productos. Estos factores deben tenerse en cuenta en la formulación de problemas económicos y matemáticos de optimización de las actividades operativas de estas empresas. El artículo tiene como objetivo simular la actividad productiva-económica de las empresas agroindustriales en condiciones de suelo protegido. Los autores han desarrollado el modelo de optimización para la utilización de áreas de uso agrícola por parte de las empresas que cultivan productos agrícolas con el uso de invernaderos, teniendo en cuenta las restricciones en el área del terreno, los valores de rendimiento, el posible volumen de ventas y el surtido. política durante un determinado período de tiempo. Este modelo permite formar el programa óptimo de cultivo de productos que garantiza el máximo efecto económico. Además, se ha desarrollado un modelo de precios óptimo para los productos vendidos, que permite armonizar el interés económico de los intereses del productor y de los compradores mayoristas y obtener un efecto económico adicional en el sistema considerado. |
The agricultural industry is booming in the Russian Federation today. In terms of output of certain types of products, the country established itself as a leader in the world market in 2017. The output of agricultural products in Russia at year-end 2017, taking into account the refined data on the production of certain types of agricultural products, has increased as compared to the indicator for the previous year by 2.4% and reached RUB 5.098 trillion [1]. For example, the volume of production of wheat has increased by 12,569 thousand tons, the volume of production of barley has increased by 2,606 thousand tons, the volume of production of oil-bearing-crops has increased by 236.6 thousand tons. The production of vegetables occupies a special place in agriculture. The harvesting of vegetables cultivated on the field and in protected ground increased by 108.4 thousand tons in 2017 [1]. Severe climatic conditions in many regions of Russia preclude from fully meeting the demand for these products in the winter and spring period. For example, according to the Ministry of Agricultural Development, 2.3 million tons of tomatoes on the field and 330 thousand tons in protected ground [2] were grown in 2017 in Russia. Hence, self-sufficiency in tomatoes grown on the field within the country, according to the estimates of agricultural department, amounted to 56%. The market saturation with domestic products is approximately one half as high in winter, and it amounts to no more than 20−25% during the peak winter season. This circumstance necessitates the importation of products in greater volume. The total area of the hothouses in the country has increased by almost 10% - up to 2.6 thousand ha in 2017 [3].
Hence, the rapid development of production of agricultural products under the conditions of protected ground necessitates the development of economical and mathematical tools that allows forming the decision models for the organization of industrial and business activity. These models, along with the direct use of agricultural technologies of cultivation of products [4], allow making reasonable decisions on the optimum utilization of the ground areas, the development of the product line and the comprehensive production program, the development of mechanisms for the optimally reconciled interaction between the producers and consumers of products. The article will further dwells upon the models of optimization and improvement of the effectiveness of business activity of agricultural enterprises under the conditions of protected ground and hothouse facilities.

Hence, the area under crop must not be smaller than the required area in order to achieve the planned range of products.
Let's consider the sales of the proposed approach to the utilization of the agriculturally used area through the example of the enterprise of the Samara region Teplichnyi JSC.
Table 1 presents the reference data by the yield values of the cultivated crops depending on the month provided that the areas are resoiled each year according to the sam plan, and the average selling price of products per month.
Table 1
Dependence of the yield in kg/m2 from the month/average price, RUB
Month |
Tomatoe |
Cucumber variety “Atlet” |
Cucumber variety “Kurazh” |
Pepper |
Eggplant |
Lettuce |
1 |
3,11/129,37 |
0,56/20,42 |
||||
2 |
26,62/94,21 |
0,52/19,04 |
||||
3 |
2,74/136 |
31,13/64,46 |
1,96/145,15 |
2,44/150 |
0,63/20,19 |
|
4 |
24,98/88,93 |
32,74/53,58 |
5,87/150 |
15,78/145,53 |
0,50/19,85 |
|
5 |
26,80/70,91 |
29,27/44,78 |
9,78/122,16 |
18,03/118,08 |
0,47/14,50 |
|
6 |
12,57/31,83 |
7,59/27,94 |
4,36/87,76 |
14,2/94,05 |
0,4/10,19 |
|
7 |
6,78/18,66 |
0,16/20,68 |
2,23/ |
6,77/64,45 |
||
8 |
2,73/9,23 |
3,82/16,41 |
1,27/33,7 |
3,46/33,15 |
||
9 |
3,37/16,94 |
5,54/7,62 |
1,21/23,73 |
3,18/28,10 |
0,25/14,97 |
|
10 |
4,12/26,46 |
3,19/11,99 |
0,72/23,86 |
1,46/43,37 |
0,24/14,78 |
|
11 |
0,14/20,87 |
|||||
12 |

The computational solution to this problem allowed us to determine the following values of the optimal areas presented in Table 2.
Table 2
Optimal area values, m2
Month |
Tomatoe |
Cucumber variety “Atlet” |
Cucumber variety “Kurazh” |
Pepper |
Eggplant |
Lettuce |
Total |
1 |
3,000 |
10,700 |
0 |
0 |
0 |
100 |
13,800 |
2 |
3,000 |
10,700 |
0 |
0 |
0 |
100 |
13,800 |
3 |
3,000 |
10,200 |
0 |
250 |
250 |
100 |
13,800 |
4 |
3,000 |
10,200 |
0 |
250 |
250 |
100 |
13,800 |
5 |
3,000 |
10,200 |
0 |
250 |
250 |
100 |
13,800 |
6 |
3,000 |
10,200 |
0 |
250 |
250 |
100 |
13,800 |
7 |
1,000 |
10,200 |
2,000 |
250 |
250 |
100 |
13,800 |
8 |
1,000 |
0 |
2,000 |
250 |
250 |
0 |
3,500 |
9 |
1,000 |
0 |
2,000 |
250 |
250 |
0 |
3,500 |
10 |
1,000 |
0 |
2,000 |
250 |
250 |
100 |
3,600 |
11 |
0 |
0 |
2,000 |
0 |
0 |
100 |
2,100 |
12 |
0 |
0 |
0 |
0 |
0 |
0 |
0 |
In addition, a restriction was introduced consisting in the fact that the area under crop in the following month must not exceed the area in the preceding month, which means that partial crop harvesting is possible, while additional planting is not possible.
We can see from Table 2 that the most profitable crop – cucumber variety “Atlet” – occupies the maximum possible area which remained after planting of the other crops at the minimum required area. Moreover, the area of the hothouses is fully divided between these crops during the first seven months. The change in the areas utilized for the cultivation of tomatoe and cucumber varieties “Atlet” is due to the decrease in the yield of vegerables and seasonal drop in prices. That's why the upkeep and maintenance of the hothouses with the maximum total area becomes unprofitable. Meanwhile, the areas which became free are resoiled and prepared for the new planting of vegetables.
Moreover, the total revenue will amount to 161335335 rubles which is 19.7% higher than the revenue received by the enterprise.
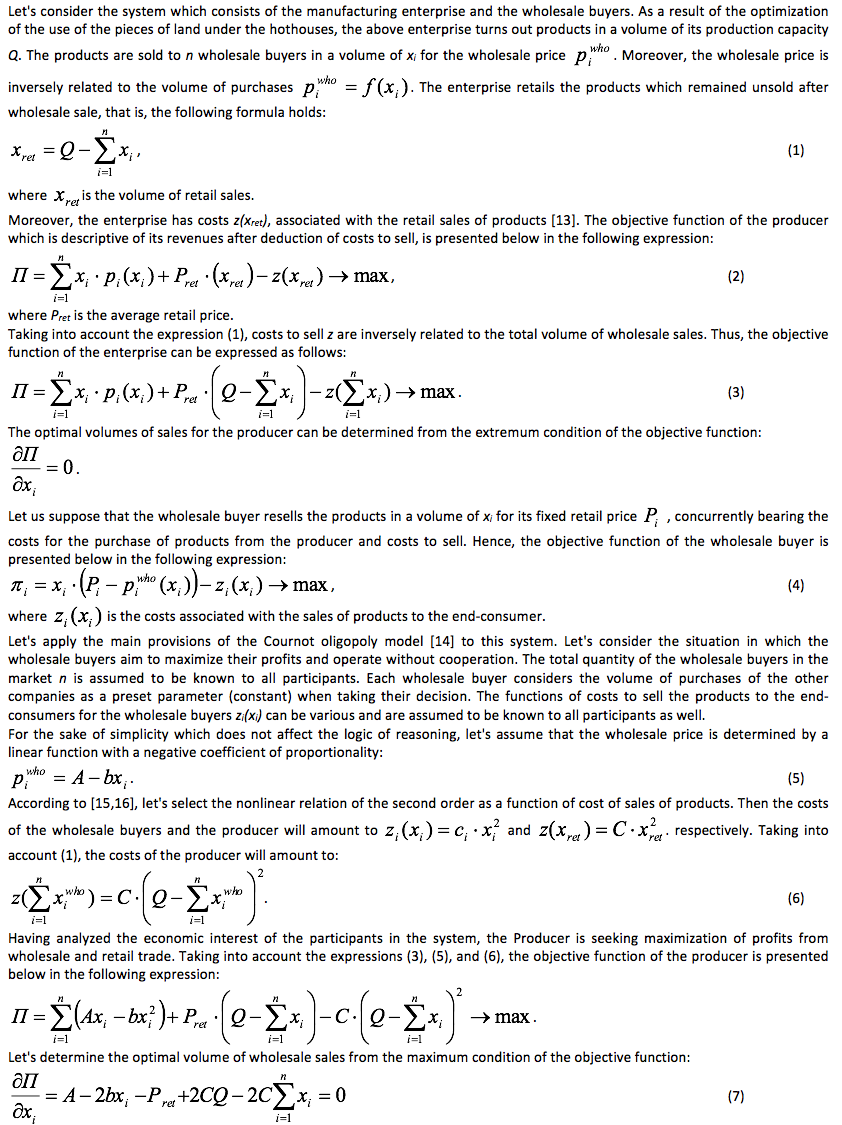
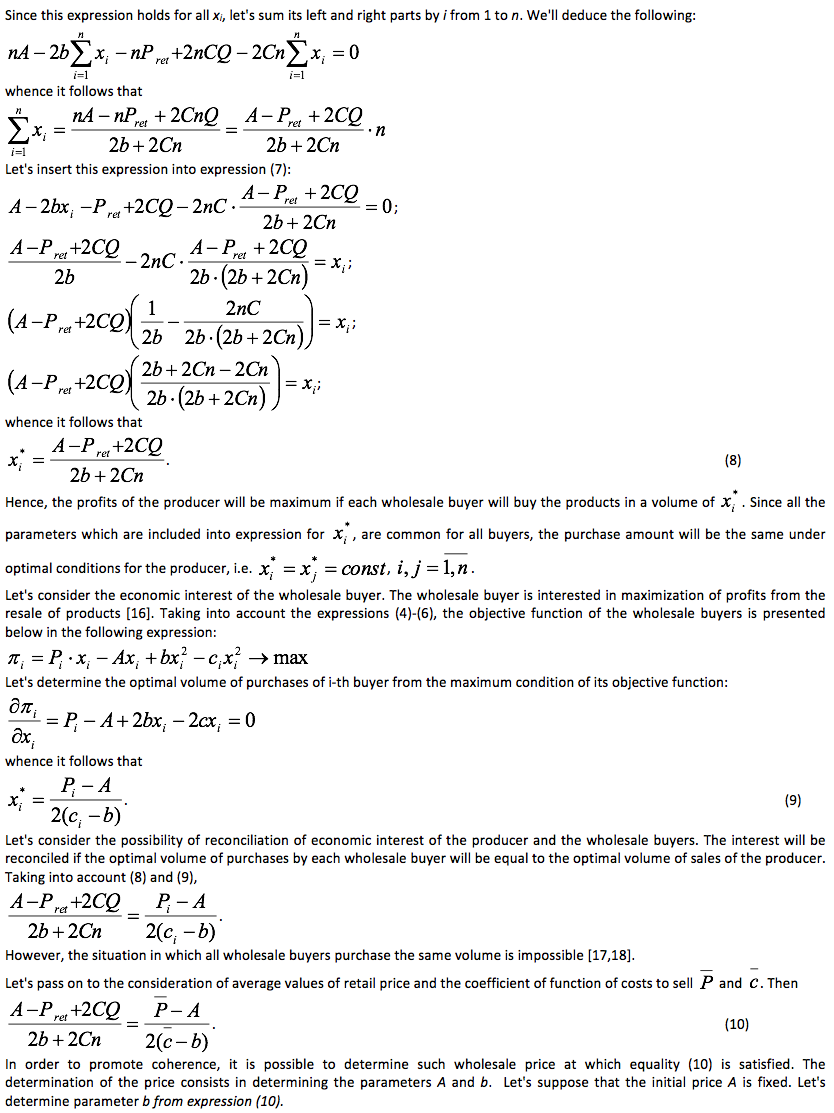
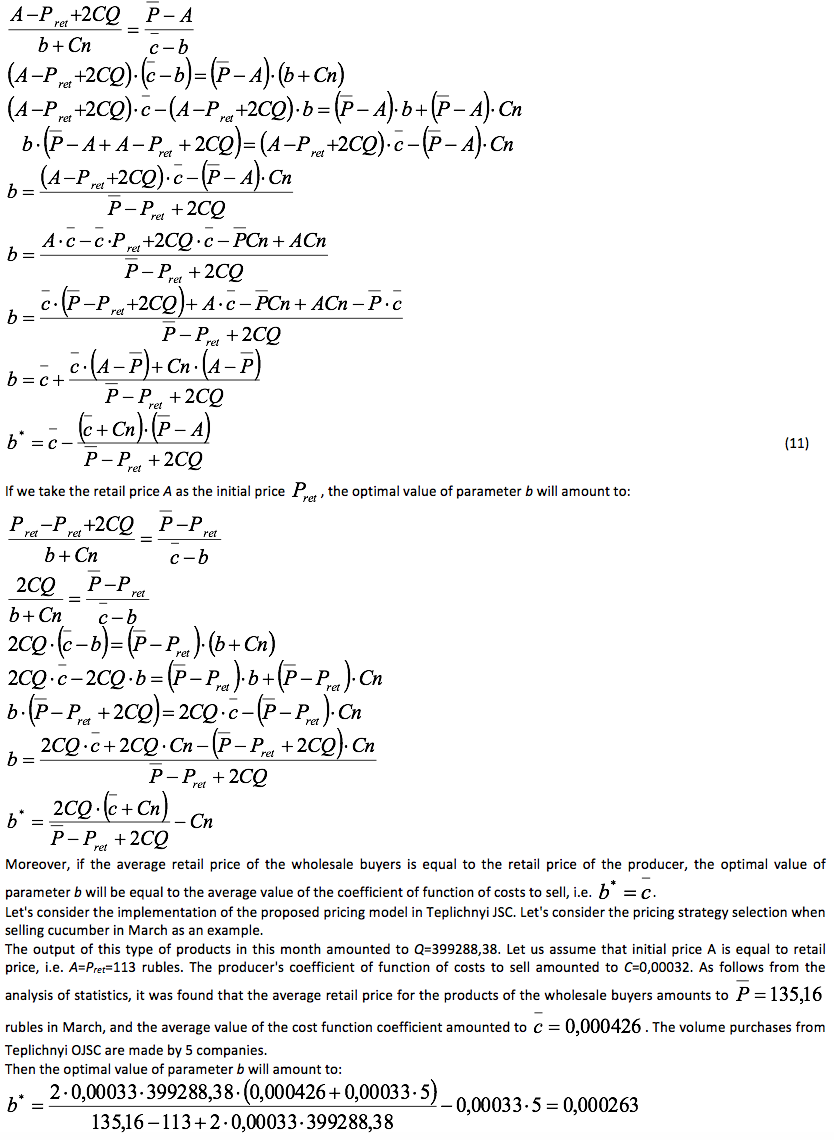
Further, let's consider the optimization model of the product pricing strategy. Table 3 presents the statistical information about the structure, volume and revenues from the volume of sales of cultivated products of Teplichnyi JSC. As can be seen from the presented data, the maximum volume of products is sold through the wholesale buyers and small-scale wholesale buyers. It is mainly caused by the limited storage life of products. Therefore, the most urgent problem is the formation of the release prices for the products for the wholesale buyers.
Table 3
Statistics of sales of products for 2017
Product name |
Unit |
Wholesale trade |
Small-scale wholesale trade |
Itinerant trade |
||||||
Qty |
Revenues thousand rubles |
Average price |
Qty |
Revenues thousand rubles |
Average price |
Qty |
Revenues thousand rubles |
Average price |
||
Cucumber variety “Atlet” (grade 1) |
t |
1,546 |
85,268 |
55.15 |
30 |
2,780 |
93.31 |
19 |
1,999 |
103.17 |
Cucumber variety “Atlet” (grade 2) |
t |
570 |
13,844 |
24.31 |
3 |
298 |
92.10 |
3.1 |
302 |
96.12 |
Cucumber variety “Kurazh” (grade 1) |
t |
773 |
8,243 |
10.67 |
5.5 |
199 |
36.36 |
8.6 |
465 |
53.72 |
Cucumber variety “Kurazh” (grade 2 ) |
t |
88 |
376 |
4.25 |
|
|
|
|
|
|
Tomatoe variety “Makarena” (grade 1) |
t |
576 |
20,149 |
34.96 |
35 |
3,068 |
88.40 |
23.6 |
1,966 |
83.02 |
Tomatoe variety “Makarena” (grade 2) |
t |
36 |
670 |
18.49 |
|
|
|
|
|
|
Lettuce |
thousand packs |
375 |
6,010 |
16 |
15.5 |
519 |
33.36 |
5.9 |
204 |
34.46 |
Eggplant |
kg |
1.4 |
115 |
82.91 |
1.9 |
173 |
92.67 |
1.5 |
106 |
69.93 |
Pepper |
kg |
4.3 |
251 |
58.95 |
2.6 |
282 |
108.22 |
2.6 |
154 |
58.91 |


The values of retail price and cost function coefficient of the wholesale buyers are presented in Table 4.
Table 4
The values of retail price and cost function coefficient
|
ci |
Pi |
1 |
0.00038 |
128 |
2 |
0.00042 |
130 |
3 |
0.00035 |
140 |
4 |
0.00046 |
139 |
5 |
0.00052 |
140 |
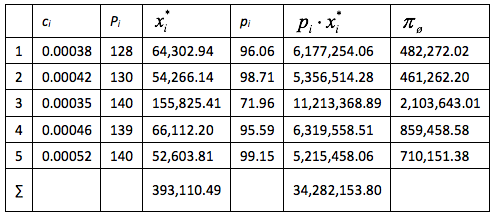
Based on this data, as well as the original price A and parameter b, let's determine the optimal volume of purchases and wholesale price using formula (9), as well as the profits of the buyers and the revenues of the producer from the sales of products to the wholesale buyers. The results are presented in Table 5.
Table 5
Calculation of the optimal volume of purchases, wholesale price
as well as the profits of the buyer and the revenues of the producer


Hence, the authors of the article have proposed the efficient methods for management of operations of agro-industrial enterprises carrying out their activities under the conditions of protected ground. The results obtained allow us to increase the profits significantly due to optimization of the utilized areas with due account for yield and seasonal fluctuations in product prices. Besides, a model for the determination of the optimal product prices has been proposed, which ensures the reconciliation of the economic interest of the producer and the wholesale buyers, allowing us to determine the optimal values of the volumes of purchases and release prices. All the proposed models have been tested and endorsed at the particular enterprise of the Samara region. The calculations have demonstrated the possible increase in profits of the enterprise as a result of the use of these pilot projects by approximately twenty per cent.
http://www.gks.ru/
http://mcx.ru/
http://www.agroinvestor.ru/companies/a-z/assotsiatsiya-teplitsy-rossii/
Dong Q., Yang L., Qu M., Shi Q., Du S. (2016) Beta Function Law to Model the Dynamics of Fruit’s Growth Rate in Tomato: Parameter Estimation and Evaluation. In: Li D., Li Z. (eds) Computer and Computing Technologies in Agriculture IX. CCTA 2015. IFIP Advances in Information and Communication Technology, vol 478. Springer, https://doi.org/10.1007/978-3-319-48357-3_3
Acutis, M., Confalonieri, R.: Optimization algorithm for calibrating cropping systems simulation models. A case study with simplex-derived methods integrated in the warm simulation environment Acutis M.e Confalonieri R. Ital. J. Agrometeorol. 3, 26–34 (2006) http://scholar.google.com
Ting, K.C., Lin, T., Davidson, P.C. Integrated Urban controlled environment agriculture systems (2016) LED Lighting for Urban Agriculture, pp. 19-36. https://doi.org/10.1007/978-981-10-1848-0_2
Shamshiri R R, Kalantari F, Ting K C, Thorp K R, Hameed I A, Weltzien C, et al. Advances in greenhouse automation and controlled environment agriculture: A transition to plant factories and urban agriculture. Int J Agric & Biol Eng, 2018; 11(1): 1–22. https://doi.org/10.25165/j.ijabe.20181101.3210
Jones, J.W., Dayan, E., Allen, L.H., et al.: A dynamic tomato growth and yield model (TOMGRO). Trans. ASAE 34, 663–672 (1991) https://doi.org/10.13031/2013.31715
K.S. Moorthy. Product and price competition in a duopoly. Mark Sci, 7 (2) (1988), pp. 141-168. https://doi.org/10.1287/mksc.7.2.141
Wallach, D., Makowski, D., Jones, J.W.: Working with Dynamic Crop Models: Evaluations, Analysis, Parameterization, and Applications. Elsevier, Amsterdam (2006) http://scholar.google.com
He, C., Zhang, Z.: Modeling the relationship between tomato fruit growth and the effective accumulated temperature in solar greenhouse. Acta Hortic. 718, 581–588 (2006) https://doi.org/10.17660/ActaHortic.2006.718.68
Ma, L.L., Ji, J., He, C.: Studies on tomato leaf area index measurement method based on BP neural network. China Veg. 16, 45–50 (2009) http://scholar.google.com
Berry, S. T. (1994). Estimating discrete‐choice models of product differentiation. The RAND Journal of Economics, 25(2), 242–262. http://scholar.google.com
Heuvelink, E.: Evaluation of a dynamic simulation model for tomato crop growth and development. Ann. Bot. 83, 413–422 (1999) https://doi.org/10.1006/anbo.1998.0832
Janssen, P.H.M., Heuberge, P.S.C.: Calibration of process- oriented models. Ecol. Model.83, 55–56 (1995) https://doi.org/10.1016/0304-3800(95)00084-9
Sakamoto R, Stiegert K. Comparing competitive toughness to benchmark outcomes in retail oligopoly pricing. Agribusiness. 2018;34:44–60 https://doi.org/10.1002/agr.21537
ZhengLuo , XuChen , MingKai :The effect of customer value and power structure on retail supply chain product choice and pricing decisions. OmegaVolume 77, June 2018, Pages 115-126. https://doi.org/10.1016/j.omega.2017.06.003
Houska, T., Multsch, S., Kraft, P., Frede, H.-G., and Breuer, L.: Monte Carlo-based calibration and uncertainty analysis of a coupled plant growth and hydrological model, Biogeosciences, 11, 2069-2082, https://doi.org/10.5194/bg-11-2069-2014, 2014.
1. Samara State University, Samara, Russia. e-mail: Belyaeva1301@gmail.com
2. Samara State University, Samara, Russia. e-mail: ssau_ivanov@mail.ru
3. Tolyatti State University, Tolyatti, Russia. e-mail: aakurilova@yandex.ru