

Vol. 38 (Nº 53) Year 2017. Page 19
Myller Augusto Santos GOMES 1; Gabriela Diedrichs BARBOSA 2; Maria Helena da FONSECA 3
Received: 01/07/2017 • Approved: 28/07/2017
2. Horizontal networks of companies
3. The culture of trust in a horizontal clustering of companies
ABSTRACT: Increasingly inserted in a competitive context, the micro small and medium enterprises articulate initiatives to survive in environments dominated by principles of rivalry and competition. This study is part of a peculiar form of interorganizational networks form: horizontal networks of informal enterprises, with the determining variable culture of trust between partners. a horizontal network classified as informal and inserted in the sound segment and lighting events, which were applied to measurement tool of trust based on perceptions and expectations for achieving the study was selected. The results show similarities regarding the practices carried out by companies, interpreted as conformity of the partner companies, where possible disappointments or surprises are not expected, thus the vulnerability of relations built with confidence are evident, thus expressing the possible reduction of practices cooperation and competition. |
RESUMO: Cada vez mais inserido em um contexto competitivo, a micro, pequenas e médias empresas articulam iniciativas para sobreviver em ambientes dominados por preceitos de rivalidade e concorrência. O presente estudo está inserido de uma forma peculiar no formato de redes interorganizacionais: redes horizontais de empresas informais, tendo como variável determinante a cultura da confiança entre os parceiros. Para consecução do estudo, foi selecionado uma rede horizontal classificada como informal e inserida no segmento de prestação de serviços de sonorização e iluminação de eventos, onde foram aplicados a ferramenta de mensuração da confiança baseada em percepções e expectativas. Os resultados apresentados demonstram semelhanças em relação as práticas realizadas pelas empresas, interpretado como conformismo das empresas parceiras, onde possíveis decepções ou surpresas não são esperados, desta forma, a vulnerabilidade das relações construídas com a confiança são evidentes, expressando assim a possível diminuição das práticas de cooperação e competição. |
The present study describes the topic of horizontal business networks, with the objective of measuring the level of trust between the partner companies, expressed as a contemporary configuration of interorganizational arrangements, capable of sharing information, knowledge, skills and competences.
Inserted in a competitive environment, the bonds of trust can in fact structure an increasing in cooperation between the partnerships as to increase their competitiveness in their segment of action.
The term horizontal network of companies has been studied by several authors (Hermes, Resende & Andrade Junior, 2013, Bonatto, Resende, Betim, Pereira & Von Agner, 2015; With the focus on the measurement of trust, through the model tool of confidence measurement based on perceptions and expectations (MAPE) developed by Campos (2016), a horizontal network of companies in the segment of sound and lighting services of events was selected, located in the municipality of Ponta Grossa-PR.
Initially, the article is structured around the reflection on horizontal networks of companies focused on the construction of the trust culture, where it tries to understand how this variable can influence the productivity, cooperation as well as competitiveness of the partner companies.
To develop relations between peers with similar activities and similar strategic objectives, has become a common practice for organizations in the process of economic growth. In this context, aspects related to trust between organizations are relevant in achieving the objectives of the groups.
In the definition of Provan and Kenis (2008) horizontal networks consists of a group of three or more organizations with legally separate institutional parameters, but they act together in order to achieve individual and network strategic objectives in their segment.
In this scenario, governance plays a relevant role in the dynamics of the network. Hermes, Resende and Andrade Júnior (2013), report that for the organizations involved, the identification of governance is fundamental to carry out the articulation processes of the network. For these authors, a horizontal network will only reach the proposed objectives when there is maturity within the network. In this sense, governance must meet demands through mediation tools within the scope of the potential characteristics and which fosters the competitiveness of the segment.
For Campos (2016), horizontal business networks are an alternative for small and medium-sized enterprises, with representation in specific segments. The alignment of the strategic objectives of the companies involved in the network, generates possibilities of discoveries of wide and emergent markets, but are limited in scope of knowledge for the construction of strategies that aim at the competition.
Understanding the strategic perspective, the formation of horizontal networks of companies occurs with partner companies in specific segments, where their performance cannot be measured independently of the interests of the constituent partner companies, thus, the economic income of individual companies is the basis for any cooperative strategy (Das & Teng, 2003).
In the research carried out by Bonatto et al.,(2015) in partner companies that are distinct from each other and which have similarities concerning the operating structure and behavior of the actors involved, there is a strong predominance in variables that express similarities , such as: geographic location, clustered concentration, proximity, specialization in a product and industrial typology. Thus, in this context, these variables are conditioned as a competitive advantage.
Conceived as a dimension of social relations, trust in the organizational perspective represents three conceptions discussed by Lane and Bachmann (1998) which are the uncertainties and vulnerabilities concerning the behavior of the other part in a transaction, the interdependence of the factors and expectations of the other part that the confident part will not get advantage of its frailties in the process. (Lane & Bachmann, 1998; Rus & Iglic, 2005; Lee et al., 2012).
In the discussion proposed by Olave and Amato Neto (2001) on the essential requirements for the birth and development of business networks, the aspects related to the culture of trust are: cooperation, cultural aspects and individual and collective interests. In such perspective, ethics assumes a fundamental role, as well as the informational aspects about the individual companies and the group that have common interests; that represents the first step towards the birth and development of business networks.
The performance of the horizontal network is extremely connected with the trust dimension, because the cooperation factor is essential for its achievement, thus the success of the network is allowed. In this organizational environment, there are characteristics that form a scenario of confidence creation, sharing of market information, technology and profitability, product and process information. Then, it is possible to measure behavior, long-term relationships, non-significant differences in power, size, strategic situation, long-term governance role, financial profits to employees and inserted firms, economic advantage gained by increasing sales and the marginal gains from the group experience (Balestrin & Vargas, 2004, Das & Teng, 2003, Campos, 2016).
Building trust bonds in horizontal business networks is not a simple process, its results come from a complex interaction involving attributes of relationships between companies, positive or negative aspects based on experience and generalized expectations that are easily extended to all the network members (Das & Teng, 2003, Lee et al., 2012, Provan & Kenis, 2008).
If trust is violated at the beginning of the network formulation process, it can lead to negative attitudes toward the network relationship as a whole, which can develop barriers in developing relationships of trust with other participants even with new entrants (Lee et al. Al., 2012).
For Provan and Kenis (2008) network dynamics is motivated by trust, represented as a significant factor, however, it is important to have an understanding of the conditions that gave rise to trust in the process of developing horizontal networks, because, for the participants, it becomes clear to view all the motivating factors that leads to an uncertainty about who should be trusted and who should not.
Aspects of integration related to its effective quality among partners in the horizontal network, is a more expressive determinant than the trust itself. The regularity of the interactions is not directly related to trust and the interaction does not, itself alone, necessarily weighs in the process of building trust culture (Provan & Kenis, 2008; Lee et al., 2012).
In the same perspective, maintaining regular integration provides more opportunity to build the culture of trust between partners, while at the same time provides opportunities for trust to be undermined by individual and collective decisions (Provan & Kenis 2008, Lee et al. 2012).
The classification of the research regarding its object, is identified as a field research, where the data was collected in all companies inserted in the characterization of the network of companies. Concerning its nature, it is characterized as applied, because it involves reports of interests of a specific group.
Concerning the objectives, this research is classified as exploratory, for it provides greater understanding of the problem regarding the process of formulating hypotheses; in relation to the approach to the problem, it is characterized as qualitative-quantitative.
The model used for the measurement of trust was developed by Campos (2016), which seeks to measure the level of trust in horizontal networks of companies, called the Trust Valuation Model, based on Perceptions and Expectations (MAPE). In this context, perceptions and expectations represent the activities within the following variables: barriers, externalities and factors, and these are identifiers of the existence of trust.
The tool is made up of three questionnaires, the first one was applied only to network governance, while the other two questionnaires, one of perceptions and the other of expectations, were applied in each of the companies that make up the network.
The governance questionnaire is composed of seventeen variables that were compared and divided in a hierarchical way into three groups: Barriers, Externalities and Factors. Peer comparison was performed and weights were then assigned for each decision of the decision maker, ranging from 1 to 9, as can be seen in Table 1.
Table 1: Saaty’s fundamental scale
Definition |
Numerical scale |
Qualitative scale |
There is no difference in the contribution among the compared elements, to the element of the immediately superior level. |
1 |
Equal elements |
The contribution of one of the elements is slightly superior to the other. |
3 or 1/3 |
Weak importance from one on the other |
One element is strongly dominated by the other. |
5 o 1/5 |
Strong importance from one element on the other |
The preference of one element over the other is notorious. |
7 or 1/7 |
Very strong importance from one element on the other |
The contribution of one element prevails in absolute |
9 or 1/9 |
Absolute importance from one element on the other |
They serve to obtain a more precise judgment |
2 (1/2); 4 (1/4); 6 (1/6); 8 (1/8). |
Intermediate values. |
Source: “The Analytic Hierarchy Process”, T. L. Saaty, 1980.
The questionnaires of perceptions and expectations are composed of 42 affirmations each, and the response options vary on a scale of 0 to 4, and the lower the value, the lower is the level of confidence that is perceived or expected by the company within the network, and the higher the value, the greater the level of trust that is perceived or expected by the company in the network.
For the author, the tool itself evaluates three dimensions for confidence analysis: barriers, externalities, and confidence building factors. Using a multicriteria decision support analysis methodology, the Analytic Hierarchy Process (AHP), where it was possible to hierarchize through its level of importance. In order to guarantee the reliability of the data collection instrument, Campos (2016) performed the Cronbach Alpha test, in a process of correlation between the variances, where it was possible to eliminate redundant questions.
With the application of the questionnaires, the elimination of the questions and the weighting of the variables, the confidence coefficients of the perceptions and expectations of each company are obtained for each of the three dimensions analyzed. These coefficients are presented by Campos (2016) in the form of radar charts, where it was possible to compare the results of each company for each of the three dimensions.
The network of companies studied is informal, non-orbital and with horizontal directionality, consisting of six companies, located in the city of Ponta Grossa-PR, Brazil, acting in the segment of events sound and lighting services.
Table 1 presents characteristics of each one of the companies of the network, which were named by letters of the Roman alphabet in order to maintain the secrecy of the same ones.
Table 1. Profile of the network
Company |
Size |
Existence |
Years in the network |
Owner (s) |
Registered workers |
Hired freelancers |
A |
MEI* |
38 years |
11 years |
1 |
0 |
3 |
B |
ME* |
8 years |
7 years |
2 |
3 |
3 |
C |
ME |
30 years |
9 years |
1 |
1 |
2 |
D |
MEI |
6 years |
5 years |
1 |
0 |
1 |
E |
ME |
8 years |
6 years |
2 |
4 |
2 |
F |
ME |
12 years |
10 years |
2 |
3 |
4 |
MEI: Individual Micro enterprise.
ME: Micro enterprise.
The cooperation between them is observed in the form of loans and equipment rental, joint purchase of equipment, assignment of labor, exchange of knowledge, transfer of services, as well as partnerships in events.
The final results of perceptions and expectations of trust in the network are presented below, for each individual company and for the network as a whole.
Chart 1: Perceptions and Expectations for each dimension (Company A).

As can be seen in Chart 1, Company A shows its expectations higher than its perceptions regarding the Barriers dimension; for the dimension Externalities, perceptions are greater than expectations; for the dimension Factors, the perceptions and expectations are practically the same.
Chart 2: General Perceptions and Expectations (Company A).

Chart 2 shows that, in general, Company A perceives exactly what it expects in relation to trust in the network. Their perceptions and expectations have a medium confidence coefficient (2,8), indicating a certain conformism concerning the practice of trust in the network.
Chart 3: Perceptions and Expectations for each dimension (Company B).

As can be seen in Chart 3, Company B presents its expectations higher than its perceptions regarding the Barriers dimension; for the Dimensions Externalities and Factors, perceptions are higher than expectations.
Chart 4: General Perceptions and Expectations (Company B).

Figure 4 shows that, in general, Company B perceives more trust in the network than it expects. Their perceptions have a high confidence coefficient (3.2) and their expectations have an average confidence coefficient (2,8). This company was positively surprised by what it experiences in practice when it comes to trust in the network.
Chart 5: Perceptions and Expectations for each dimension (Company C).

As can be seen in Chart 5, Company C presents its expectations much higher than its perceptions regarding the Barriers and Externalities dimensions, and only for the Factors dimension, perceptions are higher than their expectations.
Chart 6: General Perceptions and Expectations (Company C).

Chart 6 shows that, in general, Company C expects more trust in the network than it perceives. Both their expectations and their perceptions have an average confidence coefficient (2.6 and 2.1, respectively). This company was disappointed with what it experiences in practice with regard to trust in the network.
Chart 7: Perceptions and Expectations for each dimension (Company D).
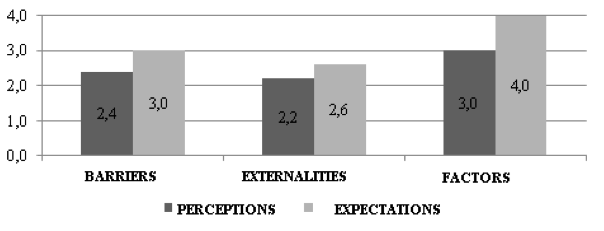
As can be seen in Chart 7, Company D has higher expectations than its perceptions for the three dimensions studied (Barriers, Externalities and Factors).
Chart 8: General Perceptions and Expectations (Company D).
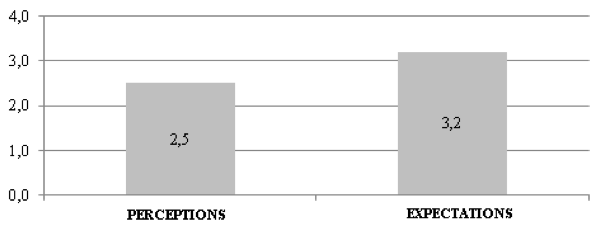
Chart 8 shows that, in general, Company D expects more trust in the network than it perceives. Their expectations have a high confidence coefficient (3.2) and their perceptions have an average confidence coefficient (2,5). This company was disappointed with what it experiences in practice concerning the trust in the network.
Chart 9: Perceptions and Expectations for each dimension (Company E).
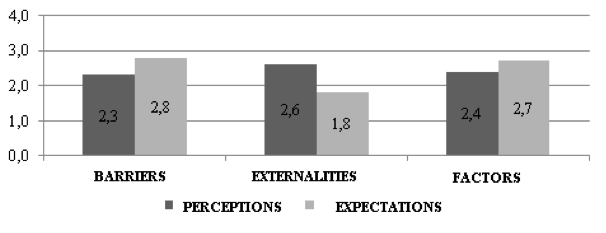
As can be seen in Chart 9, Company E presents its expectations higher than its perceptions regarding the Barriers and Factors dimensions and, for the Externalities dimension, the perceptions are much higher than the expectations.
Chart 10: General Perceptions and Expectations (Company E).

Chart 10 shows that, in general, Company E perceives exactly what it expects in relation to trust in the network. Their perceptions and expectations have a medium confidence coefficient (2,4), indicating a certain conformism of the company concerning the practice of trust in the network.
Chart 11: Perceptions and Expectations for each dimension (Company F).
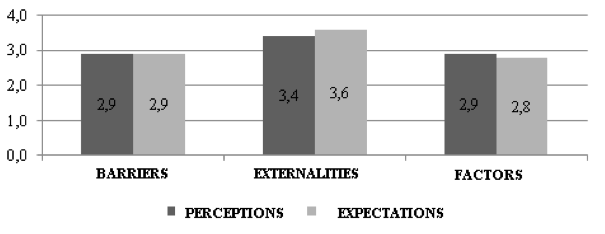
As can be seen in Chart 11, Company F presents the same or very similar perceptions and expectations for the three dimensions studied (Barriers, Externalities and Factors).
Chart 12: General Perceptions and Expectations (Company F).

Chart 12 shows that, in general, Company F perceives practically the same score in both dimensions, concerning the trust in the network. Their perceptions and expectations have a high confidence coefficient (3.0 and 3.1, respectively), indicating that the company is satisfied with what it experiences in practice, concerning the trust in the network.
Chart 13: Perceptions and Expectations for each dimension within the Network.

As can be seen in Chart 13, the network presents its expectations higher than its perceptions only in the Barriers dimension, with a confidence coefficient of 3.1 and 2.5, respectively. For the Externalities and Factors dimensions, the perceptions and expectations are exactly the same, with a confidence coefficient of 2.6 and 2.8, respectively.
Chart 14 – Perceptions and Expectations for each Company.

Chart 14 shows that 50% of the companies (A, E and F) present equal perceptions and expectations; two companies (C and D) have higher expectations than their perceptions and only one firm (B) has higher perceptions than Expectations concerning the trust in the network.
Chart 15: Perceptions and Expectations for the Network.
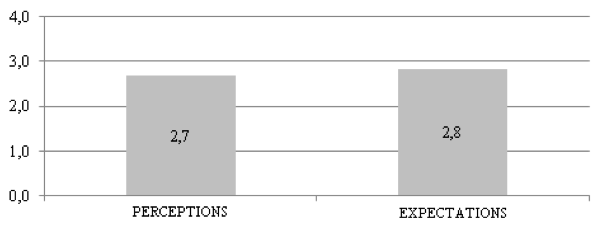
As Chart 15 shows, in general, the network shows practically what it expects in relation to trust between companies. Their perceptions and expectations have a medium confidence coefficient (2.7 and 2.8, respectively), indicating, in general, a certain conformism in the network, where companies do not expect much and, consequently, do not perceive much in the practice of trust in the network.
In general, the companies that constitute the studied network have their perceptions and expectations practically equal, concerning the trust among them. This result indicates a certain conformism from the companies of the network, where they do not expect much and, consequently, do not show much in the practice of trust in the network. Additionally, companies are not disappointed, and are not surprised by what they experience on a daily basis, but they do not increase their confidence levels and, therefore, their cooperation practices.
In the perspective of network performance in response to its market segment, when relationships are based on trust, be it interpersonal or institutional, dependence on the effectiveness of business activities is significant.
When trust is established by the development of governance, it may lead to positive effects on the performance of the network, due to the fact that trust establishes incentives for both the partners and those who are not within the network.
With theoretical implications, the application of the confidence measurement model based on perceptions and expectations (MAPE) allowed the measurement of the level of trust in a horizontal network of companies, expressing the effectiveness of the same, and that the relationship between trust and performance is relevant to the segment and business activities analyzed.
In practical terms, in an emerging economy such as Brazil, it is essential for horizontal business networks to be transformed in the fields of efficiency and reliability of the partners and services provided in business activities, in profitable relationships based on the ties of trust that can promote a virtuous cycle of maintaining one's trust and optimizing horizontal network performance in its segment.
Balestrin, A. & Vargas, L. M. (2004). A dimensão estratégica das redes horizontais de PMEs: teorizações e evidências. Revista de Administração Contemporânea, 8(spe), 203-227. Retrieved from http://www.scielo.br/scielo.php?pid=S1415-65552004000500011&script=sci_abstract&tlng=pt. doi: 10.1590/S1415-65552004000500011.
Bonatto, F., Resende, L. M. M. De, Betim, L. M., Pereira, R. Da S. & Agner, T. von (2015). Performance Management in Horizontal Business Networks: a systematic review. IFAC-PapersOnLine, 48(3), 1827-1833. Retrieved from http://www.sciencedirect.com/science/article/pii/S2405896315005911. doi: 10.1016/j.ifacol.2015.06.352.
Campos, E. A. R. de. (2016). Proposta de um modelo para mensuração de confiança em redes horizontais de empresas (master degree thesis). Industrial Engineering Post-graduation Program, Universidade Tecnológica Federal do Paraná, Ponta Grossa, PR.
Das, T. K. & Teng, B.-S. (2003). Partner analysis and alliance performance. Scandinavian Journal of Management, 19(3), 279-308. Retrieved from http://www.sciencedirect.com/science/article/pii/S0956522103000034. doi: 10.1016/S0956-5221(03)00003-4.
Hermes, R. R., Resende, L. M. & Andrade, P. P., Jr. (2013). Análise coopetitiva – um modelo para redes horizontais de empresas. Revista Brasileira de Gestão e Desenvolvimento Regional, 9(2), 65-95. Retrieved from http://www.rbgdr.net/revista/index.php/rbgdr/article/view/1021
Lane, C. & Bachmann, R. (Eds.). (1998). Trust within and between organizations: conceptual issues and empirical applications. Publisher: Oxford University Press.
Lee, H.-W., Robertson, P. J., Lewis, L., Sloane, D., Galloway-Gilliam, L. & Nomachi, J. (2012). Trust in a cross-sectoral interorganizational network: An empirical investigation of antecedents. Nonprofit and Voluntary Sector Quarterly, 41(4), 609-631. Retrieved from http://journals.sagepub.com/doi/pdf/10.1177/0899764011414435. doi: 10.1177/0899764011414435.
Olave, M. E. L. & Amato, J., Neto (2001). Redes de cooperação produtiva: uma estratégia de competitividade e sobrevivência para pequenas e médias empresas. Gestão & Produção, 8(3), 289-303. Retrieved from http://www.scielo.br/pdf/gp/v8n3/v8n3a06
Provan, K. G. & Kenis, P. (2008). Modes of network governance: structure, management, and effectiveness. Journal of public administration research and theory, 18(2), 229-252. Retrieved from https://papers.ssrn.com/sol3/papers.cfm?abstract_id=1157682. doi: 10.1093/jopart/mum015
Rus, A. & Iglič, H. (2005). Trust, Governance and Performance the Role of Institutional and Interpersonal Trust in SME Development. International Sociology, 20(3), 371-391. Retrieved from http://journals.sagepub.com/doi/pdf/10.1177/0268580905055481. doi: 10.1177/0268580905055481
Saaty, T. L. (1980). The Analytic Hierarchy Process. New York: McGraw-Hill.
1. Mestre em Gestão de Políticas Públicas, professor na UNICENTRO-PR – Email: myller_3@hotmail.com
2. Mestranda em engenharia de produção, Ponta Grossa-PR. Email: gabrieladiedrichsbarbosa@gmail.com
3. Mestranda em engenharia de produção, Ponta Grossa-PR. Email: mhelena_06@hotmail.com