![]() ISSN 0798 1015
ISSN 0798 1015

![]() ISSN 0798 1015
ISSN 0798 1015
Vol. 39 (# 09) Year 2018. Page 29
Irina A. ZARAYCHENKO 1; Aleksey I. SHINKEVICH 2; Vilora V. AVILOVA 3; Ekaterina L. VODOLAZHSKAYA 4; Sofia Sh. OSTANINA 5; Rezeda R. GAINULLINA 6
Received: 08/01/2018 • Approved: 15/01/2018
ABSTRACT: The paper presents a model for innovative networks formation, based on a consistent transformation of outsourcing into a strategic alliance, and then into an innovation network based on the strategy of innovation insourcing. Criteria for determining the innovation strategy are proposed to consider the level of organization competence and the risk of innovative rent’s loss. The paper examines the methodology for grouping regions according to the level of innovation networks development. As a grouping, it is proposed to use the criteria for innovation-active enterprises share and the returns magnitude to innovation. Based on the regions typology, a set of strategies aimed at developing individual features of network interaction in the regions is proposed. |
RESUMEN: El artículo presenta un modelo para la formación de las redes innovadoras, basado en la transformación progresiva de la externalización en una alianza estratégica y luego en una red de la innovación basada en la internalización de la innovación. Se propone que los criterios para determinar la estrategia de la innovación se empleen a la hora de considerar el nivel de la competencia de la empresa y el riesgo de pérdida del valor de la innovación. El artículo examina la metodología para agrupar las regiones de acuerdo con el nivel del desarrollo de las redes de la innovación. Como agrupación, se proponer utilizar los criterios del ratio entre las empresas de la innovación activa y la magnitud de los retornos de la innovación. Basando en la tipología de las regiones, los autores proponen un conjunto de estrategias destinadas a desarrollar características individuales de la interacción de redes en las regiones. |

The competences deepening, the information and communication technologies development, the external environment growing demands have led to the active development of a network approach in innovations management. Advantages of interaction network forms are conditioned, on the one hand, by their adaptive abilities connected with variation connections, and on the other hand by the high level of competitiveness generated with the need to maintain their own competencies within the network. Along with this, the emergence and operation of innovative networks requires a proper institutional environment that ensures transparency and flexibility of interactions. The tasks of building effective innovative networks are determined by the need to ensure sustainable innovation development and ensure economic systems global competitiveness.
A perspective network approach, applied to the innovation economy, used by G.M. Gradoselskaya (2004), M. Castells (2010), R. Patiurel (1997), M.L. Katz & K. Shapiro (2003), O.A. Tretyak (2003), R.M. Nizhegorodtsev (2010) and other scientists, is not fully exhausted by existing works. Along with the theoretical research significant amount on the innovation networks structure and properties, there is no methodological basis for determining the factors of their formation and performance criteria. However, the knowledge economy new challenges, the information and communication technologies development make it possible to conclude that this approach is promising for innovative processes research, etc.
Along with the tasks of understanding the role of network processes in economic systems, it is important to understand the features and differences of innovation networks at the meso-level, since their analysis allows us to formulate specific strategies based on the use of strengths and minimizing the negative factors of meso-systems.
The study was carried out using general scientific methods of cognition. The main theoretical conclusions on the economic nature of strategies for innovative networks formation are determined by the analysis and synthesis method of scientific research f domestic and foreign scientists. The investigation of the factual base was carried out using regression and cluster analysis methods.
The information base of the research is the scientific works of Russian and foreign scientists on the subject of innovation management, the theory of open innovation, theory of systems, management theory. As a factual basis, the data of the Federal State Statistics Service of the Russian Federation were used.
A promising paradigm for innovative systems development is the concept of "open innovation" (Chesbrough, 2006), which in the context of innovative networks functioning involves the transfer of the innovation process elements to network participants, while the functions distribution is determined by the nature of participants’ competences and the structure of innovation rent. Within the framework of this research, a hypothesis is put forward on the importance of the innovation rent distribution between participants in the innovation process and the participants’ competence in the innovation network when deciding on the innovation process outsourcing and an innovation network formation based on the progressive transformation of outsourcing relationships into network structures.
Within the framework of the neoclassical theory, rent is the income obtained from the use of limited resources, both non-reproducible and reproducible (Blaug, 1994). Traditionally natural and non-natural rents are distinguished [9]; innovative rent is a form of non-natural rent generated by a specific innovative product. Innovative rent is an additional income from innovative entrepreneurship, resulting from a temporary increase in production efficiency (due to higher prices for new products and / or lower costs). In this case, it is necessary to allocate intellectual rent, which is directly caused by intellectual capital, that is, generated by scientific development or discovery, and to allocate innovative rent, the emergence of which is due to the effectiveness of network interactions that have ensured the commercialization of innovation.
The distribution of innovative and intellectual rent is a key factor of innovative development, being an incentive to network interactions and the innovative networks construction. Intellectual rent, as a rule, is inherent to performers and is their specific competence, therefore, within the network the key role is played by the innovation rent distribution, the emergence of which is determined by the very nature of innovative network interaction.
Thus, the innovation rent's nature is related to the profit of innovation process participants directly from the sale of a unique innovative product, and the intellectual rent's nature is related to the implementation of the patent and license rights to other network participants, in addition, innovative rent is supplemented by positive external network effects due to the spread of innovation to all economy sectors.
Due to the innovation activities' limited resources of the innovation process's individual executors, the need arises to pool the resources of each participant to achieve an economic effect. This leads to the fact that the innovations share that resulted from the various players’ competences combining both within the value chain and outside it (Kudryavtseva & Shinkevich, 2015) is growing. The key factors in making decisions about innovations outsourcing / insourcing in the innovation network are the current amount of available resources (the organization competence to implement individual stages or the entire innovation process in a complex) and the risks nature associated with the innovation process elements transfer to third parties. The founder of the knowledge management concept, D. J. Tees, believes that "the company is the depository of knowledge embedded in business processes, including technological skills and knowledge of the customers’ needs and the suppliers’ ability. These technological and managerial competencies reflect individual skills and experience, as well as distinctive ways of doing business within the firm "(Shinkevich & Galimulina, 2016). Hence, innovations outsourcing in the network is the process of deducing the element of the innovation process beyond the innovation network node, and insourcing is the process of incorporating the implementing node of the innovation process element into the structure of the network focus node.
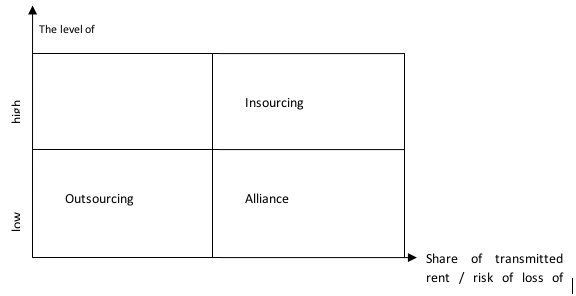
Thus, the decision on innovation outsourcing is determined by an assessment of the relationship between the nature of the firm current competence and the features of innovation rent distribution in the network (Fig. 1).
The outsourcing strategy choice is advisable with firm's low own competence within the framework of the innovation process's this element and low risks of innovative rent's loss. The strategy of insourcing, on the contrary, is expedient with high own competence and high risks of loss / transfer of innovation rent share. In disputable cases (high own competence and low share of innovation rent, low own competence and high risks of innovative rent loss), it is expedient to cooperate on the basis of alliances, that is, joint innovative activity involving the resources merging and the results’ proportional distribution.
In addition, the degree of relationships formalization plays an important role in decision-making: the higher the degree of relations formalization with network participants, the higher the outsourcing appropriateness, other things being equal, as the relationships formalization allows reducing transaction costs in the network and innovation rent share loss risks.
Figure 1
The matrix of network interaction types within the innovation process (Zaraychenko & Shinkevich, 2017)
The specificity of Russian reality lies in the fact that the high innovative potential of the innovation system individual elements is associated with the lack of incentives to unite efforts within the innovation process with a view to obtaining a synergistic effect. This situation is caused by the insufficient development of any forms of interaction, which is due to the ineffective institutional environment and the high degree of closure of innovation-active organizations. At the same time, even in the technological exchange presence, domestic enterprises acquire more than transmit, which determines the overtaking type of the Russian economy’s innovative development. Fig. 2 shows the nature of technological exchange over the past 10 years.
Figure 2
Structure of organizations participating in technological exchange (Indicators of innovation development, 2017)
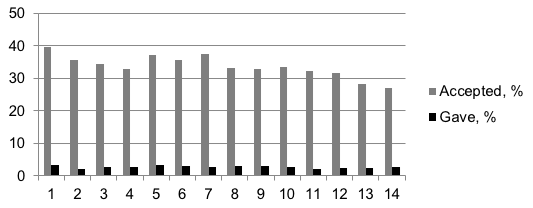
That is, organizations actually participate in innovation exchange, but they act as users, actively borrowing technologies and equipment outside the innovation system.
At the same time, fig. 3 shows that there has been an increase in the number of research and development units that characterizes the high level of innovation activity insourcing, while there is no significant correlation between the number of R & D divisions and the innovation's costs efficiency, which indicates the ambiguous effectiveness of the long-term insourcing strategy.
Figure 3
Dynamics of the number of R & D divisions and the innovation cost (Developed by the
author on the basis of data from the State University "Higher School of Economics")
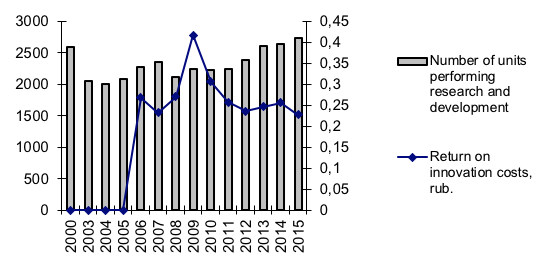
Thus, the traditional form of innovation activity in the Russian economy is innovation insourcing, that is, the implementation of a full innovation cycle within its own structural divisions. Such an innovative strategy is typical for enterprises with high innovative competence and high risks of rent distribution, which is true, since at present a significant part of innovations is implemented by large business entities with their own R & D capacities (the average number of R & D personnel in the last 10 years was 36- 40 people, such a value of the number of functional units is typical for large enterprises) and significant resources for the innovation spread. In addition, the influence of "anti-institutions" forms a negative institutional environment conducive to the emergence of high risks of innovation rent unfair distribution.
The results of the correlation analysis also showed a negative correlation between the innovation activity efficiency and the network interactions intensity (Table 1). Indicators of participation in technological exchange and in joint projects were selected as indicators of network interaction intensity.
Table 1
The correlation analysis results of innovation performance in the Russian Federation
|
X1 |
X2 |
X3 |
X4 |
X5 |
X6 |
X1 |
1,000 |
0,097 |
-0,013 |
0,113 |
-0,614 |
0,427 |
X2 |
0,097 |
1,000 |
0,901 |
-0,890 |
-0,682 |
-0,735 |
X3 |
-0,013 |
0,901 |
1,000 |
-0,811 |
-0,686 |
-0,785 |
X4 |
0,113 |
-0,890 |
-0,811 |
1,000 |
0,411 |
0,309 |
X5 |
-0,614 |
-0,682 |
-0,686 |
0,411 |
1,000 |
0,445 |
X6 |
0,427 |
-0,735 |
-0,785 |
0,309 |
0,445 |
1,000 |
Note: X1 is the aggregate level of innovation activity (the share of organizations that implemented innovations in the total number of enterprises), X2 - innovation costs, million rubles, X3 - return on innovation costs, rub., X4 - the proportion of organizations participating in technological exchange (purchased), X5 - the proportion of organizations participating in technological exchange (transferred), X6 - the proportion of organizations involved in joint innovation projects.
Correlation coefficients demonstrate a negative correlation of transmission organizations share and the level of innovation activity, as well as of network interaction indicators and innovative costs return. The innovative activity's level determines the magnitude of innovative rent's loss risks, as with the innovation activity increase, competition for innovative projects grows, the investments volume in innovation increases, and so the risks of innovation rent losing part are increased. In this connection, the innovative activity growth leads to a deviation from the outsourcing strategy towards alliances (a positive weak link with the share of organizations participating in innovative projects is confirmed by a correlation coefficient of 0.427). The indicator of innovative costs return characterizes the innovation effectiveness, and hence its performers competence, so with increasing efficiency, organizations also seek to implement an insourcing strategy, reducing the network interaction intensity.
The correlation analysis results allowed us to formulate a regression model of the share's dependence of the organizations transferring the development on the indicators of innovative costs return and the innovation activity level:

Where X1 is the aggregate level of innovation activity (the share of organizations that implemented innovations in the total number of enterprises), X3 is the return on innovation costs, rubles, and X5 is the proportion of organizations participating in technological exchange (transferred).
The mathematical model demonstrates the negative dependence of participation level in technological exchange and of competencies’ and efficiency’s chosen parameters, with a greater negative impact of innovation activity level (coefficient minus 1,317), in comparison with the cost-effectiveness index (coefficient minus 0.009), that is, in fact, a decision on technological exchange is largely influenced by the resource parameters of the economic agent, its innovative competencies’ level. The equation constant characterizes the limiting value of enterprises share transferring developments within the framework of technological exchange (17.771%), which can be observed at zero values of innovation activity level and cost return, that is, in fact, this figure quantifies the participants’ critical mass in technological exchange, which will transform the innovation system parameters, moving to a qualitatively new level of innovative development.
The adjusted coefficient of the model determination is 0.917; the value of the Fisher test (21.35) exceeds the calculated value (0.001), which confirms the regression equation adequacy. The model reliability is also confirmed by the graph of calculated and actual values (Fig. 4), as well as by Student's criteria and p-values included in the confidence interval (Table 2).
Figure 4
The ratio of actual data and forecast values based on the proposed model
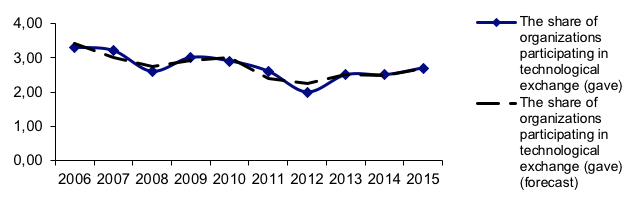
Table 2
Coefficients of the regression model reliability
Model |
Non-standardized coefficients |
Standardized coefficients |
t |
Value |
||
B |
Standard Error |
Beta |
||||
1 |
(Constant) |
17,771 |
3,266 |
- |
5,441 |
0,001 |
Innovation activity cumulative level |
-1,317 |
0,300 |
-0,623 |
-4,393 |
0,003 |
|
Return on innovation costs |
-0,009 |
0,002 |
-0,694 |
-4,895 |
0,002 |
|
Thus, the active introduction of interaction’s network forms is possible provided that the number of spin-off companies, formed on the basis of R & D divisions, extending beyond the parent organization, increases. In this case, the development of small innovative companies’ competencies (spin-offs) will lead to the implementation of the alliance strategy, which in the long term will seek to implement an insourcing strategy aimed at the formation of formalized innovative network structures capable of maximizing the efficiency of using innovative resources with an appropriate level of innovation competence.
Thus, the indicators study at the regional level was carried out on the basis of data on innovation activity (the share of innovation-active enterprises) in the region as an indicator of participants’ competence level in the innovation process, as well as the value of the innovation cost, as the ratio of innovative goods’ and services’ output to the value costs for innovation, as an indicator of innovation rent’s distribution. In this regard, the task of the industries grouping in terms of development level of innovation networks is to determine the groups’ boundaries. Figure 5 shows the indicators distribution of the Russian Federation regions for these parameters. As part of the study, some values were excluded (Kabardino-Balkaria Republic and Vologda region), as they demonstrate a significant excess of the return value on innovation costs). The cluster analysis made it possible to distinguish the following groups of regions (Fig. 5).
Figure 5
Regions distribution by indicators of innovative
competence level and the innovation risks magnitude
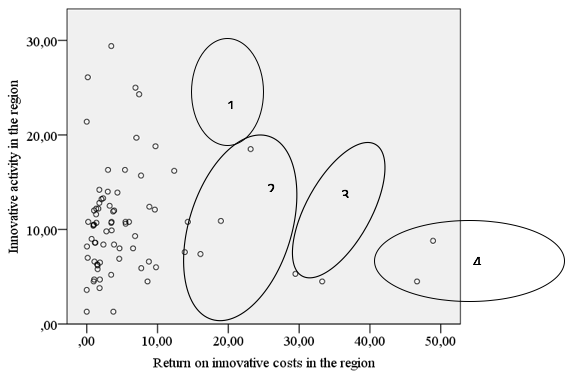
The indicators’ quantitative analysis made it possible to identify four groups of regions united by criteria of innovation activity level and the innovative costs return. These indicators, as it was noted above, characterize the level of organizations competence in the region in the field of innovation (the higher the level of innovation activity, the higher the level of competence), while the innovation costs’ return characterizes the institutional environment of innovation, that is, the nature of the rent distribution (the higher the return - the higher the value of the distributed innovation rent).
Thus, the presented clusters divide the regions according to the level of innovative networks’ development potential:
- the 1 st cluster, regions - the initial links of innovation networks - regions characterized by a high level of competencies, but low return on resources. Such regions are characterized by a high competitive environment of innovation activity, therefore, in this case, the developmental focus of innovative networks should be focused on developing markets for the implementation of innovative products, protectionist regional innovation policies aimed at stimulating demand for local innovative products;
– the 2 nd cluster, the recipient regions, the most numerous, includes regions that are characterized by a low level of innovative competence and weak development of institutional innovation interaction’s institutional environment. In this case, the priority task of the regional innovation policy is the innovation stimulation through the tax preferences’ provision, targeted programs to support innovative enterprises, the development of student start-up institutions;
– the 3d clusters, intermediate regions - characterized by average values both in terms of competence and in terms of the return on innovation costs. Such regions are characterized by an unstable position in the innovation chain (do not show a clear affiliation to either the initial or the final stages of the innovation chain). In fact, such regions can be characterized as innovation-closed, that is, the limit of the region's growth potential is achieved at the expense of internal resources, and so the management task of managing the development of innovative networks is the development of inter-regional ties. The mechanisms of state support for interregional projects can become levers of such development;
– the 4 th cluster - the final links of the innovation network. Relatively high values of innovative costs’ return in relation to a low level of innovation competence make such regions a "testing ground" for the innovative ideas implementation. In this case, it is necessary to develop the institutes of intellectual production: stimulating the creation of innovative infrastructure facilities, the development of university innovation infrastructure, etc.
The quantitative grouping data, based on the results of the cluster analysis, are presented in Table 3.
Table 3
Cluster end centers
|
Clusters |
|||
1 |
2 |
3 |
4 |
|
Innovative activity in the region |
21,30 |
8,79 |
11,99 |
5,78 |
Return on innovative costs in the region |
5,07 |
2,89 |
14,63 |
39,57 |
Number of observations in the cluster |
5 |
66 |
5 |
4 |
Cluster Regions |
9,43,45,58,78 |
1,3,4,6,7,10,11,12,13,14,15,16,17,19,21,22,23,24,25,26,27,29, 30,31,32,33,34,35,36,37,38,39,40,42,44,46,47,48,49,50,51,52,53,54,55,56,57,59, |
2,8,18,41,67 |
5,20,28,63 |
Note: 1-Belgorod region, 2 - Bryansk region, 3 - Vladimir region, 4 - Voronezh region, 5 - Ivanovo region, 6 - Kaluga region, 7 - Kostroma region, 8 - Kursk region, 9 - Lipetsk region, 10 – Moscow, 11- Orel region,12 - Ryazan Region, 13 - Smolensk Region, 14 - Tambov Region, 15 -Tver Region, 16- Tula Region, 17 - Yaroslavl Region, 18 - Moscow, 19 - Republic of Karelia, 20- Republic of Komi, 21 - Arkhangelsk region, 22 - Kaliningrad region, 23 - Leningrad region, 24- Murmansk Region, 25 - Novgorod Region, 26 - Pskov Region, 27 - St. Petersburg, 28 - Republic of Adygea, 29 - Republic of Kalmykia, 30 - Krasnodar Territory, 31 -Astrakhan Region, 32 -Volgograd Region, 33 - Rostov region, 34 - Republic of Dagestan, 35 - Republic of Ingushetia, 36 - Karachay-Cherkess Republic, 37 - Republic of North Ossetia-Alania, 38 - Chechen Republic, 39 - Stavropol Territory, 40 - Republic of Bashkortostan, 41 - Republic of Mari El , 42 - Republic of Mordovia, 43 - Republic of Tatarstan, 44 - Republic of Udmurtia, 45 - Chuvash Republic, 46 - Perm Territory, 47 - Kirov Region, 48 - Nizhny Novgorod Region, 49 - Orenburg Region, 50 - Penza Region, 51 - Samara Region, 52 - Saratov Region, 53 - Ulyanovsk Region, 54 - Kurgan Region, 55 - Sverdlovsk Region, 56 - Tyumen Region, 57 - Chelyabinsk Region, 58 - Altai Republic, 59 - Republic of Buryatia, 60 - Republic of Tyva, 61 - Republic of Khakassia, 62 - Altai Territory, 63 - Trans-Baikal Territory, 64 - Krasnoyarsk Territory, 65 - Irkutsk Region, 66 - Kemerovo Region, 67 – Novosibirsk, 68 - Omsk Region, 69 - Tomsk Region, 70 - Republic of Sakha, 71 - Kamchatka Territory, 72 - Primorsky Territory, 73 - Khabarovsk Territory, 74 - Amur Region, 75 - Magadan Region, 76 - Sakhalin Region, 77 - Jewish Autonomous Region, 78 - Chukotka Autonomous District, 79 - Republic of Crimea, 80 - Sevastopol.
Thus, the proposed technique for developing a regional strategy for innovative networks development involves clustering regions on the basis of cluster analysis into four groups of regions, each of which is characterized by a different level of innovation network's development, assessed by determining the level of enterprises’ innovation competence and the institutional environment of the region. For each group of regions, its own management mechanism is expected, based on the development of strengths and the elimination of shortcomings in the region's innovative networks.
The conducted research confirmed the hypothesis about the criteria for determining the network interaction form, which include the innovative competence’s level and the risk of innovative rent’s loss. At the same time, a consistent change in the criteria values made it possible to formulate a strategy for an innovation network development based on an innovative outsourcing strategy by transforming the companies’ spin-off created on the basis of R & D units into innovative alliances (strategic alliances) and then into an innovation network in the form of an insourcing strategy.
The proposed study practical importance is determined by the perspective role of network structures in a competitive economy; the flexibility of interaction such forms in the current dynamic external environment necessitated the development of practical recommendations on the strategy for their creation and functioning. In addition, the use of the proposed approach to the regional economic systems’ grouping in terms of the innovation networks’ development level can serve as a basis for a regional innovation policy development, federal targeted programs to stimulate innovation. The advantage of the proposed approach is the fact that within the management decisions the features of the regional innovation system are taken into account.
12 Indicators of innovation: 2017: statistical compilation. (2017). Мoscow: NRU HSE.
Blaug, М. (1994). Economic thought in retrospect. Мoscow: Delo LTD.
Castells, M. (2010). The Rise of the Network Society. Information Age, vol. 1; 2nd Edition with a New Preface. Wiley-Blackwell.
Chesbrough, H., Vanhaverbeke, W. & West, J. (2006). Open Innovation: Researching a New Paradigm. Oxford University Press.
Gradoselskaya, G.V. (2004). Network measurement in sociology. Мoscow: Publishing House «New textbook».
Katz, M.L. & Shapiro, K.D. (2003). Network externalities, competition and compatibility in Milestones of economic thought. Theory of industrial markets. Saint Petersburg: Russia.: Economic School.
Kudryavtseva, S., Shinkevich, A., Sirazetdinov, R., Volov, V., Yusupova, G., Torkunova, J., Khairullina, E., Klimova, N. & Litvin, I. (2015). A Design of Innovative Development in the Industrial Types of Economic Activity. International Review of Management and Marketing, 5(4), 265-270.
Nizhegorodtsev, R.M. (2010). Cluster-network effects and institutional filters in the modern knowledge economy. Manager, 7-8, 46-51.
Patiurel, R.F. (1997). Creation of network organizational structures. Problems of theory and practice of management, 3, 76-81.
Shinkevich, A.I., Galimulina, F.F., Lubnina, A.A. & Misbakhova, Ch.A. (2016). Economic models of the elimination of institutional gaps between science and production. The Economic Herald of the Republic of Tatarstan, 3, 36-42.
Tretyak, O.A. & Rumyantseva M.N. (2003). Network forms of inter-firm cooperation: approaches to the explanation of the phenomenon. Russian Journal of Management, 1(2), 25-50.
Zaraychenko, I.A., Shinkevich, A.I., Mitrofanova, M. Yu., Ladykova, T.I., Nuretdinova, Yu. V., Kharisova, G.M. & Zhukova, M.A. (2017). Outsourcing and In-Sourcing of Innovation in Network Organizations. Journal of Advanced Research in Law and Economics, VIII, Spring, 1(23), 297 – 304.
1. Department of Logistics and Management, Kazan National Research Technological University, Kazan, Russia. Contact e-mail: dlogscm@kstu.ru
2. Department of Logistics and Management, Kazan National Research Technological University, Kazan, Russia.
3. Department of Economics, Kazan National Research Technological University, Kazan, Russia
4. Department of Economics, Kazan National Research Technological University, Kazan, Russia
5. Department of Economics, Kazan National Research Technological University, Kazan, Russia
6. Department of Economics and Entrepreneurship in Construction, Kazan State University of Architecture and Engineering, Kazan, Russia