![]() ISSN 0798 1015
ISSN 0798 1015

![]() ISSN 0798 1015
ISSN 0798 1015
Vol. 39 (# 04) Year 2018. Page 38
Arsen A. TATUEV 1; Nataliya I. OVCHAROVA 2; Violetta V. ROKOTYANSKAYA 3; Emma B. ABANOKOVA 4; Aleksandr Yu. USANOV 5
Received: 20/07/2017 • Approved: 15/11/2017
ABSTRACT: Nowadays, it becomes clear that an extensive increase in state socially oriented budgetary obligations is impossible, and this situation increases the relevance of a research on the new tools of social policy implementation. The aim of the work was to assess the effectiveness of current budgetary expenditures on health care and education taking into account the new challenges in socio-economic development, which means raising the issue of changing a number of organizational principles of the state's social policy. |
RESUMEN: En la actualidad, se hace evidente que es imposible un aumento extensivo de las obligaciones presupuestarias del estado socialmente orientados, y esta situación aumenta la pertinencia de una investigación sobre las nuevas herramientas de aplicación de la política social. El objetivo del trabajo era evaluar la efectividad de los gastos presupuestarios actuales en la atención de la salud y la educación teniendo en cuenta los nuevos desafíos del desarrollo socioeconómico, lo que significa elevar la cuestión de cambiar una serie de principios organizacionales de la política social del estado. |

At the current stage of Russia's social development, the importance of social policy is stressed by authorities noting that the main task of this policy is to help those who needs it. For this purpose, it is foreseen to ensure the targeting of social assistance and the expansion of social policy instruments (Medvedev 2016). However, it make sense to develop social services in the context of the development of services market (Bykova and Andreev 2012).
Many experts and scientists (Voronina A., Gorina M., Monusova G., Supyan V.) emphasize the main tendencies and peculiarities of social policy, largely related to the new nature of State-society relations (Supyana 2002; Voronina and Gorin 2012; Monusova 2012).
The modern phase of social policy development can be characterized by the need for adaptation to the requirements of human capital development when changing the paradigm of economic development, as noted in the works of Blyakhman L., Kasayeva T., Klistorin V. (Kasaeva 2013; Klistorin 2015; Blyahman 2013). Of course, the relevance of research in the field of the social welfare state principles do not decrease (Velikaya and Guseletov 2012; Katz 2011; Kudinov 2014; Kuznetsov 2012; Moseyko, and Frolova 2014; Orlov and Zinchuk 2011), especially in the aftermath of the events of 2014, as was noted at the Gaidar Forum 2017. In particular, O.Golodets stressed that, first, the universal access to education is the basis of social development. Secondly, the main task of today's social policy is to restore social consumption since Russia is a social welfare state. Third, it is advisable to pay a special attention to social partnership.
In our opinion, social partnership can be one of new social policy instruments which will significantly increase the parameters of socio-economic development through the implementation of budgetary social expenditures. In such a case it will be possible to ensure the higher level of social justice and general welfare (Romanko 2014; Sidorina 2014).
The analysis of trends in the structure of people's monetary incomes and the structure of health care expenditure was carried out through the use of general economic, statistical and analytical methods. In addition, the dynamics of public spending on education and their structure, the dynamics of paid educational services, employment and unemployment rates among labor force participants depending on their education, have been considered.
Nowadays, it is impossible to increase the state budget obligations, so the task of searching for ways to improve the expenditures efficiency becomes especially important now that the State becomes more oriented to social issues.
In general, budgetary social expenses was at 35.2% in 2015. Most of these funds (7 trillion. rub.) were used for pensions provision, which involves financing the deficit of the Russian Federation State Pension Fund (Figure 1).
Figure 1
The structure of social spending of the Russian Federation consolidated budget in
2015 the chart is calculated based on the data of: Consolidated budget of the
Russian Federation and budgets of state non-budgetary funds
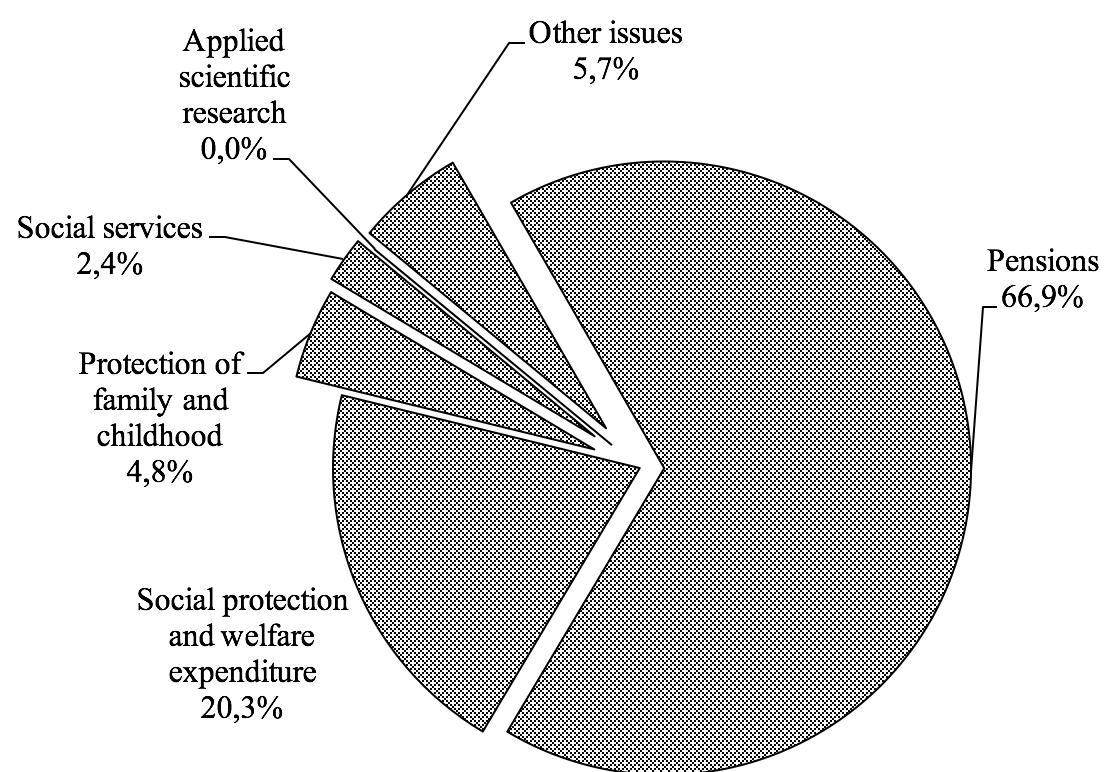
2.1 trillion. rubles were allocated to social sector, about 500 billion rubles were used to protect the family and childhood, 250 billion rubles went on social services, 200 billion rubles - on applied research in the field of social policy, and 600 billion rubles were spent to address other social issues. Given the special attention paid to social policy in the structure of public expenditure, we should expect advances in socio-economic indicators related to the social sphere. Meanwhile, Russia has a high rate of differences in the distribution of monetary incomes for different groups of the population (Figure 2).
Figure 2
Differences in income distribution by 20% groups of the population in 2015
(the chart has been calculated based on the data from: Living standard: population
income distribution)
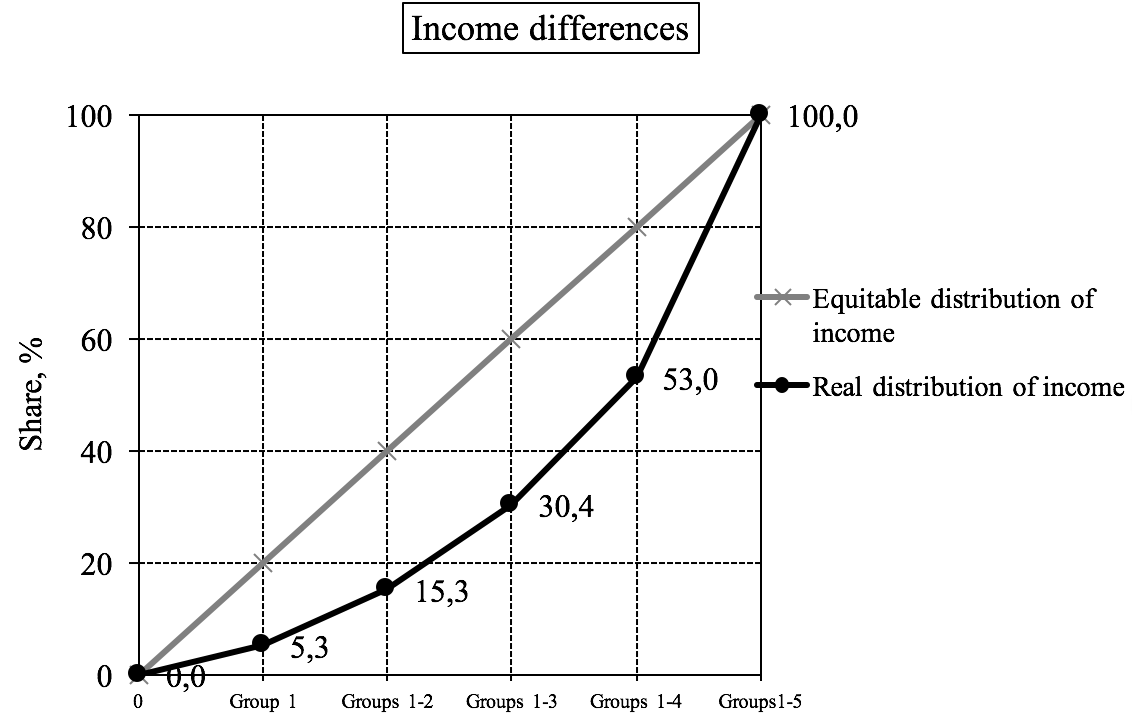
In 2015, the first 20% of the population with the lowest income accounted only for 5.3% of the total income. The groups 1 and 2 accounted for 15.3%; groups 1-3 - for 30.4%; groups 1-4 - for 53.0%. The fifth group of the population with the highest level of income accounted for the remaining 47.0% of the total population income. And in recent years the situation has remained unchanged. Moreover, the social and economic differentiation has been deepening.
Figure 3
The structure of population's money income (the chart has been calculated based
on the data from: Living standard: income, expenses and savings of the population
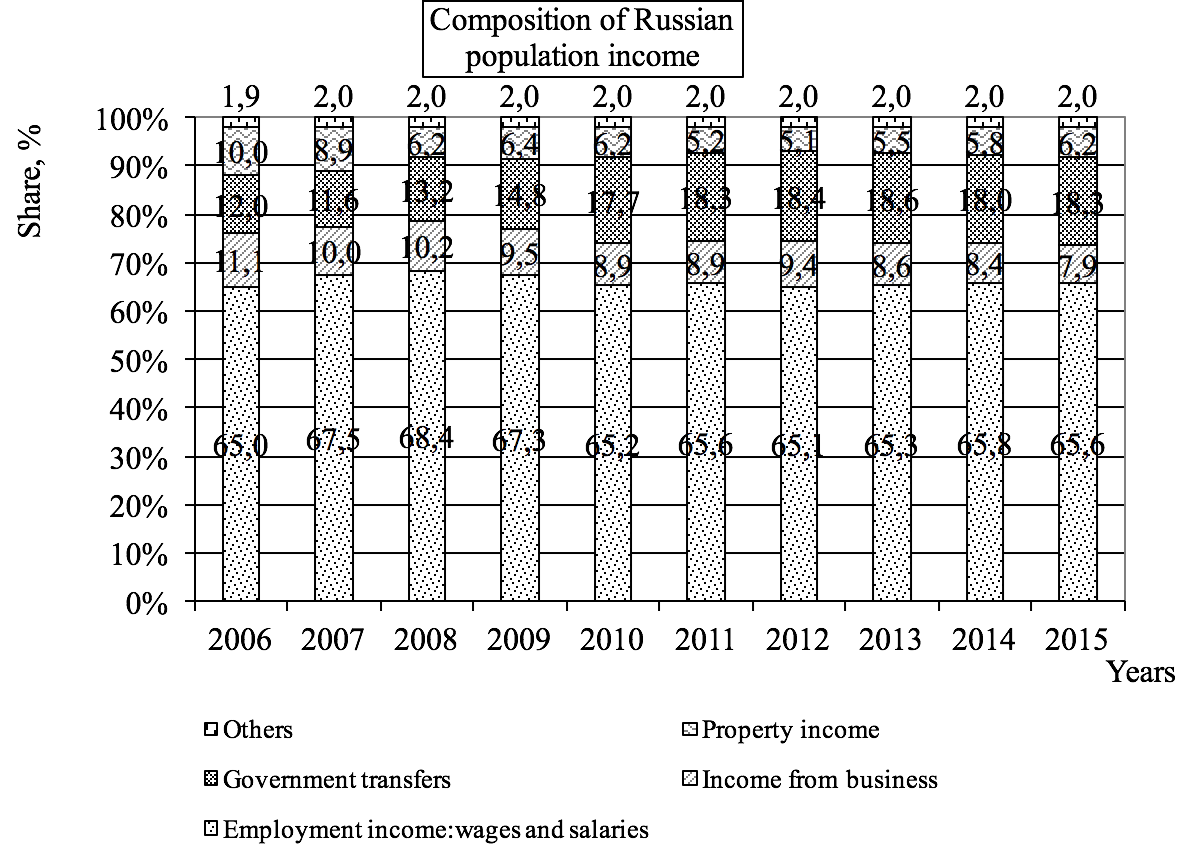
Another important indicator characterizing the socio-economic situation in the country is the population income composition. The largest share (65.6%) in the structure of the aggregate population incomes corresponds to the employment earnings (Figure 3). Another 18.3% falls on various kinds of government transfers, 7.9% - on income from business, 5.2% - on property income, and 2.0% - on other sources of income. In the period between 2006 and 2015 some significant changes occurred in the structure of the population's income. Thus, the share of income from business and property decreased by almost 1.3 (from 11.1% to 7.3% and from 10.0% to 6.6%, respectively). Instead, the social benefits increased almost 1.5 times, from 12.0% to 18.2%. The share of incomes received as remuneration of labor and from other sources stayed practically the same.
The public health expenditure in the Russian Federation amounted to 10.5% of GDP in 2015with the major part - 2.1 trillion. rub. (71.9%) - spent on other health issues (Figure 4).
Figura 4
Health expenditure in the Russian Federation by area of expenditure in 2015 the
chart is calculated based on the data of: Consolidated budget of the Russian
Federation and budgets of state non-budgetary funds
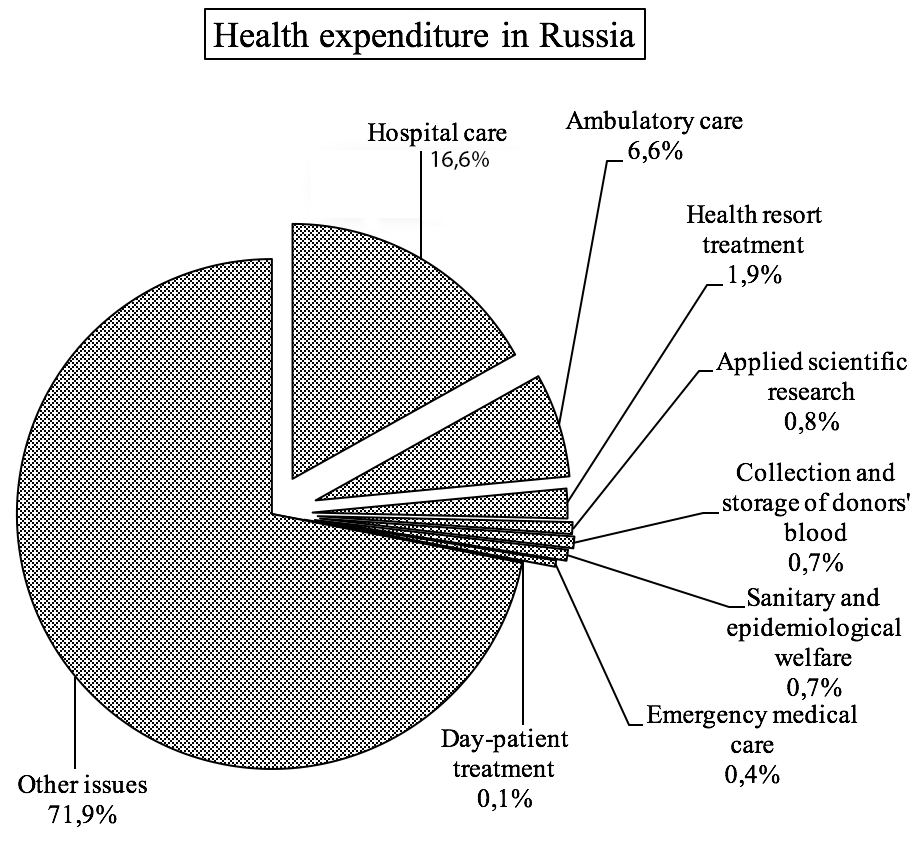
483.6 billion rubles were allocated to finance inpatient medical care (16.9%), 188.6 billion rubles (6.6%) - for outpatient care. T53.7 billion rubles (1.9%) went on health resort treatment. The rest of the funds - 130.6 billion rubles. (4.6%) were distributed among the following areas: medical care in day hospitals of all types; emergency medical care; donor blood and its components collection, preservation and storage; sanitary and epidemiological welfare; applied scientific research.
Figure 5
Morbidity patterns of Russian population by main categories of disease in 2015
(the chart is calculated based on the data of: Public health: morbidity and disease incidence
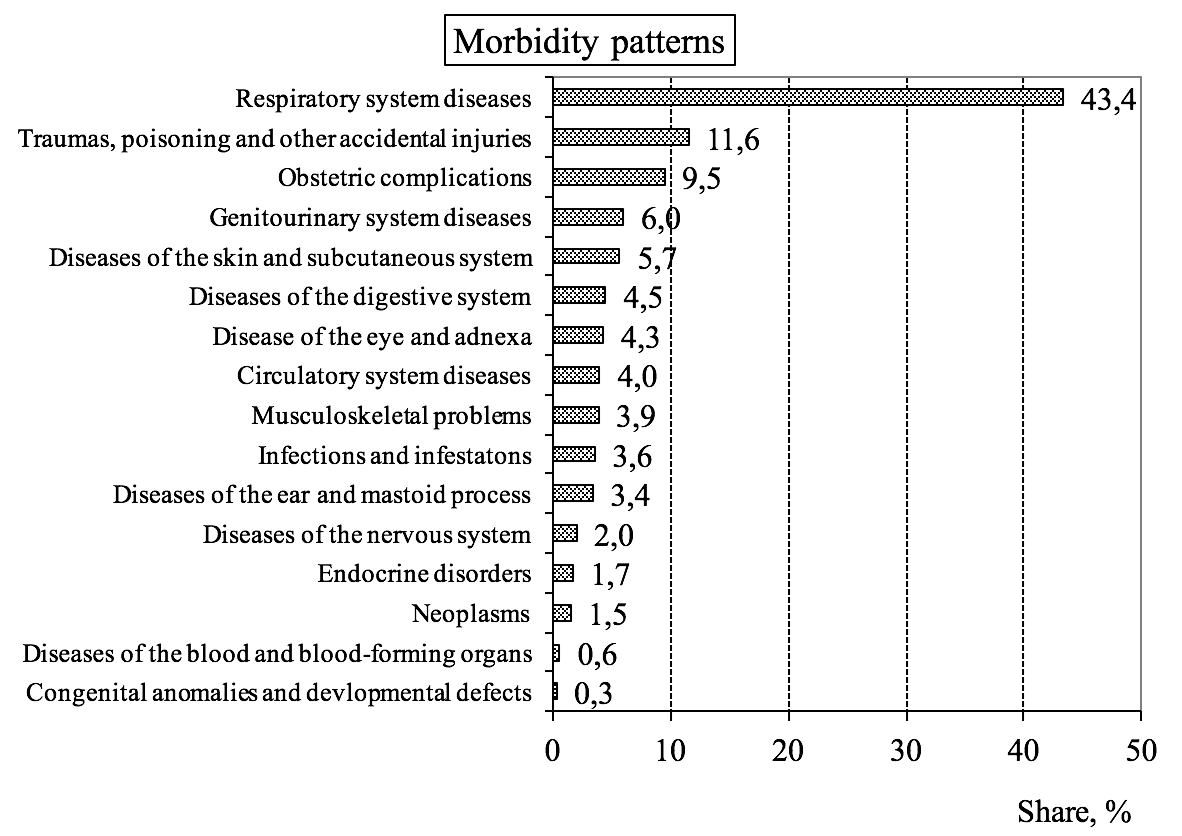
Given the positive dynamics of public expenditure on health care, the socio-economic indicators relating to this area are expected to improve (Aganbegyan 2014; Shishkin, Potapchik and Selezneva 2013). It seems that one of the key indicators is the level of primary disease incidence. Among the main causes of primary morbidity, 43.4% of the reported cases were respiratory diseases, the total number of which increased by 14.2% (Figure 5). The obstetric complications was at 9.5% and their number increased by 14.6%. The diseases of the circulatory system with initial share of 4.0% increased by 17.7%. The number of primary detected diseases of the endocrine system and neoplasms increased by 13.7% and 15.2%, respectively.
Figure 6
Structure of death causes in Russia in 2015 (the chart is
calculated based on the data of: Demography: Vital statistics
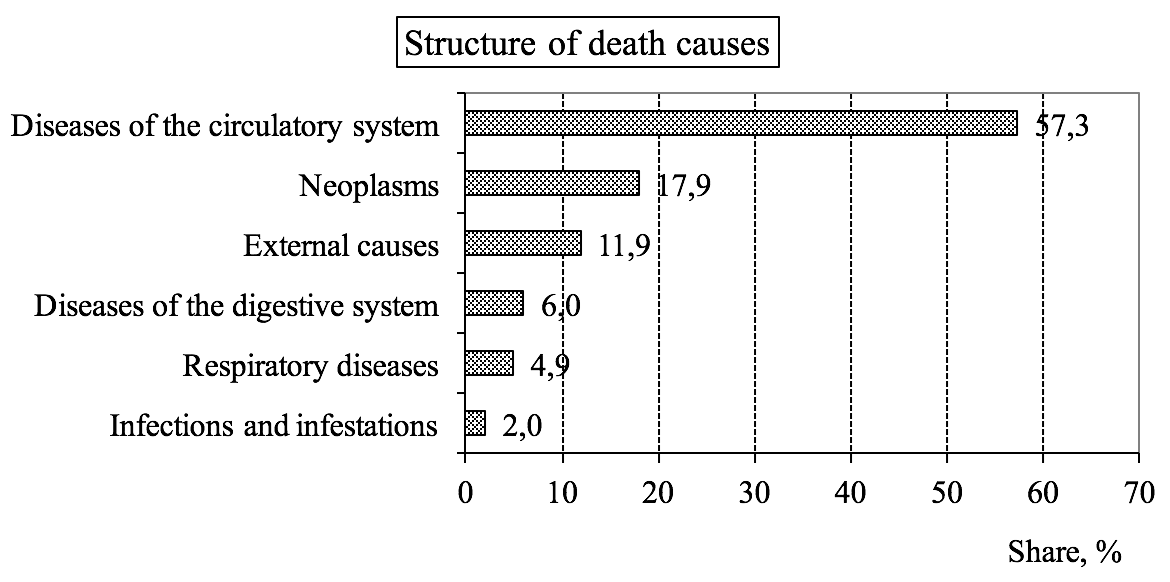
Another important indicator allowing to evaluate the Government activities in the public health sector are the death rates. The main number of deaths (57.4%) in 2015 was caused by diseases of the circulatory system (Figure 6). The number of neoplasms- related deaths was also significant (18.5% of total). External causes of mortality accounted for 11.0%. From 2.1% to 6.3% of the total number of deaths are due to diseases of the digestive system, respiratory diseases, some infections and infestations. In general, from 2006 to 2015, the death rates decreased by 13.9% - from 15.1 to 13.0 cases per thousand.
Let us consider the dynamics of total public spending on education in Russia between 2006 and 2015 (Figure 7).
Table 7
Dynamics of public spending on education in Russia (the chart is calculated based
on Consolidated budget of the Russian Federation and budgets of state non-budgetary funds
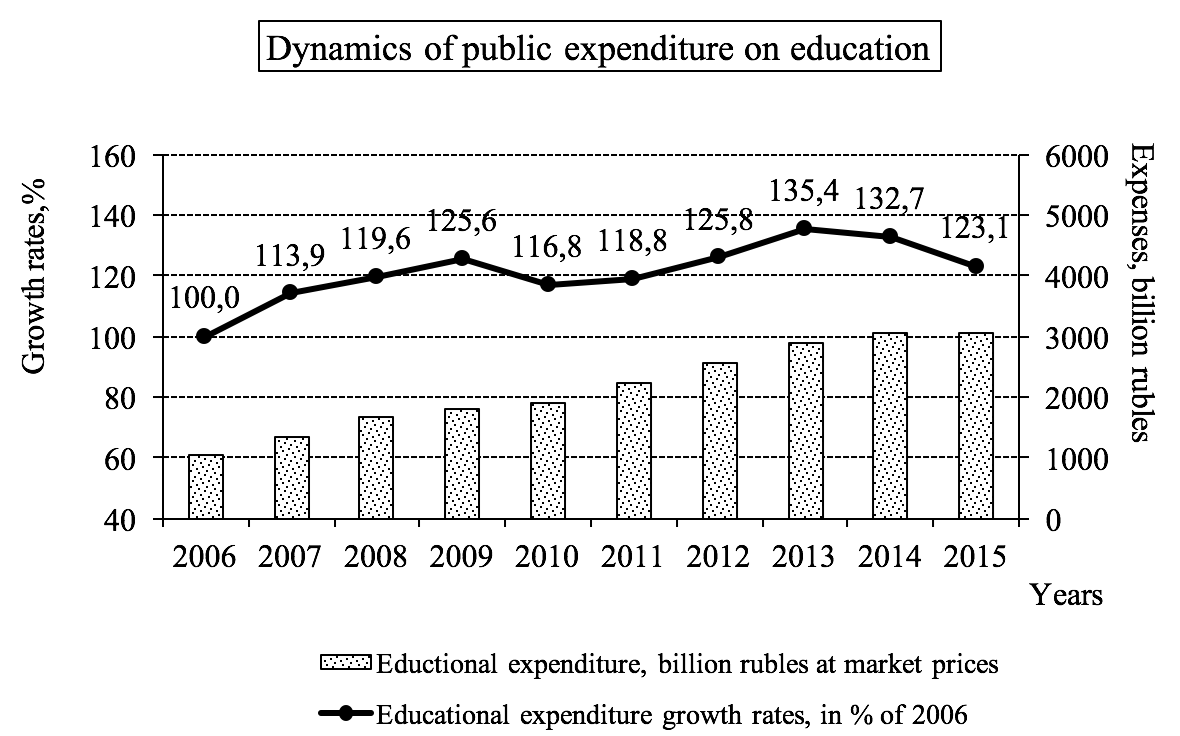
Thus, the volume of educational expenditures increased only by 23.1% and amounted to 3.0 trillion. rub in real terms during the period under consideration. At the same time, the aggregate amount of Russian budget expenditure by 49.3% in the same period. It has to be noted that public spending on education showed negative growth rates in 2010 and 2014-2015, while the peak in expenditure was in 2013 - 35.4% of the basis year. In general, educational expenses amounted to 10.2% of the Consolidated Budget of the Russian Federation in 2015. Most of funding - 1.4 trillion. rub. (46.3) was directed to general education (Figure 8).
Figure 8
The composition of public expenditure on education in Russia in 2015
(the chart is calculated based on Consolidated budget of the
Russian Federation and budgets of state non-budgetary funds
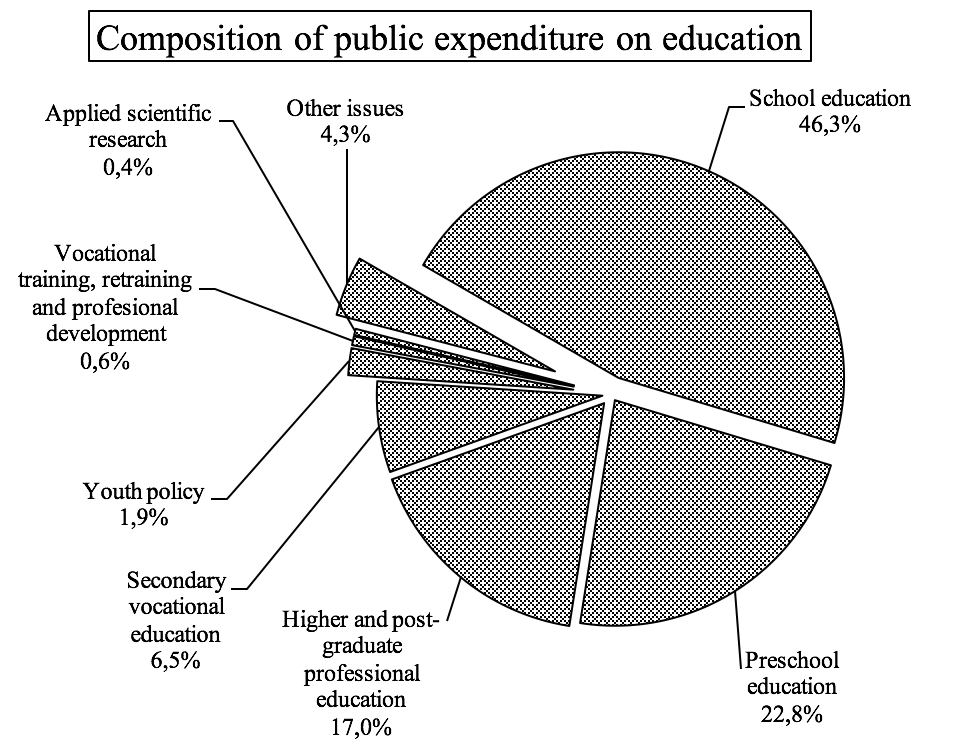
Another 700 and 500 billion rubles. (22.8% and 17.0%) were spent on financing pre-school and higher /post-graduate professional education respectively. Secondary vocational education got about 200 billion rubles. (6.5%). 60 billion rubles. (1.9%) were spent on youth policy, 20 billion rubles. (0.6%) - on vocational training, retraining and professional development, 13 billion rubles. (0.4%) for applied scientific research in the field of education. And 130 billion rubles. (4.3%) of total educational expenditure were spent on other issues.
Given a positive dynamics of public spending on education, we should expect an improvement in socio-economic indicators related directly to this sphere. One of the key indicators of this kind is the level of paid educational services. Since the education is of high social importance, it should be assumed that an increase in public spending on it should help to increase the availability of educational services and, as a consequence, to reduce the share of paid ones (Minko, and Minko 2015).
Figure 9
Household education expenditure by 20% groups of the population distributed
by their income level per capita per year, rub. (the chart is based on the data of:
Indicators of Education: Gohberg, Zabaturina and Kovaleva 2016.
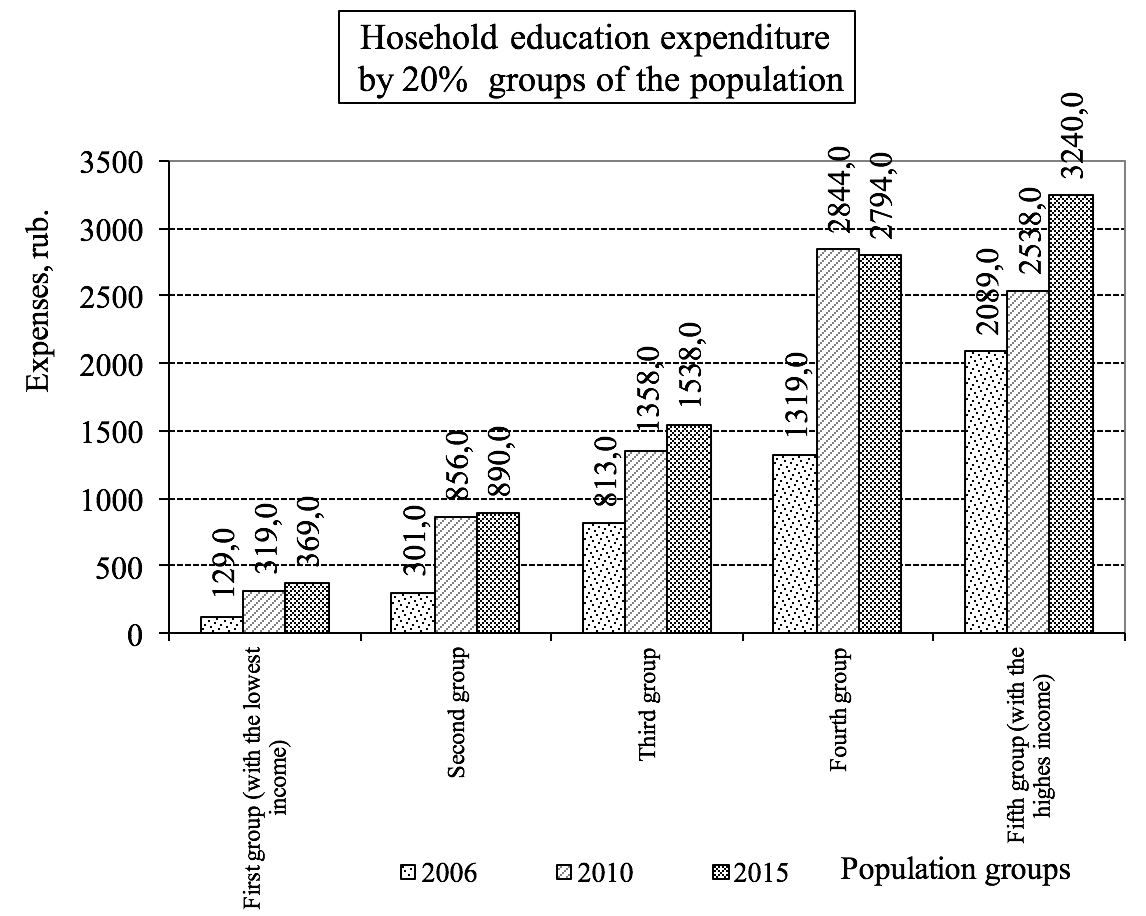
However, the general dynamics of paid services in the sphere of education in the period between 2006 and 2015 was controversial. Thus, the volume of expenditures of 1st and 2nd groups of the population with the lowest income for paid education services tripled in the basic market prices (Figure 9). The amount of expenditures of the third and fourth 20 percent of the population doubled. And the volume of expenditures of the fifth 20 percent of the population with the highest income increased only 1.5 times.
Figure 10
Dynamics of paid educational services (The chart is based on the data of:
Retail trade, services to the population, tourism: paid services to the population
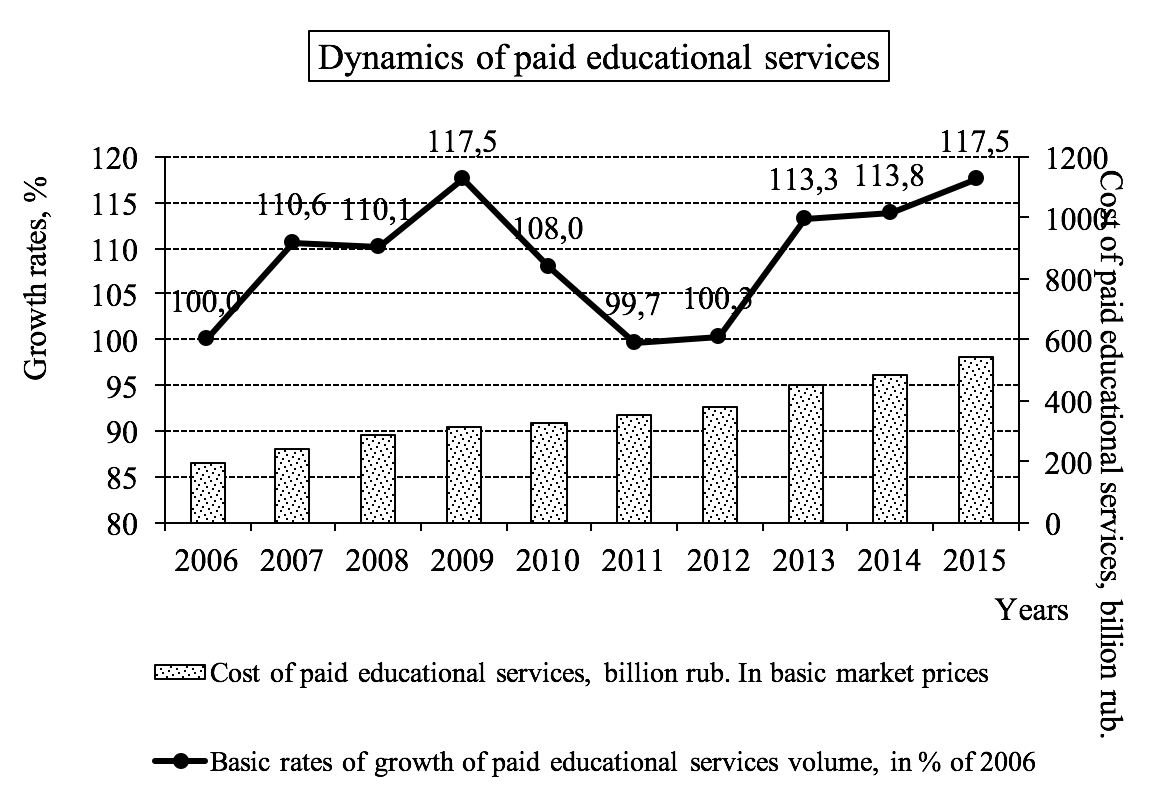
In general, during the period under consideration the aggregate volume of paid educational services provided to the population increased by 17.5% and reached the amount of 539.4 billion rubles, that corresponds to 1/6 (3,034.6 billion rubles) of the State expenditure on education in 2015 (figure 10). The total cost of paid educational services to the population increased by 17.5% as early as 2009, and then, having decreased in 2011to 99.7% of 2006, it began to increase again in 2015.
Table 1
Chain-weighted growth rates of paid educational services to volume and growth rates
of public expenditure on education, adjusted for the annual inflation rate, in%
of the previous year *
Axis |
Indicator |
2006 |
2007 |
2008 |
2009 |
2010 |
2011 |
2012 |
2013 |
2014 |
2015 |
X |
Expenditure on education |
- |
13,9 |
5,0 |
5,1 |
-7,0 |
1,7 |
5,9 |
7,7 |
-2,0 |
-7,2 |
Y |
Cost of paid educational services to the population |
- |
10,6 |
-0,5 |
6,7 |
-8,0 |
-7,7 |
0,6 |
12,9 |
0,5 |
3,2 |
Note: * The table was made based on the data of: Consolidated budget of the Russian Federation and budgets of state non-budgetary funds; Retail trade, services to the population, tourism: paid services to the population
Thus, against the background of ambiguous dynamics and growth of public spending on education, the similar changes occured in the total cost of paid services rendered to the population in the sphere of education. This allows to formulate the hypothesis that the reduction of the population's expenses for paid educational services should be in high correlation with the growth of Government expenditure on education. We shall calculate the correlation to confirm or disprove this hypothesis. Given the fact that both series have linear dynamics, a false correlation can be established between them. To avoid this, the correlation must be calculated based on the values of the chain-weighted growth rate of the dynamics series levels (Eliseeva 2010). Table 1 shows the growth rates of the population's expenditure on paid educational services and the education expenses of the Consolidated Budget. The price data are adjusted for inflation and are expressed in constant base period prices.
We calculate the linear correlation coefficient on the basis of the remaining values. The linear correlation coefficient is calculated by the formula (1) ,
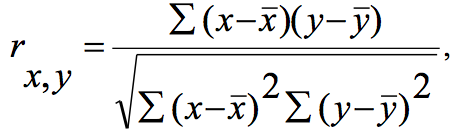 (1):
(1):
Where
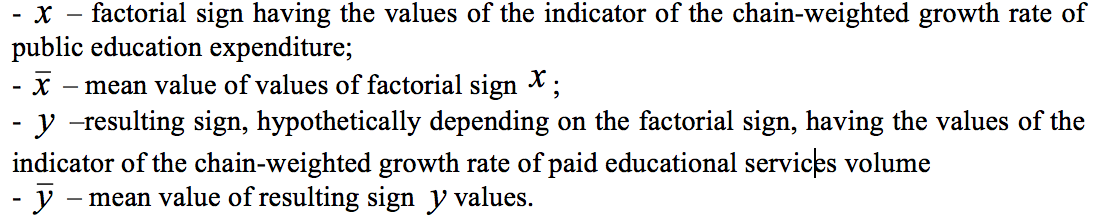
Figure 11
Scatter diagram reflecting the relationship between the indicators of chain-weighted
growth rates of paid educational services volume and public education expenditure in
the Russian Federation in the period between 2006 and 2015 (the diagram was calculated and
drawn up by the author based on the data of Table 1)
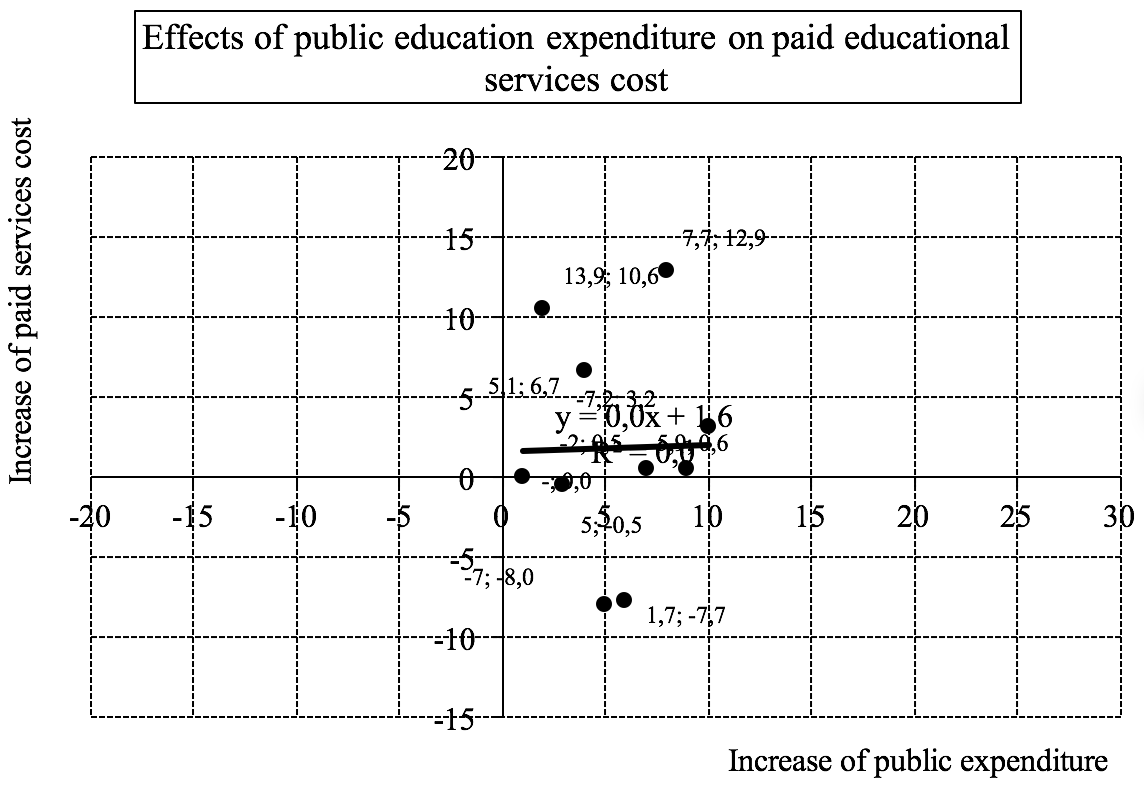
To make calculations, we used the Microsoft Excel spreadsheet editor, namely the "CORREL" function. This function returns the value of the linear correlation coefficient between two ranges of cells containing the values of the investigated indicators. As a result, . This value allows us to characterize the relationship as moderate. It means that there is a direct moderate dependence between the chain-weighted growth rates of paid educational services volume and the public education expenditures. Consequently, the hypothesis put forward earlier should take the opposite form - in a number of cases, there is a direct correlation between the increase in public spending on education and the increase in the volume of paid educational services. That is, it turns out that the growth of public spending provokes the growth of the population's expenditures on educational services.
Another important indicator characterizing the Government's activity in education sector is the rate of unemployment. Thus, among the population with higher and secondary professional qualifications, the highest level of employment (70-80%) and the lowest unemployment rate (3-6%) are observed (Figure 12).
Figure 12
Employment and unemployment rates of working-age population by level of education
in 2014 (the chart was made by the authors based on the data of Indicators of
education: Gohberg, Zabaturina and Kovaleva 2016)
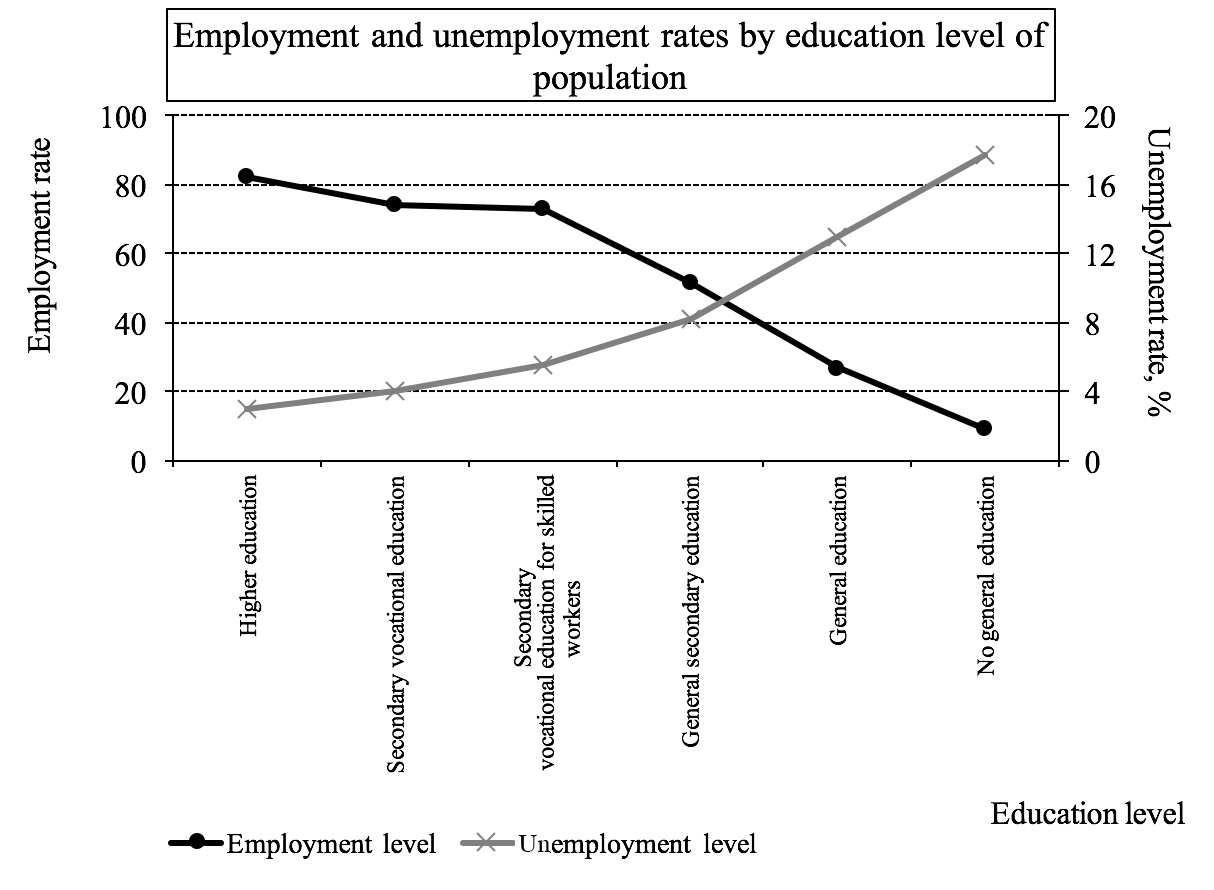
Among the population with general secondary education, average employment rate of 50% and unemployment rate of 8% have been reported. And among the population with the basic general or no- education the lowest level of employment (9-27%) and the highest level of unemployment (13-18%) have been fixed.
Figure 13
Dynamics of unemployed persons number and unemployment rate (the diagram
was made by the author based on data of: Labor: employment and unemployment
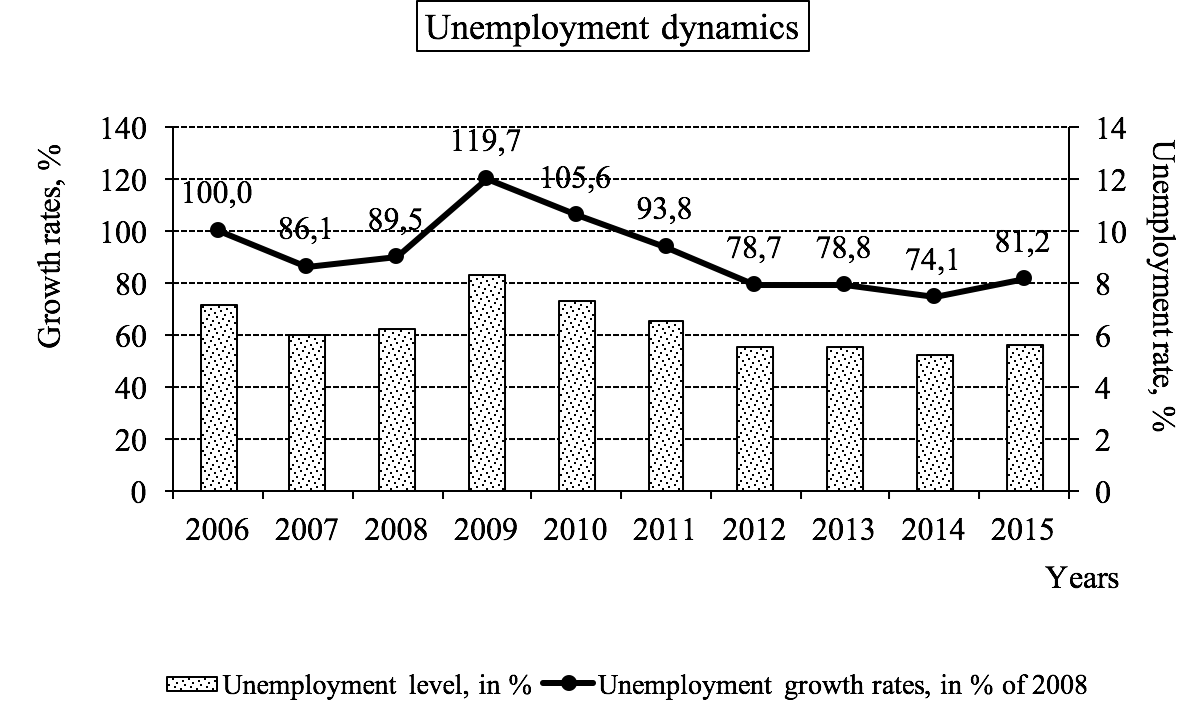
In general, the number of unemployed persons fell by 18.8% - from 5.3 to 4.3 million people between 2006 to 2015 (Figure 13). At the same time, in the crisis year 2009 there was a sharp increase in the number of unemployed - by 19.7% compared to 2006, or by 33.8% compared to 2008. However, in 2014-2015 there was not such a sharp rise. During the period under review the unemployment rate (calculated using the methodology of the International Labor Organization - ILO) declined from 7.1% to 5.6% of the economically active population.
Given the fact that both series have linear dynamics, a false correlation can be established between them. To exclude this fact, the correlation must be calculated based on the values of the chain-weighted growth of the levels of dynamics series. Table 2 shows the growth rates of the number of unemployed persons and the public education expenditures. The price data are adjusted for inflation and are expressed in constant prices of the basic period.
Table 2
Chain-weighted growth rates of unemployment and public education expenditure
in the Russian Federation, adjusted for inflation, in % of the previous year*
Axis |
Indicator |
2006 |
2007 |
2008 |
2009 |
2010 |
2011 |
2012 |
2013 |
2014 |
2015 |
X |
Public education expenditure |
- |
13,9 |
5,0 |
5,1 |
-7,0 |
1,7 |
5,9 |
7,7 |
-2,0 |
-7,2 |
Y |
Number of unemployed persons |
- |
-13,9 |
3,9 |
33,8 |
-11,8 |
-11,2 |
-16,1 |
0,2 |
-6,0 |
9,6 |
Note: * the table was drawn up based on the data of:
Consolidated budget of the Russian Federation and budgets of
state non-budgetary funds; Human resources: employment
and unemployment
The decrease in unemployment along with an increase in government spending on education makes it possible to put forward a hypothesis regarding the inverse relationship between unemployment dynamics and the amount of public education expenditure. To confirm or disprove this hypothesis, we calculated the correlation in the same way as it was shown above.
To calculate the correlation coefficient, it is necessary to first estimate the distribution of the indicators values along the chart in order to identify abnormal deviations from the average characteristics of total population. For this purpose, a scattering diagram was made (Fig. 14), where the values of the chain-weighted growth rates of public education expenditure were plotted along the X -axis, and the values of the chain-weighted growth of unemployment persons number were plotted along the ordinate (Y) axis.
Due to the visual analysis of the diagram we can mark the point with coordinates (5.1, 33.8), characterizing the increase of the studied indicators in 2009 as an anomaly and to exclude it from further analysis.
Let us calculate the linear correlation coefficient based on the remaining values. To make calculations, we used the "CORREL" function of the Microsoft Excel spreadsheet editor. As a result, we get.
Figure 14.
Scatter diagram reflecting the relationship between the indicators of chain-weighted
growth rates of unemployment and public education expenditure in the
Russian Federation in the period between 2006 and 2015 (the diagram
was calculated and drawn up by the author based on the data of Table 2)
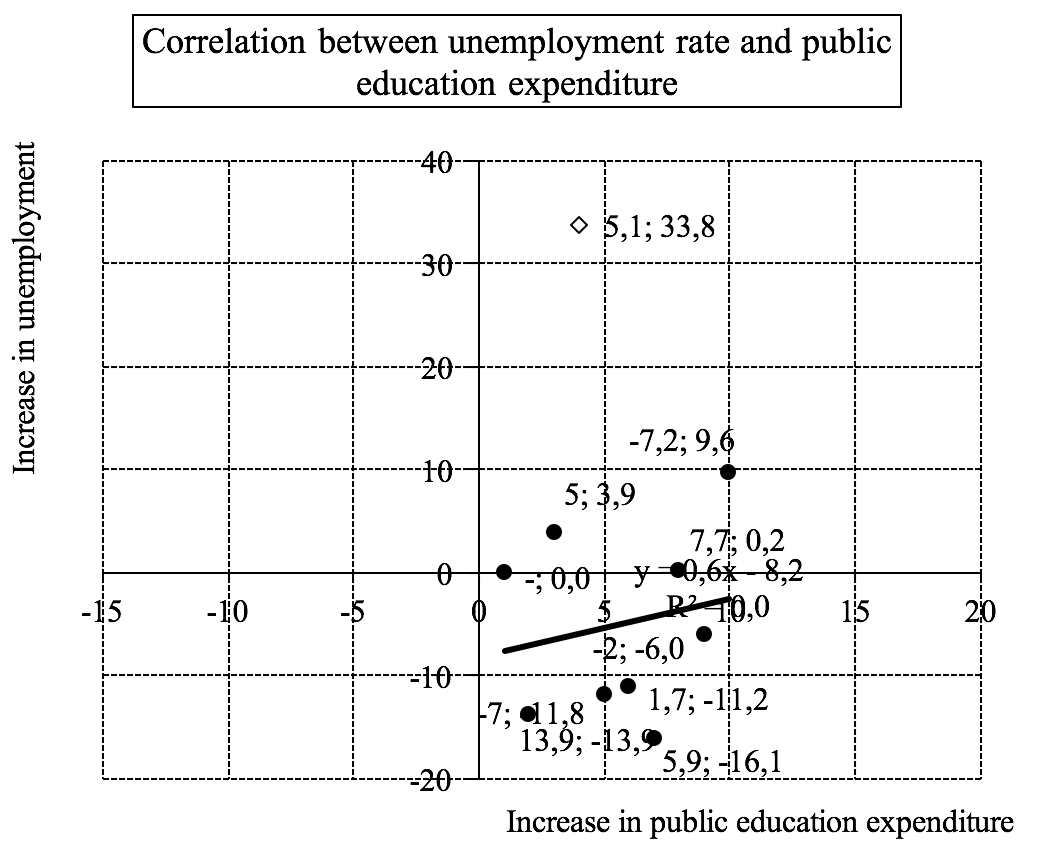
This value allows us to characterize the relationship as weak and inverse. That is, between the chain-weighted growth rate of unemployment and the public education expenditure there is, as expected, a weak inverse dependence. Consequently, the previously proposed hypothesis can be confirmed only with significant assumptions. At the same time, the more important factor may be the dynamics of economic development. The indicators considered together can largely depend on the changes in GDP growth rates: economic growth leads to an increase in budget expenditures, and at the same time to a reduction in unemployment.
Thus, summarizing the results of performed analysis, we can state the absence of explicit relationships between the dynamics of socio-economic indicators and the dynamics of expenditures of the Russian Federation Consolidated Budget. Meanwhile, the growth of government spending results in improving certain indicators characterizing the social policy implemented by the State - reducing the level of unemployment and poverty of the population, reducing the level of mortality, etc. However, general trends show that public spending is growing faster than positive changes in various socio-economic indicators occur. It can be clearly seen that the 1.5 times increase in real expenditures from the Consolidated Budget of the Russian Federation over the past decade was not accompanied by a similar change in the remaining socio-economic indicators. This led to an increase in the fiscal burden on the economy of the country and the deterioration of business-climate, and created the threat of further expansion of public spending.
Consequently, the observed increase in public expenditures is not justified from the point of socio-economic efficiency. Before continuing to build up state obligations, it is necessary to improve the efficiency of public resources used by the State, and it only can be done developing socially-oriented market institutions (socially-oriented NGOs, including those financed by the state).
In general, the implementation of the financial component can be ensured by providing each member of the society with a guaranteed right to receive a certain amount of money from state sources to pay the services of socially-oriented non-governmental non-profit organizations. So this is happening right now, when the funds collected by redistribution of population primary incomes go towards reinforcing public funds (the budgetary system). However, further use of these funds is based on the principle of sectoral funding aimed at the achievement of certain program objectives, which are only indirectly related to the final result. The integration of non-profit organizations functioning in the conditions of market competition opens the possibility of allocating funds on the principle of satisfying the final demand of direct consumers, who are most interested in obtaining quality services and achieving the maximum result.
The analytical and theoretical results of our research showed the absence of obvious correlations between the dynamics of socio-economic indicators and the dynamics of certain social expenditures of the Russian Federation Consolidated Budget. At the same time, the growth of public spending was accompanied by improvement of certain indicators characterizing the social policy implemented by the state: reducing the level of unemployment and poverty of the population, reducing the mortality. However, general trends indicate that public spending is growing at a rate that outstrips the positive changes in various socio-economic indicators, indicating that they are not effective enough. The obtained results can be used for increasing the effectiveness of public resources use by the state. Only advanced development of socially-oriented market institutions can help to achieve this.
In the article, the empowering of state social policy by non-state resources mobilization on the basis of co-financing and increasing the participation of non-profit organizations in social entrepreneurship is offered.
Aganbegyan A.G. (2014). The aims and measures of the reform of health care in Russia. Questions of Economy, 2, 149-157.
Blyahman L.S. (2013). Global crisis and change of paradigm of economic development. Vestnik of Saint Petersburg University. Series 5. Economy, 2, 3-21.
Bykova N. and. Andreev S.A. (2012). Service Market: problems and prospects. Bulletin of Volga region state University of service. Series: Economics, 22, 34-38.
Consolidated budget of the Russian Federation and budgets of state non-budgetary funds. Russian Federal Treasury: official website of the Russian Federal treasury.
Eliseeva I.I. (2010). Statistics. St. Petersburg: Piter, pp. 141-146.
Gohberg, L.M., Zabaturina, I.Yu. and Kovaleva, N.V., et al. (2016). Мoscow: NRU HSE, pp. 48
http://www.roskazna.ru/ispolnenie-byudzhetov/konsolidirovannyj-byudzhet/ (data extracted on 15.12.2016)
Human resources: employment and unemployment. Federal State Statistics Service: official website. http://www.gks.ru/wps/wcm/connect/rosstat_main/rosstat/ru/statistics/enterprise/retail/ (data extracted on: 15.12.2016))
Kasaeva T.V. (2013). Expansion interpretation of the structure of human capital. Terra Economicus, 11(2-2), 21 – 27.
Katz I.S. (2011). Modern decentralized local public sector. Journal of economic theory, 4, 202-206.
Klistorin V.I. (2015). The Mystery of public goods. Again on the economic functions of the state. EKO, 10(496), 129-138.
Kudinov A.S. (2014). Nature of statehood in contemporary international law. Bulletin of the Institute of legislation and legal information of M.M. Speransky, 3(30), 39-43.
Kuznetsov M.S. (2012). The Doctrine of the social state in works of Russian scientists. The World of politics and sociology, 8, 93-98.
Medvedev D.A. (2016). The social-economic development of Russia: finding new dynamics. Problems of Economics, 10, 5-30.
Minko, E.V. and Minko A.E. (2015). Free and paid higher education in Russia: dynamics, role and evaluation. Alma mater (High School Vestnik), 5, 7-19.
Monusova G. (2012). Social policy in the European public opinion: an implicit contract between society and government. Economy of Questions, 6, 127-151.
Moseyko, V.V. and Frolova E.A. (2014). The Social government vs. the social dependency. Bulletin of the Tomsk state pedagogical University, 8, 102-107.
Orlov A.V. and Zinchuk G.M. (2011). Towards a social state. Bulletin of the Russian economic University of G.V. Plekhanov, 4, 3-5.
Public health: morbidity and disease incidence. Federal State Statistics Service official website. http://www.gks.ru/wps/wcm/connect/rosstat_main/rosstat/ru/statistics/population/healthcare/ (data extracted on 15.12.2016))
Retail trade, services to the population, tourism: paid services to the population. Federal State Statistics Service: official website. http://www.gks.ru/wps/wcm/connect/rosstat_main/rosstat/ru/statistics/enterprise/retail/ (data extracted on: 15.12.2016))
Romanko I.E. (2014). Principles of social policy as a vector of the realization of justice in modern State. State and municipal management in the XXI century: theory, methodology, practice, 14, 19-24.
Shishkin S., Potapchik E. and Selezneva E.V. (2013). Private health care sector in Russia: current state and prospects of development. Questions of Economy, 4, 94-112.
Sidorina T.Y. (2014). Multiple approaches to the typology of the welfare state. Issues of economy, 8, 122-139.
Supyana V.B. (2002). State economic policy of the United States: current trends. Moscow: Nauka, pp. 348.
Velikaya N.M. and Guseletov B.P. (2012). From social utopia to the social state. Sociological researches, 6, 36-45.
Voronina A.S. and Gorin M.S. (2012). Peculiarities of social policy in the social state. Bulletin of Economics, law and sociology, 3, 22-27.
1. Kabardino-Balkarian State University named after Kh.M. Berbekov, Russia, 360004, Kabardino-Balkarian Republic, Nalchik, Chernyshevskogo st., 173; E-mail: arsen.tatuev@mail.ru
2. Surgut State University, Russia, 628412, Surgut, Lenina prospect, 1; E-mail: ovcharova_natali@inbox.ru
3. Russian State Agrarian University named after K.A. Timiryazev, Russia, 127550, Moscow, Timiryazevskaya street, 49; E-mail: rokotyanskay_V_V@mail.ru
4. Kabardino-Balkarian State University named after Kh.M. Berbekov, Russia, 360004, Kabardino-Balkarian Republic, Nalchik, Chernyshevskogo st., 173; E-mail: abanokova2016@mail.ru
5. Financial University under the government of Russian Federation, Russia, 125993, Moscow, Leningradsky prospect, 49; E-mail: alexus261279@mail.ru