![]() ISSN 0798 1015
ISSN 0798 1015

![]() ISSN 0798 1015
ISSN 0798 1015
Vol. 38 (Nº 59) Year 2017. Page 29
Igor A. DETS 1; Andrey S. MIKHAYLOV 2; Vasilisa V. GOROCHNYA 3
Received: 08/08/2017 • Approved: 07/09/2017
ABSTRACT: Cluster is one of the numerous scholarly concepts that theorize inter-organizational networking within a particular territory. Over the past quarter of a century cross-border quasi-integration of regional industry and innovation systems has proven to be an efficient scheme of cohesion policies, both within and across nations. Outlying border and coastal regions are found to be of particular benefit from cross-border clustering, as it reinforces their innovative activity. The article is set to provide an approach of cluster mapping visualization, differentiating clusters by localization and development features. |
RESUMEN: Cluster es uno de los numerosos conceptos académicos que teorizan las redes interorganizacionales dentro de un territorio particular. Durante el último cuarto de siglo, la cuasi integración transfronteriza de los sistemas regionales de industria e innovación ha demostrado ser un sistema eficiente de políticas de cohesión, tanto dentro como a través de las Naciones. Las regiones fronterizas y costeras periféricas se encuentran especialmente beneficiadas por la agrupación transfronteriza, ya que refuerza su actividad innovadora. El artículo se establece para proporcionar un enfoque de visualización de mapping de clústeres, diferenciando los clústeres por características de localización y desarrollo. |

Research on the features of socio-economic development of territories often focuses on regions with special characteristics of economic-geographical position and development factors. One of these characteristics is state border (i.e. national frontier), which in itself is not determinative, being dependent on the totality of other factors (Berzi, 2017; Dokoupil, 2000; Rieber, 2015). These can contribute to either accelerated economic development, or prolonged stagnation, including the formation of depressed regions. The ambiguity of the border characteristic of the territory remains in combination with another important characteristic – the coastal position (Fedorov et al., 2017; Karsli et al., 2011; Taubmann, 2001; Wei, 1998). In the presence of other positive conditions, the coastal position is to a certain extent able to compensate even for such a negative factor as the border position with the regions in a state of protracted recession. Thus, consideration of the mutual influence of the coastal and border position of the territory is of particular interest.
The presence of an extensive marine coastline around the globe, along with the development of cross-border cooperation in recent decades (Halás, 2007; Medeiros, 2014; Mikhaylov and Mikhaylova, 2014; Setnikar-Cankar et al., 2013), leads to the emergence and spread of new forms of international economic cooperation and integration conducive to the overall socio-spatial development – the cross-border and trans-aquatic clusters. Holistic research on these types of international clusters as spatially embedded inter-organizational networking presupposes the visualization of data using geographic information systems.
The study is focused on elaborating a cartographic modeling scheme designed to supplement the existing cluster mapping techniques with geographic visualization of spatial particularities and development features of clusters across national borders.
Elimination of economic constraints that limit the effects of the coastal geo-economic position leads to radical socio-economic changes. For example, opening of China’s coastal regions to foreign investors in the 1980s resulted to the multiple growth of the largest economic centers – Hong Kong, Shanghai, etc., which compete with the main economic centers of Korea and Japan, while forming stable and multifaceted ties in-between. This has ultimately led to a significant increase in the role of all East Asia in the global economy, and gave impetus to the development of regions located 50-150 kilometers from the sea coast (Won, 2012).
Crowell et al (2007) draw attention to the fact that in recent scholarly research there has been widespread acceptance that coastal areas concentrate the highest share of population, and the proportion of the population living in the coastal zone gradually increases. Their research conclusions are based on the US data, taking into account the population of the coastal territories classified as such by the methodology of the US Department of Commerce. At the same time, the authors point to another possible method of assigning territories to coastal type, according to which the area of the coastal zone is much smaller. Both approaches are based on the grid of administrative-territorial entities of the second level – the counties that make up the states (i.e. NUTS 2 level). At the same time, first methodology takes into account all the districts located directly on the coast (including the Great Lakes), while the second implies a slightly more complicated approach. It implies that counties with at least 15% of the territory located within the boundaries of the coastal watershed or within the boundaries of the coastal catalog unit are considered as coastal (Hydrologic Unit Maps, 2015).
In general, it can be noted that the described delimitation techniques enable to fairly objectively assess the role of the marine coast and its resources on the geo-economics of coastal areas. The requirement of the presence of at least 15% of the territory of the administrative territorial unit within the catchment basin of the coast ensures that the population is not isolated from the seashore by the landscape barriers, thus, does not restrict any marine economic activity. However, the application of this approach to other countries is somewhat difficult, due to the limited availability of a list of standardized catchment areas (analogue of hydrological catalog units in the United States), previously adopted by government bodies.
The approach of isolating coastal zones proposed by Savitsky (1997) in the middle of the XX century and further developed by Bezrukov (2008) is based on absolutely different principles. Both authors consider the coastal geo-economic position as a characteristic of a territory that is of primary importance and influences the entire emerging structure of the economy. At the same time, scholars take into account the cost factor of land transportation, which is reflected in their spatial zoning according to the principle of equal distances. Nodes located at a certain equal distance from the coast of non-frozen seas are connected by a line. According to Savitsky (1997), the first boundary should be set at a distance of 400 km from the sea, whereas Bezrukov (2008) identifies two coastal zones much closer to the sea: the nearest is 50 km from the coast and distant is measured up to 200 km.
A distinctive feature of this approach is to take into account the influence of increase in the cost of transportation (both water and land) on all sectors of the economy as the distance from the sea increases. Perhaps the advantage of the approach could be strengthened if the lines of equal distances had taken into account existing land transport routes – this aspect is especially important for territories with a thin traffic network and a small number of transport approaches to the coast and seaports. This would make it possible to compile a complete list of coastal administrative-territorial entities of lower levels (similar to counties in the United States).
Another approach to define coastal territories is used by Eurostat (Collet and Engelbert, 2013). The methodology uses a 50 km distance from the coast, but the main indicator of belonging to the coastal type of territories is the population itself. The administrative-territorial entities of the third level (i.e. NUTS 3) have been classified as coastal given the following conditions: more than half the population of the territory should live no more than 50 km from the coast. Thus, even the large territorial administrative formations of the northern Finland and Sweden, the most continental parts of which are located more than 250 km from the sea coasts, rightly fall into the category of coastal ones, as their population mainly lives in the coastal zone. At the same time, in countries like Great Britain, Germany, Italy, Greece, areas that have no direct access to the sea but have settlement systems that gravitate toward the sea are defined as coastal.
Undoubtedly, there are other approaches to the definition of coastal territories, based not on one feature or characteristic, but on a whole complex of such characteristics, including socio-economic, political-geographical, natural-ecological, etc. Often such approaches can serve for specific zoning of coastal territories, featuring complex assessment methods (Gogoberidze and Mamaeva, 2012). Nevertheless, it is the wide range of factors considered that leads to the fact that the use of such complex approaches is complicated, while the results obtained are often ambiguous.
The existing difference in the approaches to determining the coastal zone can cause some difficulties in the study of socio-economic processes in different countries, primarily in the analysis of statistical data. Vivero and Mateos (2012), for example, faced a problem of incompatible statistical data on maritime indicators provided by the national statistical office of Spain and the European resources. In such circumstances, the data sources themselves often determine the approach to the definition of coastal territory, which can be used for further analysis.
With that, it is worth noting that practically any of the approaches described allow capturing the most important socio-economic features of coastal territories (Espon Atlas, 2014; NOAA GeoPlatform, 2017). One of these basic features is the intensive formation of clusters, stimulated by the coastal position of both inland and border territories. Unique in this sense is the experience of Europe, as a continent with a large number of territories being simultaneously coastal and border. These regions feature a set of conditions that create both positive and negative prerequisites for possible socio-economic development, including the formation of cross-border and trans-aquatic clusters.
Scholarly literature distinguishes a variety of cluster identification, delimitation and demarcation methods. They differ in the approaches to the collection and analysis of data, to the type of statistical, analytical, historical and other information required, as well as quantitative, qualitative and complex analysis applied.
Most Western European organizations on cluster development select the self-proclaimed membership approach in delimitation of clusters. In particular, the study Walerud and Viachka (2007) on the identification of cross-border clustering is based entirely on a holistic analysis of the data submitted by cluster organizations to the European Cluster Observatory, reports from the projects carried out by the European Commission (e.g. Europe INNOVA or European cluster conference), surveys of formal cluster initiatives (usually financed through the Interact / Interreg program), as well as other open-source data available on the Internet. This method allows getting a detailed understanding of the structure and features of the cluster under study, but almost completely ignores the existence of self-financed cluster initiatives, and also has a high dependence on the expertise of researchers.
The widely applied quantitative methods to cluster mapping are grounded on the localization coefficient (CL), the export accounts data, input – output tables (inter-industry balance sheets), as well as the zip codes of the cluster members. The localization coefficient (CL) method reflects the level of specialization of the studied region within a certain type of economic activity. The most commonly used threshold factor is 1.5, which means a higher (by 50%) specialization of this region as compared to the national average. In the context of cross-border cluster identification, it is proposed to correlate CL of neighboring regions with comparable level of specialization in the same or adjacent industries (i.e. cluster categories; Delgado et al., 2014; Ketels and Protsiv, 2013). Despite the data accessibility, simplicity of calculations, the possibility of performing comparative analysis and combining with other methods, this approach has a number of significant drawbacks: inter-industry relations are not taken into account, there is no consensus in choosing the threshold value of the coefficient, a high degree of dependence of the research results on the choice of the boundaries of the region and areas of comparison, while clusters of high-performing industries are ignored (as they require less labor force).
The Ripley-K method (including its various modifications) solves one of the methodological problems inherent in the CL method – it enables to apply flexible determination of boundaries. The results make it possible to identify the presence or absence of local super-concentration within a globally-oriented industry. However, the method requires a detailed map showing the location of most of the firms in the analyzed regions, as well as a specialized software for data processing. Moreover, like all quantitative approaches based on statistical data, the method is able to reveal only the degree of geographical concentration of enterprises, but not the degree of interaction between them.
Export accounts also form only probabilistic notions about the key economic activities of the region and do not reflect interactions within the cluster entities. The availability of statistical data necessary for calculations in the context of individual regions and economic activities is limited.
The method of input-output tables or inter-industry balances uses final product data in the analysis, which makes it possible to determine the existence of real industry interactions and the volume of transactions. The method is not focused on determining the localization of industry, and takes into account only the movement of commodity flows, which does not reflect the role of non-industry institutions inherent in the cluster – authorities, universities, NGOs, etc. Thus, its narrow focus on trade does not allow taking into account the ‘untraded interdependencies’ (Storper, 1997) inherent to inter-organizational interactions of various stakeholders. In addition, the input-output tables are compiled for relatively aggregated industries, which does not allow the identification of highly specialized clusters. The possibility of identifying the cross-border is hampered by the very fact that the industries of the two regions belong to a single cluster. However, the results obtained within the framework of this analysis make it possible to identify anchor activities in a certain region.
Qualitative methods include the peer reviews (i.e. expert assessments) and the in-depth case studies. Expert evaluations, including its variations (for example, the snowball method), allows identifying and systematizing the data on clusters by using various techniques: focus groups, questionnaires, interviews of both outside experts and key representatives of cluster companies. The method allows obtaining detailed information about the studied objects, but has a number of shortcomings. These include lack of experts, subjective opinions, unstandardized, incomparable and limited data. The case studies, on the other hand, are among the most effective methods in studying the development of a particular cluster and predominantly applied for retrospective analysis of individual clusters. Generating the ‘genealogy’ of a cluster is a time-consuming process that requires hard-to-access specific economic and historical information. The subsequent comparative analysis is hampered by the individuality of each study, the subjectivity of both the information itself and its interpretation.
The methods reviewed reflect the ambiguity problem in identifying clusters in the modern geo-economic context. Formation of cross-border coastal clusters casts doubt on the alienation of resource-dependent and trade industries. The existing methods for identifying clusters at the regional level are more likely to be probabilistic, and therefore the question of their applicability in the context of the identification of cross-border coastal clusters seems to be an important methodological problem requiring comprehensive study with subsequent testing in the course of scientific research.
The cluster mapping is a complex objective, featuring a wide variety of mapping methods elaborated and electronic resources created that visualize vast databases on clustering indicators (e.g. www.clustermapping.us, www.clusterobservatory.eu, etc.). Mapping of cross-border clusters in the coastal zones has its own peculiarities, with a number of additional conditions imposed for applying the cluster to the map. Firstly, it is required to determine the importance of the cluster, its role and impact on the economy of the coastal region, as well as its place in the global economic system (i.e. as a node in a global value chain). The very definition of a cross-border cluster is not yet a guarantee of its significance on a global scale: some of the cross-border coastal clusters have only interregional significance, others have a global scale. In this case, the very measurement of the economic impact of the cluster is a separate task, as well as the subsequent division of them into levels of influence. Secondly, typologization of cross-border coastal clusters allocated. This objective involves undertaking a typology on a number of grounds: the localization of the cluster, its location relative to state boundaries, the presence and number of centers of economic activity of the cluster, the prevailing types of economic activity. Within the framework of this task, it is also possible to distribute clusters by the development stage, including the existence of formal associations of cluster members, etc. Thirdly, determination of the scale of the maps corresponding to the size and type of the clusters being depicted, which requires the allocation of the most significant types of clusters, as well as the generalization of information on the investigated structures at the micro level. Fourthly, the indicative cartographic model and cluster mapping. The information placed on the final map for sufficient informativeness should be transmitted through various cartographic images: icons, points, areas, quality background and, if possible, cartograms.
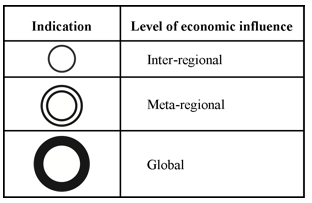
First of all, it is necessary to divide the identified clusters into groups, according to their level of economic influence. It is expedient to single out three levels of influence: inter-regional, meta-regional and global. The lower level of influence in this case is due to the very nature of the phenomenon being studied: the transborderity of clusters implies their localization in at least two different regions, thus cutting off clusters with a regional level of influence from the sample in question. The meta-regional level presupposes the spread of the economic influence of the cluster to a group of regions; the global one implies the important economic role of the cluster at the worldwide level. Graphically, this information can be displayed as follows (Figure 1).
Figure 1
Economic centers of cross-border coastal clusters
according to their level of economic influence
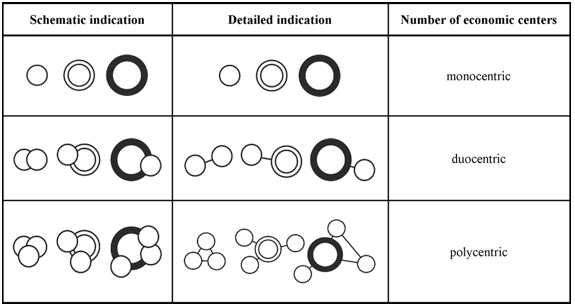
Often economic activity in clusters is concentrated in more than one economic center. The variety of clusters in this case is supposed to be divided into the following groups: monocentric (having one largest center of economic activity), duocentric (having two relatively equal centers of economic activity) and polycentric (having more than two relatively equivalent centers of economic activity or one large economic center, supplemented by several less significant ones). It is important to note that the mapping of several economic centers within the boundaries of one cluster can be either realistic or schematic, i.e. indicating the actual location of economic centers, or only the presence of such centers within the cluster. Obviously, the application of both approaches is justified under different conditions: large-scale maps allow for more detailed information, whereas small-scale maps can only show general information. In the event that the existing economic centers are displayed, additional information can also be transmitted through the connecting lines between economic centers: are there stable links between economic entities among the second-tier economic centers, or do they operate through interaction with the main economic center. The proposed method for displaying this characteristic is presented in figure 2.
Figure 2
The number of economic centers in the cross-border
coastal cluster and the existence of links in-between
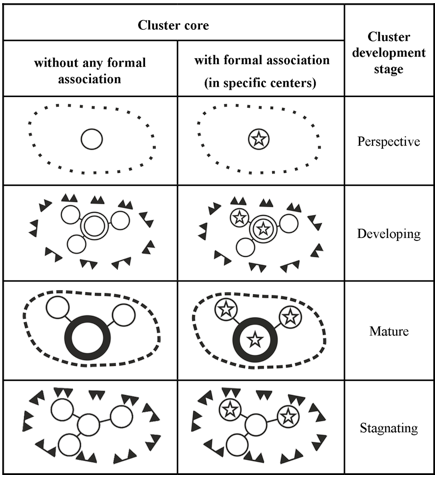
One of the most important cluster characteristic for displaying is the development stage. It is obvious that the influence of the developing and stagnating cluster on the surrounding territories will be different. Graphically, it is possible to display several stages of development of the investigated clusters: a perspective or emerging cluster – there is the most favorable combination of factors that creates a condition for the cross-border coastal cluster to be formed, a developing cluster – an active expansion in the number of economic entities involved in cluster activities, a developed or mature cluster – a large number of participants and sustainable value chains and business links represent a particular cluster, and a stagnating cluster – obsolescence of the technologies used, the relocation of production outside the cluster, reduction in output and decrease in the volume of services provided, etc. The core of the cluster can also contain information on the existence of a formal association of economic entities that contributes to the functioning of the cluster (figure 3).
Figure 3
The development of cross-border coastal cluster and the
presence of a formal association of economic agents
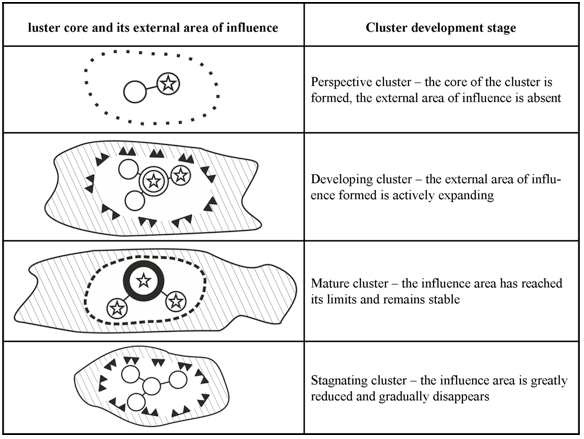
Another territorial feature is information on the main zone of influence of the cross-border coastal cluster: the nearest districts, regions or even larger territories, which is typical for the largest seaports in countries with significant remote areas such as Russia, China, etc. The allocation of such territories is often a difficult research task in itself and requires additional work, but when such results are obtained, mapping the external area of the clusters’ influence allows filling the map with an additional analytical component. It is clear that the allocation of such areas of influence relies primarily on statistical information; therefore, the use of contours of administrative-territorial division (second or third order depending on countries) is most likely to capture this feature (figure 4).
Figure 4
The cross-border coastal clusters’ external area of
influence depending on the cluster development stage
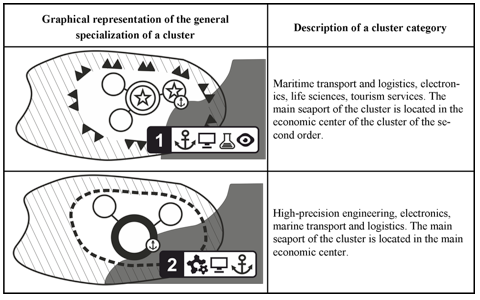
Despite the fact that the coastal geo-economic position in many respects predetermines the specialization of clusters, this characteristic is far from being unambiguous. In many cases, the coastal position only acts as a catalyst for the development of many sectors: from agriculture to engineering. At the same time, the main port, which is the main transport hub, is most often allocated within the cluster; the other economic centers of the cluster may have the widest range of specializations. To display the specialization of the cluster, one can resort to the common practice of mapping the specialization of each economic center of the cluster’s core separately, but in the case of clusters it is also possible to use the generalized element of the map – the summary panel of the cluster specialization icons. It is also possible to designate the main sea port or cluster ports (figure 5).
Figure 5
Examples of graphic representation of the general economic
specialization within cross-border coastal cluster
Along with the marked parameters for the cartographic visualization required for analytical research purposes, the typological form of a cluster is important. In cases when parts of a cluster are organized according to the principle of an extended technological chain with actors being located on different sides of the state border or the water area a vector designation of internal interrelations is applied (e.g. the cargo flows). A detailed map of a larger scale contains information on the most significant stages of the production and technological cycle, the localization of cluster entities involved in supply, primary and secondary processing, creation of production technologies, and distribution of final products. Since the entire volume of corresponding ‘movements’ along the value chain cannot be reflected on the map due to information overload, reflection of the most significant intra-cluster flows is to be implemented. Given the study focus on cross-border coastal clusters, these would be the transboundary linkages across the water area undertaken via water transport (figure 6). The detailed cartographic models of clusters enable to further distinguish three significantly different zones within the boundaries of its core: 1) cluster’s aquatic area, 2) zone of the most active trans-aquatic linkages on land, and 3) zone of the weakened trans-aquatic linkages.
Figure 6
The vector designation of an extended technological
chain within intra-cluster networking
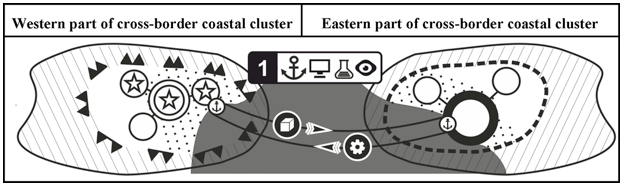
Note: first zone – part of water area bounded by the boundaries of the cluster; second zone – part of cluster’s core on land filled with point filling; third zone – remaining area of cluster’s core filled with solid white fill. Production supply – a vector link from the main port of the western core of the cluster to the main port of the eastern core of the cluster. Supply of machinery, equipment, and technological solutions – a vector link from the main port of the eastern core of the cluster to the main port of the western core of the cluster
Along with vector linkages, an interdependent cluster preserves the usual linear intra-cluster relationships. With that, the main marine flows can also have an additional designation on the nature of the products transported. The interrelated type of cluster networking is characterized by the least stable linkages, thus, being visualized by dotted lines (figure 7).
Figure 7
The cartographic modeling of an extended technological chain,
an interdependent and interrelated types of cluster networking
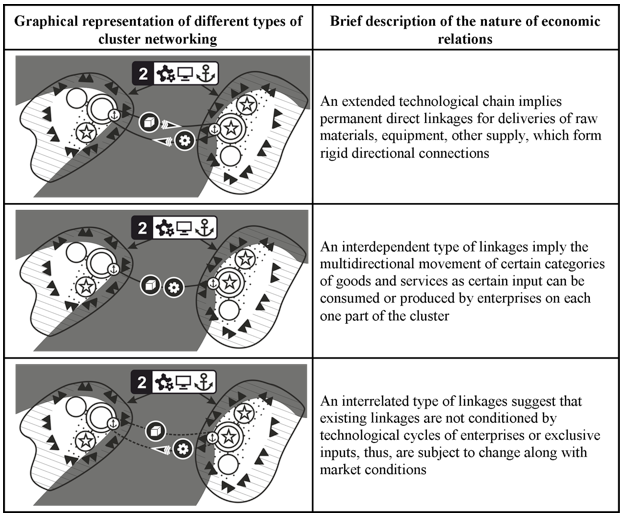
Figure 8 represent a hypothetical sea basin featuring three types of trans-aquatic cross-border coastal clusters, which are visualized at different stages of development and have different types of internal intra-cluster relations.
Figure 8
Cartographic scheme of trans-aquatic cross-border
coastal clusters of a hypothetical sea basin
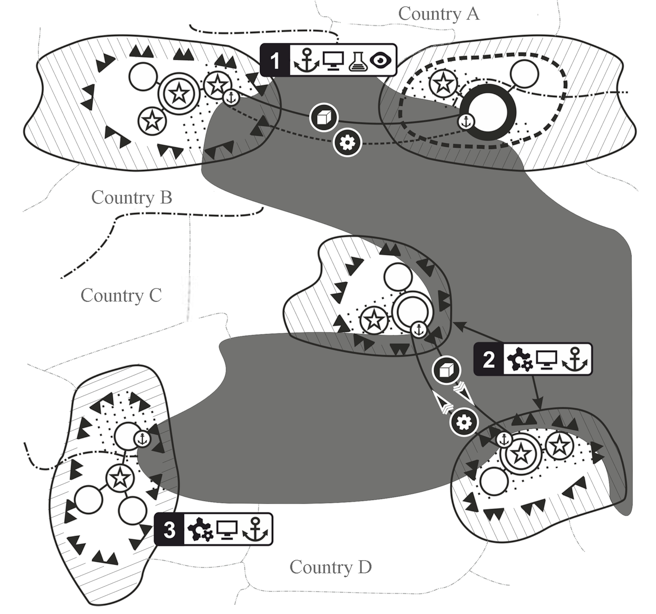
It is important to note that in a number of cases, cluster networking involves actors being spatially distant of the main cluster core, thus, their identification and mapping is challenging. Further identification of input-output flows can be one of the methods to involve them into the cartographic modeling process.
The described examples of cartographic mapping of various characteristics of cross-border coastal clusters make it possible to excel the cluster mapping techniques. If necessary, these tools can be supplemented with cardiograms, background data, localized diagrams and other visualization tools that allow placing additional information on the map.
Numerous factors affecting the origin and development of cross-border coastal clusters considered in the study form the main initial conditions for their identification and cartographic modeling. The visualization of cluster boundaries and its individual constituent elements largely depends on the approaches originally chosen for its mapping, which to some extent complicates the consolidation of information on clusters obtained from various sources. In describing individual clusters it is possible to envisage the collection of data necessary for subsequent mapping, whereas considering clusters on a continental scale is more complicated, as significant differences in clusters under study are taking place.
The process of cluster formation, which is rather uneven in the regions of initial detection and development of the cluster phenomenon – North America and Europe, has an even more heterogeneous pattern in Asia, which in turn complicates the global comparison of data. The emergence of clusters and the intensification of state policy in Asia is characteristic mainly for countries with more developed economies, but not limited to them. Inter-organizational networking also takes place between uneven developed countries, which include some countries of the former USSR, Mongolia, Bangladesh, Bhutan, Afghanistan and others. Although a significant differentiation in terms of the level of development of economies is a significant obstacle to the formation of cross-border clusters.
Berzi, M. (2017). The cross-border reterritorialization concept revisited: the territorialist approach applied to the case of Cerdanya on the French-Spanish border. European Planning Studies, 25(9), 1575-1596. doi: 10.1080/09654313.2017.1321622
Bezrukov, L.A. (2008). Continental-oceanic dichotomy in international and regional development. Novosibirsk: Academic publishing house "Geo".
Collet, I., and Engelbert, A. (2013). Coastal regions. People living along the coastline, integration of NUTS 2010 and latest population grid. Eurostat. Statistics in focus, 30, 2–12.
Crowell, M., Edelman, S., Coulton, K., and Mcafee, S. (2007). How Many People Live in Coastal Areas? Journal of Coastal Research, 23(5), 3-6. doi:10.2112/07a-0017.1
Delgado, M., Porter, M. E., and Stern, S. (2014). Defining Clusters of Related Industries. Working Paper, 20375. Cambridge: National Bureau of Economic Research (NBER). Available at: http://www.nber.org/papers/w20375 (accessed June 2017)
Dokoupil, J. (2000). Theoretical approaches to the problems of borderland with application in the Czech-Bavarian space. Geografie-Sbornik CGS, 105(1), 10-18.
Espon Atlas (2014). Land-sea interaction. Available at: http://atlas.espon.eu (accessed June 2017)
Fedorov G.M., Mikhaylov A.S., Kuznetsova T.Yu. (2017). The influence of the sea on the economic development and settlement structure in the Baltic Sea region. Baltiс Region, 9(2), 4–18.
Gogoberidze, G.G., and Mamaeva, M.A. (2012). Strategic opportunities for economic development of the Baltic Sea coastal zones and sea industrial and port complexes. Baltic region, 1, 98–109.
Halás, M. (2007). Development of cross-border cooperation and creation of Euroregions in the Slovak Republic. Moravian Geographical Reports, 15(1), 21-31.
Hydrologic Unit Maps (2017). Available at: http://water.usgs.gov/GIS/huc.html (accessed June 2017)
Karsli, F., Guneroglu, A., and Dihkan, M. (2011). Spatio-temporal shoreline changes along the southern Black Sea coastal zone. Journal of Applied Remote Sensing, 5(1), 053545. doi: 10.1117/1.3624520
Ketels, C., and Protsiv, S. (2013). Clusters and the New Growth Path for Europe. Research paper on the role of clusters for the new. Working Paper, 14. Available at: http://www.foreurope.eu/fileadmin/documents/pdf/Workingpapers/WWWforEurope_WPS_no014_MS47.pdf (accessed June 2017)
Medeiros, E. (2014). Barrier effect and cross-border cooperation. The Sweden-Norway interreg- A territorial effects. Finisterra, 49(97), 89-102. doi:10.18055/finis4198
Mikhaylov, A.S., Mikhaylova, A.A. (2014). Spatial and sectoral distribution of international clusters in the Baltic region. European Journal of Scientific Research, 121(2), 122-137.
NOAA GeoPlatform (2017). The Oceans and Coasts - A Driver for Inland Economic Activity. Available at: http://noaa.maps.arcgis.com/apps/MapJournal/?appid=639339405df9482ea2a907038fa75eb0 (accessed June 2017)
Rieber, A.J. (2015). Struggle over the borderlands. Kritika, 16(4), 951-959. doi: 10.1353/kri.2015.0066
Savitskiy, P.N. (1997). Continent of Eurasia. Moscow: Agraf.
Setnikar-Cankar, S., Seljak, J., and Petkovšek, V. (2013). Cross-border cooperation as a way of overcoming the global financial and economic crisis. Lex Localis, 11(3), 513-530. doi: 10.4335/11.3.513-530
Storper, M. (1997). The regional world. Territorial development in a global economy. New York, London: Guilford Press.
Taubmann, W. (2001). Economic growth and regional disparities in the People's Republic of China. Geographische Rundschau, 53(10), 10-17.
Vivero, J.L.S., and Mateos, J.C.R. (2012). The Spanish approach to marine spatial planning. Marine Strategy Framework Directivevs. EU Integrated Maritime Policy. Marine Policy, 36(1), 18–27. doi:10.1016/j.marpol.2011.03.002
Walerud, С., and Viachka, A. (2007). Transnational networks of cluster organisations. Stockholm: Stockholm School of Economics.
Wei, Y. (1998). Economic reforms and regional development in coastal China. Journal of Contemporary Asia, 28(4), 498-517. doi: 10.1080/00472339880000271
Won, B.K. (2012). The rise of Coastal China and inter-regional relations among core economic regions of East Asia. The Annals of Regional Science, 48(1), 283–299. doi:10.1007/s00168-010-0389-1
The study is financed by the Russian Science Foundation (RSF), project No. 15-18-10000 “Cross-border clustering within the dynamics of economic and residential systems in the coastal areas of European Russia”.
1. V.B. Sochava Institute of Geography, Siberian Branch of the Russian Academy of Science, Irkutsk, Russian Federation. Research fellow. Contact e-mail: igordets@ya.ru
2. Immanuel Kant Baltic Federal University, Kaliningrad, Russian Federation. Research fellow. Contact e-mail: mkhailov.andrey@yahoo.com
3. Southern Federal University, North-Caucasian research institute of economic and social problems, Rostov-on-Don, Russian Federation. Research fellow. Contact e-mail: tunduk@hotmail.com