![]() ISSN 0798 1015
ISSN 0798 1015

![]() ISSN 0798 1015
ISSN 0798 1015
Vol. 38 (Nº 52) Year 2017. Page 29
Assel Valithanovna KHAMZAYEVA 1; Raushan Elemesovich ELEMESOV 2; Aida Menlibayevna MYRZAKHMETOVA 3; Saltanat Tamerlanovna ZHAKUPOVA 4
Received: 25/10/2017 • Approved: 30/10/2017
3. The Monetary Policy of Russia
4. The Monetary Policy of Kazakhstan
5. The Monetary Policy of Azerbaijan
ABSTRACT: This article studies the impact of changes in prices of commodity markets on exchange rate dynamics in the CIS oil-exporting countries, namely Russia, Kazakhstan, and Azerbaijan. The article analyzes GDP growth and inflation rates, foreign exchange reserves as well as the monetary and credit policy of these countries. Despite the leading positions of Russia, Kazakhstan and Azerbaijan in the region, under the influence of falling oil prices as well as the adoption of sanctions against Russia, economic growth in these countries has slowed significantly. There is a sharp drop in budget revenues, a decrease in the standard of living of the population, and a reduction in domestic demand. The reactions of the national currency exchange rates of these oil exporters to the impact of external shocks are similar; however, when assessing their currency policies and other economic parameters, one can reveal significant differences between them. The article also analyzes the measures and actions taken by the governments of Russia, Kazakhstan and Azerbaijan to improve the monetary policy of these countries and strengthen their national currency. |
RESUMEN: Este artículo estudia el impacto de los cambios en los precios de los mercados de productos básicos sobre la dinámica de los tipos de cambio en los países exportadores de petróleo de la CEI, a saber, Rusia, Kazajstán y Azerbaiyán. El artículo analiza el crecimiento del PIB y las tasas de inflación, las reservas de divisas, así como la política monetaria y crediticia de estos países. A pesar de las posiciones líderes de Rusia, Kazajstán y Azerbaiyán en la región, bajo la influencia de la caída de los precios del petróleo, así como la adopción de sanciones contra Rusia, el crecimiento económico en estos países se ha ralentizado significativamente. Hay una marcada caída de los ingresos presupuestarios, una disminución del nivel de vida de la población y una reducción de la demanda interna. Las reacciones de los tipos de cambio de divisas nacionales de estos exportadores de petróleo al impacto de las sacudidas externas son similares; sin embargo, cuando se evalúan sus políticas monetarias y otros parámetros económicos, se pueden revelar diferencias significativas entre ellos. El artículo también analiza las medidas y acciones tomadas por los gobiernos de Rusia, Kazajstán y Azerbaiyán para mejorar la política monetaria de estos países y fortalecer su moneda nacional. |

Integration and globalization of the global economy have revealed a strong interconnection and interdependence of the economies of the world. The fall in world oil prices has led to deterioration in the economies of oil-exporting countries. Countries where the main activity is oil and gas production receive income from the export of oil and gas in foreign currency, and this is the main source of their economic development. Consequently, there is a correlation between world oil prices and the economy of such countries, which is reflected in the value of national currencies against the US dollar through the inflow of foreign currency into the economy.
As the price in world commodity markets is denominated in US dollars, according to the 1944 Bretton Woods Agreement, the national currencies of oil and gas export-oriented countries are tied to the US dollar.
The relationship between world oil prices and the US dollar exchange rate against the national currencies of oil-exporting countries was explored by Canadian economists A. Yousefi and T. S. Wirjanto (2003). Their study is based on the trade balances of three OPEC member countries (the Organization of the Petroleum Exporting Countries), namely Iran, Venezuela and Saudi Arabia. The results reveal that while the OPEC countries reduce oil production, decreasing oil supply rates in the market, and thereby raising oil prices, the value of the US dollar depreciates relative to the national currencies of the OPEC member states.
American economists R. A. Lizardo and A. V. Mollick (2010) investigated the impact of oil price fluctuations on the value of the US dollar against the national currencies of Canada, Mexico, and Russia. The results of their study show that “increases in real oil prices lead to a significant depreciation of the USD against net oil exporter currencies”.
The works of Canadian and American economists consider the national currencies of the largest oil-producing countries and OPEC member countries. These countries have leverage to affect the change in oil prices by increasing or decreasing the volume of oil production, and thereby regulate the amount of the US dollar flows into the economies of their countries, which is reflected in the exchange rate of their national currencies.
This article analyzes the impact of changes in prices of commodity markets on exchange rate dynamics in the CIS oil-exporting countries as well as the monetary and credit policy of these countries.
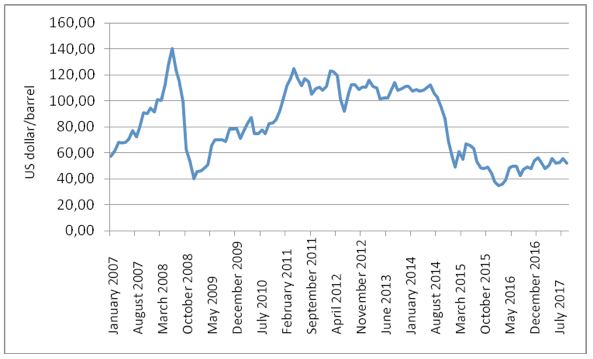
The CIS (the Commonwealth of Independent States) is the largest participant in world energy markets. Russia, Kazakhstan and Azerbaijan are the three largest oil-producing countries in the CIS. They account for about 13%-14% of world oil supplies and 95% of oil production in this region. Oil acts as the main export product of these countries. In 2016, the share of the oil and gas sector in the income of the budget of Russia was 36% (Russia: production and export of oil and gas for 2016, 2017), Kazakhstan – 50% (S&P does not predict GDP growth in Kazakhstan in 2016, 2016), Azerbaijan – 60-70% (Mamyshev, 2017). Under these conditions, there is a close relationship between oil price dynamics and the exchange rate, which makes the Russian ruble, the Kazakhstani tenge and the Azerbaijani manat dependent on factors, most of which are not controlled by the Central Banks and governments. The dynamics of world prices for Brent crude oil and the reasons for their changes is revealed in Figure 1.
Figure 1
Oil price dynamics
Note. Compiled by the authors based on data from:
https://www.calc.ru/dinamika-Brent.html?date=2017
One of the factors aggravating the world economic crisis was a drastic change in oil prices in the world market in the second half of 2008. The price of oil in the summer of 2008, reaching $145.7 per barrel, fell to $37.9 in the last weeks of 2008, showing a decrease of $110 compared to the summer price (The dynamics of oil prices since 1990. Dossier, 2014). All measures related to the reduction of oil production and undertaken to stabilize the cost of oil turned out to be ineffective, and the price of oil continued to fall. The main reason for the sharp fall in oil prices was a reduction in oil demand due to a slowdown in economic growth rates in various countries.
Since June 2009, the price of Brent started to grow slowly. If from 2012 to June 2014 the price of oil was in the range of $100-$115, on October 9, the price of Brent crude oil fell below the level of $90 per barrel. Then it became known that Iran and Saudi Arabia reduced oil prices on export contracts. The fall in prices continued after in the next report on October 14, the IEA worsened the forecast for oil demand to 92.4 million barrels per day in 2014, and to 93.25 million barrels – in 2015 (International Energy Agency). Another important factor was the unpreparedness of the OPEC countries to agree on a reduction in oil production.
By the end of December 2014, the price of oil fell to $56.5, reaching its lowest level in the spring of 2009. It is worth noting the increase in oil production volumes. The volume of oil produced was a record in the US in 2014 – 8.7 million barrels per day. Since 2008, the US has evolved from a net oil importer into a net exporter. This was due to the development of shale deposits, which produced a real revolution in the market.
However, by 2017 there was an increase in investment in shale oil, as the fields developed with the help of new technologies were rapidly depleted. In addition, "shale" hydrocarbons have a rather high production cost – in the range of $45-50, which means that extremely low world prices are fatal for this type of production.
For the first half of January 2015, the price of oil fell from $55.27 to $45.13 per barrel, but by mid-February, it amounted to $60 and remained stable throughout the first half of the year at $55-$60 per barrel. In mid-July, the price of oil continued to decrease, reaching $35.98 per barrel by December 23 [7]. Thus, for 2015 the average annual prices of Brent crude oil decreased by 47%. This was due to the crisis in the Chinese stock market, Iran’s plans to increase oil exports after the lifting of sanctions, as well as the fact that the US continues to put new production capacities into operation. On December 4, 2015, the OPEC countries again refused to reduce quotas for oil production.
In 2016, the price of oil continued to decrease, reaching $27.5 per barrel of Brent oil for the first time since 2003. After long negotiations, on November 30, 2016, the OPEC oil producers agreed to cut their production by 1.2 million barrels per day to 32.5 million barrels. Later, the non-OPEC oil producers agreed to reduce their production by 558,000 barrels per day, including Russia – by 300,000 barrels. This agreement was concluded for the first half of 2017 with the possibility of extension. As a result, at the end of December 2016 in comparison with December 2015, the price of Brent crude oil rose to $56.14 per barrel. In August 2017, oil prices were $52.1.
Significant oil price fluctuations have created certain inconveniences for countries that produce and export oil and oil products. The “staple trap” gives the country a steady growth at high world prices, but makes the economy very vulnerable at low world prices. The state budget of most oil-exporting countries is highly dependent on oil export revenues. If the volume of oil exports decreases, the budget becomes scarce, and this situation creates other problems for the country’s economy. A deficit in the state budget may lead to a reduction in state budget expenditures, an increase in the tax burden (which will lead to a reduction in investment and consumption), or an increase in public debt.
Thus, in the period of high oil prices, the export and resource-based orientation of the economies of Kazakhstan, Russia, and Azerbaijan has led to intensive economic growth. Increasing revenues from oil exports have ensured the stability of the fiscal sector. However, the rise in prices of exported oil leads to a strengthening of the real exchange rate and an increase in exports, which results in the budget surplus. Strengthening the exchange rate and the budget surplus can cause "Dutch disease" effects. The "Dutch disease" suggests that the priority is given to the development of the resource sector at the expense of production, which has a negative impact on the country’s economic development (Sterkin and Papchenkova, 2013). As a result, traditional – non-resource – industries shut down, which increases the unemployment rate in the country. The "resource curse" is an objective reality for the countries considered, as in these countries there is clearly a significant structural superiority of the extractive industry over other sectors of the economy.
A sharp collapse in prices in the world oil market in 2008, 2014, 2015 coincides with the financial crises and devaluation processes in the countries considered. In addition, according to Bloomberg’s analysis, the weakest and most seriously depreciating currencies in the world, relative to the US dollar, in 2015 were the Russian ruble, the Kazakhstani tenge and the Azerbaijani manat. In 2015, the tenge depreciated by 46.5%, the manat – by 49.9%, and the ruble – by 20.3% (Korshunova, 2016).
Therefore, the ensuing wave of devaluations confirmed the crisis phenomena in the region. Devaluation is seen as an instrument of central banks to manage the national currency. This is a reduction in the real exchange rate of the national currency, dictated by economic policy, in relation to hard currencies in systems with a fixed exchange rate.
Despite the leading positions of Russia, Kazakhstan and Azerbaijan in the region, under the influence of falling oil prices as well as the adoption of sanctions against Russia, economic growth in these countries has slowed significantly. There is a sharp drop in budget revenues, a decrease in the standard of living of the population, and a reduction in domestic demand. In addition, high dollarization, a significant level of inflation expectations, a weakly developed financial sector, the existence of a shadow economy, dependence on remittances of labor migrants, weak economic diversification, and dependence on external price shocks impede the implementation of an effective monetary policy in these countries. The reactions of the national currency exchange rates of these oil exporters to the impact of external shocks are similar, however, when assessing other economic parameters and their currency policies, one can reveal significant differences between them.
The fall in prices of hydrocarbons led to the fact that the GDP of the economies of Russia, Kazakhstan and Azerbaijan fell more than that of other countries in the region in dollar terms. The GDP of the countries considered is shown in Table 1.
Table 1
GDP of Russia, Kazakhstan and Azerbaijan
|
Russia |
Kazakhstan |
Azerbaijan |
|||
Year |
Value, US dollar billion |
Change, % |
Value, US dollar billion |
Change, % |
Value, US dollar billion |
Change, % |
2005 |
820,57 |
|
57,13 |
|
13,27 |
|
2006 |
1 063,64 |
29,62% |
81,00 |
41,80% |
21,03 |
58,42% |
2007 |
1 396,48 |
31,29% |
104,85 |
29,44% |
33,09 |
57,37% |
2008 |
1 784,51 |
27,79% |
133,44 |
27,27% |
46,38 |
40,16% |
2009 |
1 313,68 |
-26,38% |
115,31 |
-13,59% |
44,29 |
-4,50% |
2010 |
1 638,46 |
24,72% |
148,05 |
28,39% |
52,91 |
19,47% |
2011 |
2 031,77 |
24,00% |
192,63 |
30,11% |
64,82 |
22,50% |
2012 |
2 170,15 |
6,81% |
208,00 |
7,98% |
68,70 |
5,99% |
2013 |
2 230,62 |
2,79% |
236,64 |
13,77% |
73,56 |
7,07% |
2014 |
2 063,66 |
-7,48% |
221,42 |
-6,43% |
75,19 |
2,23% |
2015 |
1 365,87 |
-33,81% |
184,39 |
-16,72% |
50,82 |
-32,42% |
2016 |
1 280,73 |
-6,23% |
133,76 |
-27,46% |
37,56 |
-26,10% |
Note. Compiled by the authors based on data from: https://knoema.ru/atlas
High GDP growth coincided with high export growth rates and vice versa. The size of the GDP of Russia and Kazakhstan suggests greater resistance to external shocks compared with Azerbaijan. In addition, the share of the oil and gas sector in Azerbaijan's GDP is rather high – 40%, while in Kazakhstan it does not exceed 25%. About 90% of Azerbaijan’s exports account for the black gold (The oil sector of the CIS: the impact on the economy and sovereign ratings, 2005). The crisis phenomena of these countries are also confirmed by the level of inflation (Table 2).
Table 2. Inflation in Russia, Kazakhstan and Azerbaijan
Year |
Russia, % |
Kazakhstan, % |
Azerbaijan, % |
2006 |
9.7 |
8.6 |
8.4 |
2007 |
9.0 |
10.8 |
16.6 |
2008 |
14.1 |
17.2 |
20.8 |
2009 |
11.7 |
7.4 |
1.5 |
2010 |
6.9 |
7.1 |
5.7 |
2011 |
8.4 |
8.3 |
8.1 |
2012 |
5.1 |
5.1 |
1.1 |
2013 |
6.8 |
5.8 |
2.5 |
2014 |
7.8 |
6.6 |
1.5 |
2015 |
15.5 |
6.7 |
4.1 |
2016 |
7.2 |
14.6 |
11.3 |
Note. Compiled by the authors based on data from CIA World Factbook (CIA World Factbook)
Part of currency reserves in the countries considered is concentrated in special funds: SOFAZ (the State Oil Fund of the Republic of Azerbaijan) in Azerbaijan, the National Fund in Kazakhstan, and the Reserve Fund and the National Welfare Fund in Russia. The share of these funds in the total volume of foreign exchange reserves is as follows: in Russia – 23.3%, in Kazakhstan – 67.2%, in Azerbaijan – 89.4% (as of November 2016).
The availability of significant reserve funds in Kazakhstan, Russia and Azerbaijan contributed to their temporary isolation from the crisis phenomena. The reduction in reserves reflects the entire range of problems faced by oil-producing states, including a decrease in their impact on the world arena and the need for economic diversification in a short time – before liquidity reserves run out. The foreign exchange reserves of the countries considered are shown in Table 3.
Table 3
Foreign exchange reserves of Russia, Kazakhstan and Azerbaijan
|
Russia |
Kazakhstan |
Azerbaijan |
|||
Year |
Value, US dollar |
Change, % |
Value, US dollar |
Change, % |
Value, US dollar |
Change, % |
2005 |
182 272 104 532 |
|
7 069 707 377 |
|
1 177 743 707 |
|
2006 |
303 773 185 537 |
66,66 |
19 127 059 970 |
170,55 |
2 500 372 937 |
112,30 |
2007 |
478 822 286 568 |
57,62 |
17 641 023 631 |
-7,77 |
4 273 114 894 |
70,90 |
2008 |
426 278 774 010 |
-10,97 |
19 883 105 672 |
12,71 |
6 467 239 212 |
51,35 |
2009 |
439 341 751 138 |
3,06 |
23 183 086 320 |
16,60 |
5 363 850 274 |
-17,06 |
2010 |
479 222 291 459 |
9,08 |
28 264 707 689 |
21,92 |
6 409 059 001 |
19,49 |
2011 |
497 410 247 573 |
3,80 |
29 215 277 000 |
3,36 |
10 273 926 427 |
60,30 |
2012 |
537 816 373 775 |
8,12 |
28 299 368 260 |
-3,14 |
11 277 345 766 |
9,77 |
2013 |
509 692 081 493 |
-5,23 |
24 691 645 608 |
-12,75 |
15 175 667 852 |
34,57 |
2014 |
386 216 377 125 |
-24,23 |
29 250 312 400 |
18,46 |
15 816 417 366 |
4,22 |
2015 |
368 042 945901 |
-4,71 |
27 854 795 608 |
-4,77 |
7 319 394 023 |
-53,72 |
2016 |
377 052 191 856 |
2,45 |
29 422 575 950 |
5,63 |
6 573 862 633 |
-10,19 |
Note. Compiled by the authors based
on data from: https://knoema.ru/atlas/
In 2016, there was a significant decline in the foreign exchange reserves of Russia, Kazakhstan and Azerbaijan. The slight increase in the foreign exchange reserves of Kazakhstan in 2016 was mainly due to the fact that the National Bank acted as a net buyer in the foreign exchange market. In addition, they were partly increased due to the operations on the conversion of assets of the National Fund. In general, the buildup of reserves was hardly the aim of the regulator. Rather, on the contrary, it indirectly indicates that the National Bank sought to prevent a sharp strengthening of the national currency and, for this purpose, bought up the currency on the exchange.
Consider the monetary policy of Russia, Kazakhstan and Azerbaijan during this period.
In 2008, the system of a managed floating exchange rate regime, consisting of a bi-currency basket (dollar and euro), and foreign exchange policy, aimed at free cross-border capital flows, prevailed in Russia.
The exchange rate was regulated through foreign exchange interventions. On November 11, 2008, the Bank of Russia began to implement a full-scale adjustment of the technical limits of allowable fluctuations in the value of the bi-currency basket. The parameters were set daily taking into account the current dynamics of the balance of payments, the real effective rate and international reserves. The central bank conducted a phased devaluation: first, the basket for one trading day was allowed to be depreciated by no more than 1%, then – no more than 1.5%. To mitigate the depreciation of the ruble, the Bank of Russia daily spent $2.5-2.8 billion. Such correction of the limits of allowable fluctuations of the bi-currency basket was called "managed devaluation". In total, $185 billion were spent on the implementation of the "managed devaluation" of reserves (Lebedeva et al., 2016).
Before the final stabilization of oil prices, the Bank of Russia decided on January 23, 2009 to announce the introduction of limits for the depreciation of the bi-currency basket: 41 rubles and 26 rubles for the bi-currency basket. In fact, this meant the introduction of a broad horizontal currency corridor. At the time of the announcement of the upper boundary, the gap between the current value of the basket and the upper boundary was 3.8 rubles (Golodova and Ranchinskaya, 2014). The Bank of Russia stopped interventions, allowing the ruble exchange rate to independently reach the permissible level. The stabilization of exchange rate expectations after the completion of "managed devaluation" ensured a decrease in demand for currency and tensions in currency and money markets.
After the devaluation in February 2009, the Bank of Russia introduced a new intervention mechanism – the floating operating corridor for cost of the intraday bi-currency basket. The daily range of allowable fluctuations was set for the basket. Its parameters were adjusted depending on the volume of interventions of the Bank of Russia. The width of the corridor was originally 2 rubles, in July 2009 it was increased to 3 rubles, and in October 2010 – to 4 rubles.
Gradually, the Bank of Russia increased the flexibility of the exchange rate, weakening its control over the bi-currency basket. This was expressed in the expansion of the floating corridor and in the reduction of the limiting value of accumulated interventions, the achievement of which led to a shift in the corridor boundaries. Thus, the Bank of Russia planned to ensure the flexibility of the ruble exchange rate, bringing it closer to the floating exchange rate regime. Since 2012, the bi-currency basket was "floating", its value was in the middle of a wide corridor (in the "neutral" range), and boundary interventions were not conducted. Since October 2013, the volume of interventions aimed at smoothing exchange rate fluctuations began to increase or decrease by the value of operations carried out by the Federal Treasury, respectively, to replenish or expend sovereign funds of the government. Thus, the Bank of Russia began to reflect symmetrically the government's operations in the market. In addition, the Central Bank continued to increase the flexibility of exchange rates, creating conditions for increasing the effectiveness of its interest rate policy. This was necessary in connection with the preparation of the transition to inflation targeting, planned for 2015.
Inflation targeting involves the floating exchange rate of the national currency. The transition to inflation targeting was planned by the Bank of Russia for several years, during which the interest rate policy instruments were developed and the flexibility of the exchange rate was increased. However, the transition to the floating ruble exchange rate occurred in 2014. The regime of the floating corridor created two serious conflicts in the policy of the Bank of Russia. First, the unfavorable external economic environment contributed to the depreciation of the ruble. The Bank of Russia was forced to restrain the depreciation of the ruble, often acting in the market as the only seller of foreign currency. Given that the limits of the reduction in the price of oil were unknown, the Bank of Russia spent unproductively reserves, which could be in demand in the future to pay off foreign debt or finance other mandatory costs. Second, interventions in support of the ruble led to the withdrawal of ruble liquidity from the banking sector. Following the policy of sterilization interventions, the Bank of Russia compensated for the reduction in ruble liquidity by refinancing operations.
The Bank of Russia experimented for some time with new intervention techniques. In October 2014, the Bank of Russia moved the currency corridor and conducted permanent interventions in an unlimited amount. However, this led to the loss of a significant part of reserves in a short period of time. Then in November, the Bank of Russia limited the amount of boundary interventions amounting to no more than $350 million per day. The ruble rate continued to fall, and, for maintaining reserves and with regard to the inevitability of ruble devaluation until the stabilization of oil prices, the Bank of Russia decided to abolish the corridor for the basket from November 10, 2014 and proceed to the floating exchange rate. In place of the bi-currency basket, the interbank interest rate RUONIA was chosen as the operational benchmark for monetary policy, which should be kept within the corridor in the monetary market by the interest rate policy instruments of the Bank of Russia.
The new exchange rate regime was designed to help the economy adapt to external shocks. At the same time, the floating exchange rate did not imply the Bank of Russia's refusal to intervene. The possibility of holding interventions was maintained in the event of threats to financial stability.
In 2015, the Bank of Russia for the first time introduced interventions to replenish foreign exchange reserves. Taking advantage of stabilization in the foreign exchange market and temporary strengthening of the ruble, the Central Bank bought foreign currency from May to July 2015 in the domestic market. Interventions were not intended to influence the ruble exchange rate. They were conducted in small amounts of $100-200 million evenly throughout the day. Their magnitude was insufficient to reduce the volatility of the exchange rate and, the more so, change the direction of its movement. At the same time, within a long period of interventions, their total volume during the year could reach $25-50 billion, which is significant enough for the money supply and the balance of payments [12]. According to the Bank of Russia, it was planned to conduct interventions to increase reserves, until the volume of reserves grew to $500 billion. In the absence of other interventions, the target amount of reserves could be reached after three to six years. In the event of changes in the foreign exchange market, the amount of interventions should be adjusted in an unfavorable manner. This situation arose in July 2015, when there was a stable trend of the depreciation of the ruble. Having bought $10.1 billion from May to July 2015, the Bank of Russia was forced to stop replenishing its reserves until better circumstances arose.
The beginning of 2016 also was negative for the Russian currency – the dollar and euro exchange rates to the ruble continued to rise against the backdrop of falling oil quotations to $30 per barrel. The adoption of additional sanctions in 2017 also has an adverse effect on the exchange rate of the ruble.
In Kazakhstan, to support the economy of the country, after the introduction of the national currency, several devaluation processes were carried out. It should be noted that the process of devaluation in Kazakhstan has dragged on – the tenge is getting cheaper almost continuously to this day. Consider significant devaluations in Kazakhstan.
The first devaluation was on April 4, 1999, when the tenge depreciated by 64.6%. The reasons were as follows:
• Asian financial crisis;
• Russia’s default in in 1998;
• reduction of foreign exchange reserves;
• negative balance of payments of the country.
As a result of global changes in world financial markets, there was a significant devaluation of the national currencies of a number of countries – Kazakhstan’s trading partners. This led to a drop in the price of the tenge in real terms and contributed to a decrease in the competitive positions of Kazakhstan's exports.
In addition, the stereotype mechanical transfer of the assessment of the situation in Russia to Kazakhstan at that time caused an excessive demand for foreign currency in the domestic foreign exchange market. Large currency interventions led to a significant decline in gross foreign exchange reserves. To prevent further reduction of foreign exchange reserves and restore the competitiveness of the tenge, there was a need for the devaluation of the tenge.
One of the important factors was the time of initiation of the devaluation process. Its immediate implementation in the context of unstable financial markets in the CIS and significant devaluation expectations within the country would not have the expected effect. Any exchange rate parity established as a result of devaluation under such conditions would quickly lose its balance.
To select a new exchange rate regime, possible scenarios for the further development of the external economic situation, especially in Russia, were analyzed. The advantages and disadvantages of each option were evaluated in terms of the expected levels of the tenge equilibrium exchange rate, the balance of payments, foreign exchange reserves, the budget deficit, each segment of the financial market and social indicators.
The most acceptable was the free floating tenge exchange rate regime. It was introduced in April 1999, when the financial situation in Russia stabilized and devaluation expectations within the country decreased. As a result of the adopted measures, the transition to a new exchange rate policy stabilized within a few days. Bank operations in the interbank market did not stop. Another important factor was the fact that unlike in Russia, before changes in the economic regime were made, the banking system in Kazakhstan had a better loan portfolio, and its foreign currency liabilities corresponded to foreign currency assets. In addition, Kazakhstan’s banks did not participate in risky forward foreign exchange operations.
The second devaluation occurred on February 4, 2009. The tenge depreciated by 22.5%. The National Bank named three main reasons for the devaluation of the tenge in 2009:
• Reduction of oil prices more than three times.
• Devaluation of the national currencies of Kazakhstan’s trading partners and countries, whose economy depends on the export of raw materials. According to the National Bank, over the period from early 2008 to January 2009, the devaluation of national currencies against the US dollar was 44% in Russia, 28% in Belarus, 53% in Ukraine, 38% in the UK, 13% in the euro zone, 28% in Norway, 31% in Brazil, 27% in Australia, and 26% in Canada.
• The need to preserve the foreign exchange reserves of the National Bank.
Referring to the 1999 devaluation experience, the National Bank emphasized that other methods of supporting the national industry, besides the devaluation of the tenge, are ineffective.
The National Bank established a new tenge exchange rate corridor at 150 tenge per US dollar +/-3%, instead of the previous implicit corridor at 120 tenge per US dollar +/-2%. The simultaneous change in the exchange rate made it possible to significantly reduce devaluation expectations, improve the balance of payments, and preserve the foreign exchange reserves of the National Bank. In 2009, the National Bank took additional measures to ensure stability in the financial market. Measures were taken to provide short-term tenge liquidity to banks, as well as to improve the refinancing system of banks by the National Bank.
On February 5, 2010, the National Bank expanded the corridor for tenge exchange rate fluctuations to create conditions for increasing exchange rate flexibility: 150 tenge per US dollar (+)10% or 15 tenge, (-)15% or 22.5 tenge. This corridor was established until March 20, 2011 (Annual report of the National Bank of the Republic of Kazakhstan for 2010).
In 2011, the National Bank moved to the managed floating exchange rate regime. The National Bank pursued a policy aimed at ensuring the stability of the national currency and maintaining a favorable competitive environment for domestic producers.
The third devaluation occurred on February 11, 2014, when the tenge depreciated by 19%. The reasons were as follows:
• withdrawal of funds by developed countries from the economies of developing countries, which resulted in the appreciation of the euro and the US dollar against many currencies of the CIS countries;
• weakening of the Russian ruble;
• growth in imports of consumer goods; for example, in the total volume of imports to Kazakhstan, Russian goods accounted for 36.2%, while exports of Kazakh goods to Russia amounted to more than three times less than this amount;
• diversion of monetary funds by Kazakhstan’s banks from lending in favor of currency speculation.
The National Bank established a new corridor for exchange rate fluctuations in relation to the US dollar from the new level of 185 tenge per US dollar +/-3 tenge. Earlier the rate was 155.5 tenge per US dollar (Annual report of the National Bank of the Republic of Kazakhstan for 2014).
The fourth devaluation occurred on August 20, 2015. The reasons were as follows:
• uncertainty about the exchange rate of the Russian ruble and the trend of weakening its exchange rate against the US dollar;
• state of Kazakhstan’s solvent balance;
• high devaluation expectations in the economy of Kazakhstan as well as an increase in speculative operations caused by these expectations.
According to the World Bank, the National Bank of the Republic of Kazakhstan spent only $17 billion on maintaining the national currency. On August 19, the tenge declined to 188.35 per US dollar, on August 20, the National Bank canceled the currency corridor, announcing the transition to a free floating rate and an inflation targeting regime (Annual report of the National Bank of the Republic of Kazakhstan for 2015). The exchange rate is formed on the basis of market demand and supply. At the same time, the National Bank does not interfere in regulation, but reserves the opportunity to conduct currency interventions, if the situation threatens to destabilize the financial system. The weakening of the tenge made it possible not to cut the expenditure part of the Kazakh budget, which means that the financing of social programs and payments as well as the number of infrastructure projects did not decrease.
The formation of a market exchange rate without the government’s participation creates prerequisites for restoring economic growth, increasing credit and investment activity, creating new jobs and reducing inflation.
Analyze the advantages and disadvantages of the devaluation of August 2015.
The disadvantages of this devaluation are as follows:
1. Devaluation expectations on the part of the population lead to a depreciation of the national currency, so far more dollars are bought than are sold.
2. Losses of Kazakh investors have already been estimated at about 1/5 of the total volume of bank deposits of individuals equal to 1,260 trillion tenge.
3. Devaluation inevitably leads to an increase in prices for imported raw materials, finished products and consumer goods; importers shift costs to the price of finished goods or imported goods.
4. Losses of depositaries with bank deposits in the national currency.
The advantages of the devaluation are as follows:
1. Low financial costs – support of the currency in a low financial corridor.
2. Increasing the competitiveness of a number of Kazakh enterprises (production of food products and other non-metallic mineral products, oil distillation, chemical industry, etc.);
3. An effective policy of import substitution leads to an increase in the economy and employment of the population, while there is an improvement in the balance of visible trade and the balance of payment accounts.
4. Positive effects on the country’s budget; replenishment of the budget in US dollars due to exchange rate differences.
The Russian ruble exchange rate has a strong impact on the Kazakhstani tenge. The Russian ruble lost 27% against the US dollar for the period from 2015 to 2016. Decreasing, it pulled down almost all the national currencies of the CIS countries. For the year, the Kazakhstani currency lost 51.3% against the US dollar. Due to the sharp devaluation of the ruble, Russian goods have become much more affordable for consumers in Kazakhstan. Within the framework of the EAEC, Astana raised the issue of protecting its domestic market from the import of a number of Russian goods. Such a position could seriously affect the very foundations of this integration association.
The devaluation of the tenge may have had a serious impact on the savings of citizens of the Republic of Kazakhstan (as happened in other CIS countries), and the Kazakh authorities took a very serious step: to protect the interests of the population. A program was developed to compensate for exchange differences in the tenge deposits of the population. This means that the remaining balance of the account up to 1 million tenge (about $4,000) was fixed according to the old rate. This measure helped to contain the massive conversion of tenge deposits into foreign exchange deposits, as its implementation could have had a rather negative impact on the state of the banking system. However, there remains a high probability that in the event of further weakening of the tenge rate due to the deterioration of the external economic environment, depositors will convert the amounts received as a result of compensation into foreign currency.
After introducing the floating tenge exchange rate and the period of sharp fluctuations in exchange rates and interest rates, in late 2015 and early 2016, the National Bank took measures to stabilize markets and improve liquidity. Regular monetary transactions were resumed, and the base rate was introduced again, initially at 17 percent in February 2016. The National Bank also softened reserve requirements, raised the recommended interest rates on deposits in the tenge and adjusted information support. Due to increased stability and the rise in oil prices, the tenge exchange rate strengthened and the outflow from US dollar deposits resumed. The National Bank bought foreign currency from February to May and sold it in July and August to prevent sharp exchange rate fluctuations, but since then has not entered the market. By July, inflation reached almost 18 percent, and then fell again to 7.8 percent in February, returning to the National Bank target range of 6-8 percent. The fixing of inflation expectations allowed the National Bank to reduce the discount rate from 17 to 11 percent.
The actions of official bodies that included budgetary support, mainly within the framework of the state program for infrastructural development “Nurly Jol” for 2015-2019, established to implement the President's Address to the people of Kazakhstan of November 11, 2014, helped to mitigate the consequences of shocks and stabilize the economic situation.
In December 2016, a new scheme was approved for the National Fund of the Republic of Kazakhstan, aimed at reducing the dependence of the budget on oil, establishing specific benchmarks and maintaining sufficient reserves and savings. This scheme provides for deficit targets without including oil price developments at 7 percent of GDP by 2020 and 6 percent by 2025, i.e. by 2-3 percentage points below the current level.
Many economists, studying the impact of oil prices on the national currency rate, argue that the tenge exchange rate dynamics is not the result of direct impact of the crisis on the world commodity market. Exchange rate fluctuations are now more connected with speculative trading, rather than with fundamental factors. Many experts believe that it was formed as a result of the financial policy pursued by the National Bank. Devaluation expectations that give rise to excitement in the foreign exchange market are largely due to the unpredictability of decisions made by the state regulator of the financial system. In such conditions, it is difficult to predict the near future, not to mention long-term prospects (Chepelyan and Grishko, 2016).
In Azerbaijan, whose economy differs from that of Russia and Kazakhstan, there was also a devaluation of the national currency.
Azeri-Chirag-Guneshli, a very large block of oil fields, brought Azerbaijan to prosperity at the beginning of the 21st century. The country’s economy grew at the fastest pace in the post-Soviet space. Azerbaijan’s GDP growth set a record among the former Soviet republics. High GDP growth coincided with high export growth rates. In addition to political transit, the increase in production allowed Azerbaijan to pass the crisis quite successfully in 2009, with the GDP growth rate remaining high – 9.4%. However, the peak of production in 2010 was followed by a rather significant decline in 2015 (Rustamov, 2010).
At the time of issuing a new Azerbaijani manat (on January 1, 2006, the old monetary units were replaced in the calculation of 5,000 to 1), the exchange rate of the national currency was 0.9184 Azerbaijani manat per US dollar against the backdrop of a huge flow of petrodollars. In December 2006, the authorities allowed the strengthening of the manat exchange rate, reducing it from 0.92 per US dollar to 0.87 per US dollar. In the next few years, the manat grew steadily against the dollar. In June 2011, the Central Bank of Azerbaijan was afraid of excessive strengthening of the manat, already reinforced, and the rate was fixed at 0.78 per US dollar.
On February 16, 2015, the Central Bank abolished the rigid pegging of the national currency rate to the dollar and linked the manat to the bi-currency basket, which was also supplemented by the euro. The application of the new operational framework was used to conduct a more flexible exchange rate policy, and gradually to adapt economic entities to the new conditions.
After a sharp fall in oil prices in February 2015, the government conducted a one-time devaluation of the manat, fixing it at 1.05 per US dollar. The foreign exchange reserves of the Central Bank reduced from their peak of $15 billion in mid-2014 to $5 billion in December 2015. The sharp decline in financial resources caused by the prolonged fall in oil prices in world markets forced the Central Bank to switch to the floating manat exchange rate on December 21, 2015, which fell from 1.0499 to 1.55. In total, during the two stages of devaluation, the national currency has fallen in price by half.
Officially, the need for devaluation is explained by the necessity to stimulate Azerbaijan's economic competitiveness in conditions of low oil prices and unfavorable trends in the global economy. The twofold decrease in the cost of the manat against the dollar (this is the main currency of foreign trade operations) caused an inflationary wave in the country. The impoverishment of the population resulted in public protests.
Azerbaijan's GDP growth fell to 1.1% in 2015, and 2016 was the first year of recession in the last 20 years, when GDP fell by 2.5%. The current account, according to the IMF, remains weakly positive, although until 2015 the surplus was double-digit due to the high surplus of the trade balance.
In January 2016, the government made an attempt to contain the dollar exchange rate, shutting down all exchange offices in the country, thus depriving 9,000 people of work.
As of September 2017, the exchange rate is 1.7 Azerbaijani manats per US dollar. As a result, the devaluation of the manat turned out to be more significant than that of other currencies of the CIS countries, dependent on oil and gas exports (the Kazakhstani tenge and the Russian ruble).
The Azerbaijani government is developing a number of measures to strengthen the export potential of the non-oil sector and to develop import substitution, for which decisions are made on the exemption of imported industrial equipment from taxes and customs duties. The country also carries out the policy of austerity, which can be traced in the activities of state-owned companies.
In order to mitigate the impact of devaluation on the banking system and population, the authorities returned to the regime of tax holidays on income from bank deposits. However, the main financial problem – dollarization, which appeared immediately after the first devaluation, has not been solved by this measure. A significant share of deposits in banks are denominated in US dollars. This creates problems in the credit market, as expectations of the further depreciation of the manat make dollar loans unclaimed and more risky.
However, the real test is ahead of Azerbaijan. The contract on the development of the Azeri-Chirag-Guneshli block of oil fields will end in 2024, but no new large fields have been discovered, despite the fact that the country’s geological exploration was quite active during the boom. According to some forecasts (Zotin, 2017), oil production could fall more than twice by 2025. Even if one assumes that these forecasts are too pessimistic, Azerbaijan still needs to prepare for a further decline in oil production.
The fall in production will entail a decline in the petrodollar flow. The State Oil Fund, whose volume was $35.8 billion as of October 1, 2016, could help to support the previous level of spending (Zotin, 2017). However, these reserves are not unlimited, especially given the high dependence of the budget on transfers from the fund and the recently increased level of public debt.
In total, the reserves of the State Oil Fund have received only 27% of revenues from oil and gas sales since 2003. The remaining 73% were directed to the budget, i.e. to current consumption. At the same time, the substantial saving of oil and gas rents was possible only in the first years of the fund’s work. Since 2009, transfers to the budget have exceeded 90% of the fund’s expenses (in 2008 – 88%).
The localization degree of production of Russian goods is on average much higher than that of production of Azerbaijani and Kazakhstani enterprises. Therefore, the devaluation of the Russian ruble has increased the competitiveness of Russian goods in comparison with the Kazakhstani tenge and the Azerbaijan manat. Due to this factor, the devaluation of the ruble does not stimulate inflationary processes in Russia as much as the weakening of the national currencies of Azerbaijan and Kazakhstan. According to Bloomberg’s analysis, Russia stood to gain from devaluation, Kazakhstan increased foreign exchange reserves, and the Azerbaijani manat lost.
Thus, the devaluation processes in export-oriented countries clearly demonstrate the main trends of globalization and the internationalization of world economic ties. This means that national economies are largely interdependent and interconnected.
It is revealed that devaluation has a negative impact on countries with a resource-based economy, since they cannot realize the export advantages of the devaluation of their national currency, unlike countries with a diversified economy. Countries-suppliers have nothing to export except raw materials; therefore, their foreign debt in US dollars is growing.
There is a violation of the structure of monetary circulation within the countries considered as well as a disproportion in the distribution and redistribution of national income. This results in the flight of capital from the country and the growth of the shadow economy. Each country seeks to strengthen its national currency and make it reliable. For this purpose, anti-crisis measures are taken to improve monetary policy.
The transition to a free float exchange rate due to an excessive openness of the economies considered, the dependence of their exports on oil prices and the high share of imports in the consumer market is incompatible with ensuring macroeconomic stability. Price fluctuations in the world market, the attack of financial speculators or any other change in external economic conditions in the context of a free floating exchange rate fundamentally change plans to achieve the target level of inflation. The inflation targeting policy did not help the countries considered to restrain its increase, but it helped to maintain financial stability in the banking system and generate expectations about the dynamics of interest rates.
The way out, according to the authors, is to diversify the structure of the economy and promote its innovative development, attract investment as well as improve the institutions of the state, market and society.
Annual report of the National Bank of the Republic of Kazakhstan for 2010. Retrieved from: http://www.nationalbank.kz/cont/publish239541_6747.pdf
Annual report of the National Bank of the Republic of Kazakhstan for 2014. Retrieved from: http://www.nationalbank.kz/cont/publish122943_28458.pdf
Annual report of the National Bank of the Republic of Kazakhstan for 2015. Retrieved from: http://www.nationalbank.kz/cont/%D0%93%D0%9E_2015_%20%D1%80%D1%83%D1%81%D1%81%D0%BA_.pdf
Chepelyan, L. V., and Grishko, I. V. (2016). Evaluation of the influence of oil prices on the national currency rate in the Republic of Kazakhstan. Young Scientist, 9(113), 749-752. Retrieved from: https://moluch.ru/archive/113/28819/
CIA World Factbook: https://www.cia.gov/library/publications/the-world-factbook/index.html
Golodova, Zh. G., and Ranchinskaya, Iu. S. (2014). Exchange rate policy in CIS countries: major issues and trends of implementation. Finance and Credit, 27(603), 2-10.
International Energy Agency. Retrieved from: https://www.iea.org/russian/
Korshunova, P. (2016). Ten of the weakest currencies in the world. Bankdirect. Retrieved from: https://bankdirect.pro/gde-zhivut-dengi/desyatka-samykh-slabykh-valyut-mira-660156.html
Lebedeva, M.E., Vasil’ev, S.A. & Kozyreva, A.D. (2016). Monetary policy of the Russian Federation: features and prospects. Bulletin of St. Petersburg State University of Economics, 4(100), 57-63.
Lizardo, R. A., and Mollick, A. V. (2010). Oil price fluctuations and U.S. dollar exchange rates. Energy Economics, 32(2), 399-408.
Mamyshev, Zh. (2017). Kazakhstan is more resistant to lower oil prices than Azerbaijan. Atameken Business Channel. Retrieved from: http://www.abctv.kz/ru/news/kazahstan-bolee-ustojchiv-k-snizheniyu-cen-na-neft-chem-aze
Russia: production and export of oil and gas for 2016 (2017). Seosait blog. Retrieved from: https://seosait.com/russia-nefti-i-gaz-2016
Rustamov, E.S. (2010). The global crisis and the anti-crisis policy of the Central Bank of Azerbaijan. Money and Credit, 1, 27-35.
S&P does not predict GDP growth in Kazakhstan in 2016 (2016). Capital: Business Information Center. Retrieved from: https://kapital.kz/economic/48599/s-p-v-2016-godu-ne-prognoziruet-rost-vvp-kazahstana.html
Sterkin, F. & Papchenkova, M. (2013). "Dutch disease" is progressing in Russia. Vedomosti, July 17, 2013.
The dynamics of oil prices since 1990. Dossier (2014). Information agency of Russia. Retrieved from: http://tass.ru/ekonomika/1572991
The oil sector of the CIS: the impact on the economy and sovereign ratings (2005). Special report of the agency FitchRatings. Kazakhstan Business Magazine, 1. Retrieved from: http://www.investkz.com/journals/42/97.html
Yousefi, A., and Wirjanto, T. S. (2003). Exchange rate of the US dollar and the J curve: the case of oil exporting countries. Energy Economics, 25(6), 741-765.
Zotin, A. (2017). Azerbaijan: the eastern fairy tale 30 years long. Carnegie Moscow Center. Retrieved from: http://carnegie.ru/2017/03/24/ru-pub-68386%20-%20_edn24
1. Department of International relations and the world economy, Al-Farabi Kazakh National University. PhD Student
2. Department of International relations and the world economy, Al-Farabi Kazakh National University. Doctor of Economics, Academician, Professor, E-mail: info@kaznu.kz
3. Department of International relations and the world economy, Al-Farabi Kazakh National University. Candidate of Economics, Associate Professor
4. Department of International relations and the world economy, Al-Farabi Kazakh National University. Associate Professor