![]() ISSN 0798 1015
ISSN 0798 1015

![]() ISSN 0798 1015
ISSN 0798 1015
Vol. 38 (Nº 51) Year 2017. Page 23
CANO, Jose A. 1; GOMEZ, Rodrigo A. 2; SALAZAR, Fernando 3
Received: 08/06/2017 • Approved: 18/07/2017
2. Routing policies for the picker routing problem
3. Routing policies flowcharts
4. Warehouse configuration and computational environment
ABSTRACT: In this paper, we study the computation time of routing policies for the picker routing problem in order to determine the feasibility of the simultaneous use of these policies in picking problems. For this, programming details of routing policies are shown, and simulations considering different warehouse sizes and pick list sizes are performed. Taking into account different population sizes and numbers of iterations, the computation time of routing policies in population-based metaheuristics for the order batching problem is estimated. |
RESUMEN: Este artículo estudia el tiempo de computación de políticas de ruteo de picking para determinar la viabilidad del uso simultáneo de políticas de ruteo en problemas de picking. Se presentan detalles de la programación de las políticas de ruteo, y se realizan simulaciones considerando diferentes tamaños de almacén y listas de picking. Se estima el tiempo de computación de políticas de ruteo para metaheurísticas poblacionales aplicadas en problemas de conformación de lotes. |

Warehouses and distribution centers represent an important echelon in the supply chain as they regulate the flow of materials along the supply chain (Gu et al., 2007), store products and retrieve storage products to meet customer orders (Chen et al., 2005). It becomes more evident in retail distribution centers that process a large number of orders, with items requiring less than unit loads (Bozer & Kile, 2008). Therefore, warehouse management must reduce operation times (Salazar et al., 2017), and meet customer needs in terms of accuracy, response time, number of orders, order sizes and order frequency, which have changed dramatically with the global economy and e-commerce demand trends (Manzini et al., 2015).
In warehouse management, the picking process consists of collecting items in a specified quantity to satisfy customer orders (Roodbergen & Vis, 2006; Bustillo et al., 2015). Thus, underperforming this process generates long processing and delivery times, incorrect shipments, high labor costs, additional and/or emergency shipments (Henn et al., 2010). Within the operations of the order picking, transport consumes at least 50% of the total order picking time (De Koster et al., 2007; Tompkins et al., 2010), and considering that warehouse operations are frequent, a small improvement in efficiency in order picking can lead to great cost savings in warehouse management (Chen et al., 2005; Albareda-Sambola et al., 2009).
Travel time is considered as a function of the distance traveled, whereby it is considered as the main performance measure to be optimized for warehouse management (Pan & Wu, 2012; Karásek, 2013). Proper routing planning can minimize total order picking costs, and thus achieve the goal of improving picking performance (Hsieh & Tsai, 2006). The picker routing problem is responsible for the minimum distance to be traveled by the picker in a warehouse (Hsieh & Huang, 2011; Azadnia et al., 2013), for which it is necessary to define the movements of the pickier between the storage positions to retrieve the products (Roodbergen & Vis, 2006). This problem is a special case of the Traveling Salesman Problem (TSP) (Hsieh & Huang, 2011; Cheng et al., 2015; Henn et al., 2015; Li et al., 2017; Cortes et al., 2017), however, as the number of positions to be visited increases, the solution time to obtain an optimal solution becomes intractable (Chen et al., 2015), and the routing problem cannot be solved to optimally for every warehouse layout within reasonable computation times (van Gils et al., 2016).
In practice, the tour followed by the picker in order to retrieve items of customer orders is generally determined by routing policies (Henn & Wäscher, 2012). Even in conventional warehouses (rectangular warehouses), the picker routing problem can be practically solved with heuristic methods (Karásek, 2013). Therefore, the use of routing policies prevails in practice, and this is reinforced by the idea that the routing policies are straightforward, more consistent in forming routes, avoiding confusion and errors (Petersen & Aase, 2004; Dukic & Oluic, 2007).
Previous studies in routing policies have found that a specific heuristic method could, in some situations, result in a near-optimal route, but in some other situations it could perform badly (Petersen, 1997; Dukic & Oluic, 2007), which requires the simultaneous study of several routing policies to choose the best performing routing policy for a particular warehouse. On the other hand, a growing number of picking aisles, or larger pick lists result in fast increasing computing times (van Gils et al., 2016), whence it is necessary to study how routing policies computing time is affected by increasing the layout size and the pick list size.
We will, therefore, study the computing time of routing policies under different warehouse configurations and pick list sizes, in order to determine the feasibility of simultaneously evaluating these policies for small, medium and large order picking problems. This will show how the solution time for routing policies is affected depending on the number of aisles, storage positions per aisle and pick list size, as well as affected depending on the population size and number of generations used in population-based metaheuristics for order batching problems. The remainder of this paper is organized as follow: In Section 2 and Section 3, we give a precise description of the operation of the main routing policies, such as the S-shape, Largest Gap, Return, and Composite routing policies. Section 4 describes numerical experiments to evaluate the computing time of the routing policies. In Section 5, we present the results of the computing times obtained from simulation experiments. The paper concludes with a summary and an outlook on potential areas of future research.
The most commonly used routing policies in real warehouse environments are the S-shape, Midpoint, Return, Largest Gap, Composite or Combined policies. In the S-shape or Traversal policy, considered as the simplest routing policy, a picker begins from the Depot and proceeds through all aisles containing picks before returning to the Depot (Petersen, 1997). Order pickers only traverse an aisle containing at least one pick location from one end of the aisle and exits through the other end of the aisle (Petersen, 1999; van Gils et al., 2016), and aisles without items to be picked are skipped. If the number of aisles to be visited is odd, a return travel is performed in the last aisle visited, otherwise the last aisle visited is traversed (Dukic & Oluic, 2007).
The Return policy is another straightforward routing policy, where a picker only enters aisles containing picks. Therefore, the picker enters a pick aisle from the front cross-aisle, travels as far as the farthest pick location and then returns to the front cross-aisle (Hwang & Kim, 2005; Boenzi et al., 2015). The Midpoint policy extends the return strategy by requiring the order picker to enter a picking aisle from a cross-aisle, traverse the aisle as far as the midpoint to perform the picks and return to the same cross-aisle (Hwang et al., 2004). At the midpoint, the order picker returns and leaves the aisle from the same end as he entered the aisle. (van Gils et al., 2016). Depending on the items to be picked in an aisle, a picker may have to enter the same picking aisle again from the other cross aisle. (Hwang et al., 2004). The Only picker traverses entirely the first aisle to enter the back aisle and the last aisle to exit the back aisle (Petersen, 1997; Dukić & Oluić, 2004).
The Largest Gap routing policy extends the return routing policy because if the largest gap within an aisle is the distance between two adjacent pick locations, the picker should perform a return (Liu et al., 2012; van Gils et al., 2016). The largest gap in a visited aisle is defined as the distance between either any two adjacent pick locations, or between the first pick location and the front cross-aisle, or between the last pick location and the back cross-aisle (Liu et al., 2012). Hence, all aisles that contain even one item to be picked are left at the same side as they were entered, and first and last aisles visited are traversed entirely (Dukic & Oluic, 2007). It should be noted that the largest gap the portion of the aisle that is not traversed (Albareda-Sambola et al., 2009).
The composite or combined routing policy combines the best features of the S-shape and Return policies (Petersen & Schmenner, 1999; Burinskiene, 2010), or the best features of the S-shape and Largest Gap policies (Matusiak et al., 2014) in order to minimize the travel distance between the farthest pick locations in two adjacent aisles (Elbert et al., 2016). An aisle is either fully traversed (S-shape) or entered and left from the same side of the aisle (Return or Largest Gap) (Petersen, 1997), and the option to choose is selected taking into account which one gives the shortest travel distance when combined with the best option for the next aisle (Petersen & Schmenner, 1999; Albareda-Sambola et al., 2009). For each visited aisle, the choice is made by using dynamic programming to decide the better starting point for the next aisle (Roodbergen & De Koster, 2001; Dukic & Oluic, 2007).
From these routing policies, S-shape, Largest Gap, Return and Composite policies will be considered in order to analyze programming and operation insights as well as the computing time needed to obtain solutions for different warehouse configurations and pick list sizes. The Return policy will be excluded because the Largest Gap policy represents an improvement of this routing policy, generating a more efficient return point in each aisle.
In order to provide a better understanding of S-shape, Largest Gap, Return and Composite policies, we present in this section flowcharts for each policy, explaining how to program or codify them in a programming language and thus test the policies under different warehouse instances.
Figure 1 presents a flowchart explaining the operation of the S-shape (SS) routing policy. This policy provides good results when picking density per picking aisle is large (Petersen & Aase, 2004) and when the number of aisles to visit tends to be small. Therefore, it is justified to traverse the aisles of the warehouse, because the pick locations would be very close to each other.
Figure 1. Flowchart for the S-shape routing policy
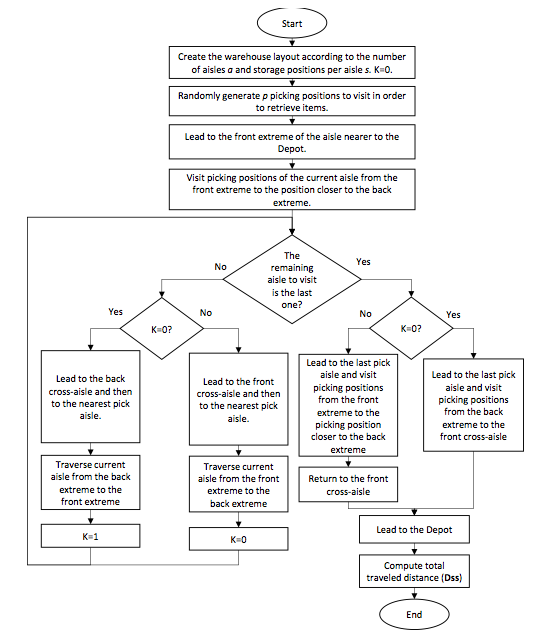
Figure 2 depicts the flowchart of the Largest Gap (LP) heuristic. This policy provides good results when the pick list size is medium or small (Petersen, 1999), when the number of aisles to be visited tends to be large and when the pick locations are quite close to the cross-aisles. This is how the Return policy avoids traversing significant distances within each aisle, generating a route near to the front and back cross-aisles.
Figure 2. Flowchart for the Largest Gap routing policy
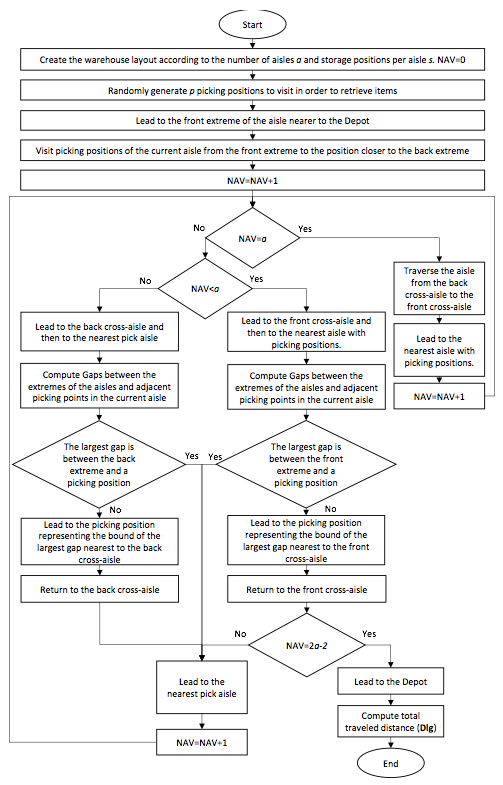
Figure 3 shows the flowchart for return (RT) policy. The return policy causes inefficient travel when pick locations tend to exist in the upper part (Hwang et al., 2004) and when the pick list size increases. However, this policy could be beneficial saving space required as there is no need for a rear aisle (Dukic & Oluic, 2007), and can also have a good performance with a class-based storage policy, where the most demanded items are located near the front cross-aisle.
Figure 3. Flowchart for the Return routing policy
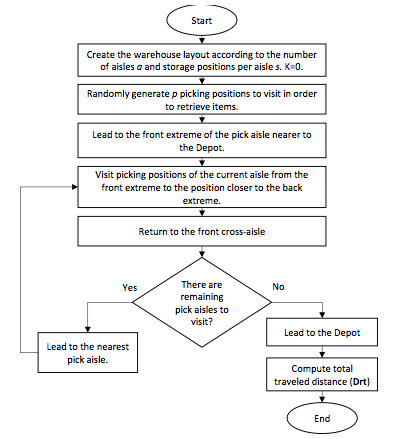
Figure 4 presents the flowchart of the composite heuristic (CO). This routing policy can produce near-optimal solutions (Petersen & Aase, 2004). The inefficiencies are not great and the risks of false steps or missed picks are low (Petersen & Schmenner, 1999). It offers a balance between the performance of the S-shape and Largest Gap, so it can offer a more stable performance for different warehouse configurations and pick list sizes.
Figure 4. Flowchart for the Composite routing policy

On the other hand, it is observed that each routing policy has operating features that allow them to get a good performance under certain conditions. However, it is of interest to test all routing policies for the same routing problem, in order to find the shortest traveled distance in different warehouse configurations and pick list sizes. This procedure will be called as “simultaneous policies” (SP), and will be studied in the experiments and simulations in section 4.
In this study, we model rectangular warehouses with parallel aisles with a cross-aisle at the front and at the rear, the width and depth of a storage location and the width of every aisle and cross-aisle is 1 meter. A depot is located at the left bottom corner, and each item is assigned to only one storage location. Two-sided picking is assumed within an aisle, and the horizontal distance within picking aisles is negligible. A random storage policy is considered.
In order to determine the computing time of routing policies under different scenarios, the following factors were considered in a warehouse environment: number of aisles (5, 10, 15, 20, 25), storage locations per aisle (10, 20, 30, 40, 50), pick list size (5%, 10%, 15%, 20%, 25%) and routing policies (SS, LG, RT, CO, SP). The pick list size is the number of pick locations to visit in a tour, and it is defined as a percentage of the storage locations for every warehouse configuration. The number of scenarios to be tested is 625 (5x5x5x5), and in each scenario, 100 simulations are performed to obtain statistical validity of the average computation time for the routing policies. This is how 62.500 instances have to be evaluated. Table 1 shows the storage locations and the total area of the warehouse configurations, obtained from the combination of the number of aisles and storage locations per aisle.
Table 1. Storage locations and total area of every warehouse configuration
Storage locations |
Storage locations per aisle |
|||||
10 |
20 |
30 |
40 |
50 |
||
Area |
||||||
Number of aisles |
5 |
100 |
200 |
300 |
400 |
500 |
180 |
330 |
480 |
630 |
780 |
||
10 |
200 |
400 |
600 |
800 |
1.000 |
|
360 |
660 |
960 |
1.260 |
1.560 |
||
15 |
300 |
600 |
900 |
1.200 |
1.500 |
|
540 |
990 |
1.440 |
1.890 |
2.340 |
||
20 |
400 |
800 |
1.200 |
1.600 |
2.000 |
|
720 |
1.320 |
1.920 |
2.520 |
3.120 |
||
25 |
500 |
1.000 |
1.500 |
2.000 |
2.500 |
|
900 |
1.650 |
2.400 |
3.150 |
3.900 |
||
We use Visual Basic for Applications (VBA) in Excel 2013 to create the programming codes of the routing policies, and the experimental instances run on a PC (Intel i5 2.8 gigahertz CPU, 8-gigabyte memory) with Windows 8.1 Pro.
Once we established the instances for the simulations, the experiment is intended to compare the performance of the routing policies regarding computing time. Table 2 shows the average computing time, maximum and minimum computing time for each routing policy in the evaluated instances. Hence, it is found that the S-shape policy presents a shorter average computing time, and the Return policy presents the longer average computing time. The same trend is observed for the minimum and maximum computation times in the evaluated instances. By executing the SP heuristic (SS, LG, CO and RT policies) in the evaluated instances, an average computing time of 37,3 milliseconds (ms) is generated, which is a viable computing time and is equivalent to 1.610 runs of the heuristic per minute. In the case of a warehouse size of 3.900 m2 and a pick list size of 625 items, the maximum computing time generated is 125,3 ms which is equivalent to 480 runs per minute.
Table 2. Routing policy computing times in evaluated instances
Routing policy |
Computing Time in milliseconds (ms) |
||
Average |
Maximum |
Minimum |
|
SS |
7,5 |
25,2 |
0,3 |
LG |
9,0 |
30,9 |
0,5 |
CO |
9,4 |
32,7 |
0,8 |
RT |
11,1 |
41,6 |
0,9 |
SP |
37,3 |
125,3 |
3,6 |
Figure 5 shows the computing time for routing policies according to the warehouse area, deducing that the run time of each routing policy grows exponentially as the warehouse size increases. As stated in Table 2, the S-shape is the routing policy with the shortest computing time since it is the simplest policy, while the Return policy generates the largest computing time. The Largest Gap and Composite policies present similar computing times due to similar calculations and comparisons for each aisle to be visited.
Figure 5. Computing time per routing policy according to warehouse size
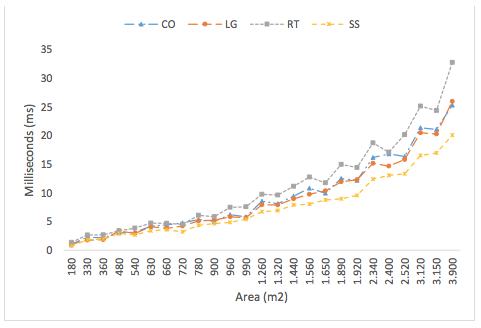
It is also identified for small warehouses that the S-shape computing time resembles the Largest Gap computation time, however, as the warehouse size increases, the difference between both policies increases considerably.
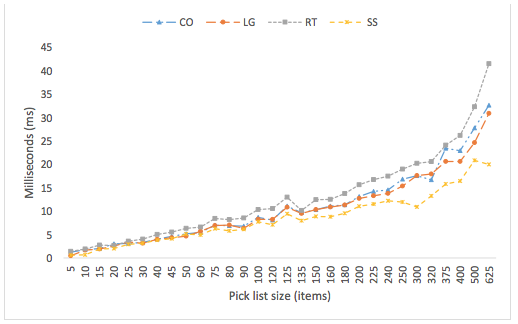
Regarding the computing time according to the pick list size, Figure 6 shows similar computing times for the analyzed routing policies as the pick list size tend to be small (up to 25 items or picking locations to visit). From a pick list size of 30 items, the Return policy presents longer computation times. From Figure 6 it is also inferred that the computing times of the S-shape, Largest Gap and Composite policies resemble up to pick list sizes of 100 items. From this pick list size, an obvious difference is generated between the S-shape policy with respect to the Largest Gap and Composite policies. From pick list sizes of 375 items, the Composite policy generates longer computation times than the Largest Gap policy due to the additional calculations that must be performed by the Composite policy each time an aisle is to be visited, in order to identify whether the next aisle will be entered by the front cross-aisle or by the back cross-aisle.
Figure 6. Computing time per routing policy according to pick list size
By executing the SP heuristic and selecting the shortest distance among the SS, LG, CO and RT policies, computation times are obtained and shown in Figure 7. It is observed that both the warehouse size and the pick list size influence the computation times of the routing policies. For a warehouse size of 3,150 m2 and a pick list size of 100 items, an average computing time of 68,7 ms is generated, which may be similar to the computing time generated in a warehouse size of 2.340 m2 and a pick list size of 300 items, with an average computing time of 65,1 ms. Alike, a warehouse size of 990 m2 and a pick list size of 30 items generate an average computing time of 21,1 ms that is similar to the computing time generated by a warehouse size of 660 m2 and a pick list size of 100 items (20,1 ms).
Figure 7. Computing time for SP heuristic (joint routing policies)
according to the warehouse size and pick list size
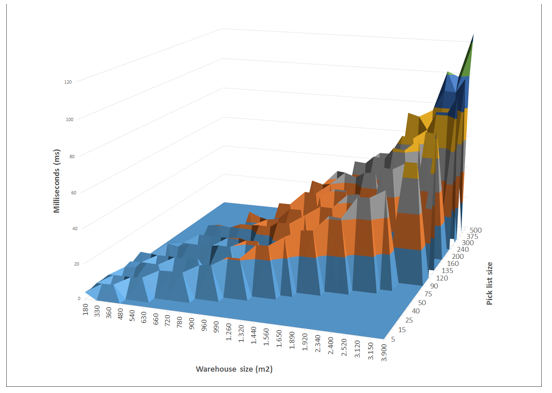
Table 3 presents computing time estimations for population-based metaheuristics used in order batching problems, whose computing time is mainly defined by parameters such as population size and the number of iterations or generations. Within these metaheuristics can be mentioned the genetic algorithms (GA), ant colony optimization (ACO) and particle swarm optimization (PSO). In order batching problems, each feasible solution must be tested with a picking routing in order to minimize the total traveled distance, and the total number of routes to be generated and tested is equal to the multiplication of the population size and the number of iterations. Table 3 shows estimated computing times taking into account population sizes ranging from 10 to 50 individuals, and iterations ranging from 50 to 200.
Table 3. Estimated computing times for SP heuristic in population-based
metaheuristics for order batching problems
Population |
Iterations |
Routes |
Computing Time (min) |
||
Average |
Maximum* |
Minimum** |
|||
10 |
50 |
500 |
0,3 |
1,0 |
0,0 |
100 |
1.000 |
0,6 |
2,1 |
0,1 |
|
150 |
1.500 |
0,9 |
3,1 |
0,1 |
|
200 |
2.000 |
1,2 |
4,2 |
0,1 |
|
20 |
50 |
1.000 |
0,6 |
2,1 |
0,1 |
100 |
2.000 |
1,2 |
4,2 |
0,1 |
|
150 |
3.000 |
1,9 |
6,3 |
0,2 |
|
200 |
4.000 |
2,5 |
8,4 |
0,2 |
|
30 |
50 |
1.500 |
0,9 |
3,1 |
0,1 |
100 |
3.000 |
1,9 |
6,3 |
0,2 |
|
150 |
4.500 |
2,8 |
9,4 |
0,3 |
|
200 |
6.000 |
3,7 |
12,5 |
0,4 |
|
40 |
50 |
2.000 |
1,2 |
4,2 |
0,1 |
100 |
4.000 |
2,5 |
8,4 |
0,2 |
|
150 |
6.000 |
3,7 |
12,5 |
0,4 |
|
200 |
8.000 |
5,0 |
16,7 |
0,5 |
|
50 |
50 |
2.500 |
1,6 |
5,2 |
0,2 |
100 |
5.000 |
3,1 |
10,4 |
0,3 |
|
150 |
7.500 |
4,7 |
15,7 |
0,5 |
|
200 |
10.000 |
6,2 |
20,9 |
0,6 |
|
* Warehouse size of 3.900 m2 and pick list size of 625 items ** Warehouse size of 180 m2 and pick list size of 5 items |
|||||
From Table 3, it is deduced that on average, for small population sizes (10 to 20 individuals), between 500 and 4.000 routes can be created to compute fitness values in population-based metaheuristics, generating a computing time between 0,3 and 2,5 minutes. For medium population sizes (30 individuals), between 1.500 and 6.000 routes can be created, generating a computing time between 0.9 and 3.7 minutes. For large population sizes (40 to 50 individuals), between 2,000 and 10,000 routes can be created, generating a computing time between 1,6 and 6,2 minutes.
For the extreme case of a population size of 50 individuals, 200 generations, a warehouse of 3.900 m2 and a pick list size of 625 items, 10.000 routes can be generated involving computation times of up to 20,9 minutes. On the other hand, for the extreme case of a population size of 10 individuals, 50 generations, a warehouse of 180 m2 and a pick list size of 5 items, 500 routes can be generated involving a computing time shorter than 10 seconds.
Therefore, the joint use of routing policies offers short solution times for the picker routing problem, and suitable solution times for order batching problems, which are often more complex, especially when applying population-based metaheuristics. Computing times in these metaheuristics are drastically affected by population size, the number of iterations, warehouse size, and picking list size. Consequently, warehouse managers must understand the trade-off between computation time and solution quality, because a better exploration of the solution space of order batching and picker routing problems requires longer solution times, especially when the warehouse size and the pick list size increase.
In this paper, we have studied the computing time of routing policies under different warehouse configurations and pick list sizes. Four routing policies, S-shape, Largest Gap, Return, and Composite have been described in detail. The application of the routing policies results in reasonable computation times for the router picking problem due to the easy programming and operation of the policies. Even, the simultaneous application of the routing policies results in reasonable computing times and allows obtaining improvements compared with the application of a single policy.
The results demonstrate that the warehouse size and pick list size directly influence the computing time of routing policies. Similarly, the population size and the number of iterations to be used in population-based metaheuristics for order batching problems influence the total number of routes to be performed, and likewise the total computation time.
The simulation results of our study contribute to both practitioners and academic research. It is recommended that warehouse managers implement simultaneously the routing policies discussed in this paper to achieve greater efficiency in traveled distance for every warehouse size and pick list size. Hence, routing-policies-based solutions can adapt to different warehouse sizes and pick list sizes, providing satisfactory solutions and short computing times.
As a future work, it is suggested to study the computing time of the routing policies in multi-block warehouses, as well as under a class-based storage, volume-based ABC curves, and other storage policies different to the random storage policy. Likewise, it is recommended to compare the traveled distance of the SP heuristic with each routing policy, in order to determine distance savings in different warehouse configurations and pick list sizes.
ALBAREDA-SAMBOLA, M., ALONSO-AYUSO, A., MOLINA, E., & DE BLAS, C. S. (2009). Variable neighborhood search for order batching in a warehouse. Asia-Pacific Journal of Operational Research, 26(5), 655–683.
AZADNIA, A. H., TAHERI, S., GHADIMI, P., MAT SAMAN, M. Z., & WONG, K. Y. (2013). Order batching in warehouses by minimizing total tardiness: A hybrid approach of weighted association rule mining and genetic algorithms. The Scientific World Journal, 2013 (1), 1-13.
BOENZI, F., DIGIESI, S., FACCHINI, F., MOSSA, G., & MUMMOLO, G. (2015). Greening activities in warehouses: A model for identifying sustainable strategies in material handling. 26th DAAAM international symposium on intelligent manufacturing and automation (pp. 980–988). Vienna, Austria: Danube Adria Association for Automation and Manufacturing, DAAAM.
BOZER, Y. A., & KILE, J. W. (2008). Order batching in walk-and-pick order picking systems. International Journal of Production Research, 46(7), 1887–1909.
BURINSKIENE, A. (2010). Order picking process at warehouses. International Journal of Logistics Systems and Management, 6(2), 162–178.
BUSTILLO, M., MENÉNDEZ, B., PARDO, E. G., & DUARTE, A. (2015). An algorithm for batching, sequencing and picking operations in a warehouse. International Conference on Industrial Engineering and Systems Management, IEEE IESM 2015 (pp. 842–849). Seville, Spain: Institute of Electrical and Electronics Engineers Inc.
CHEN, M.-C., HUANG, C.-L., CHEN, K.-Y., & WU, H.-P. (2005). Aggregation of orders in distribution centers using data mining. Expert Systems with Applications, 28(3), 453–460.
CHEN, T. L., CHENG, C. Y., CHEN, Y. Y., & CHAN, L. K. (2015). An efficient hybrid algorithm for integrated order batching, sequencing and routing problem. International Journal of Production Economics, 159(1), 158–167.
CHENG, C.-Y., CHEN, Y.-Y., CHEN, T.-L., & YOO, J. J.-W. (2015). Using a hybrid approach based on the particle swarm optimization and ant colony optimization to solve a joint order batching and picker routing problem. International Journal of Production Economics, 170(1), 1–10.
CORTÉS, P., GÓMEZ-MONTOYA, R. A., MUÑUZURI, J., CORREA-ESPINAL, A. (2017). A tabu search approach to solving the picking routing problem for large- and medium-size distribution centres considering the availability of inventory and K heterogeneous material handling equipment. Applied Soft Computingl, 53(1), 61-73.
DUKIC, G., & OLUIC, C. (2007). Order-picking methods: Improving order-picking efficiency. International Journal of Logistics Systems and Management, 3(4), 451–460.
DUKIĆ, G., & OLUIĆ, Č. (2004). Order-picking routing policies: Simple heuristics, advanced heuristics or optimal algorithm. Strojniski Vestnik/Journal of Mechanical Engineering, 50(11), 530–535.
ELBERT, R., FRANZKE, T., GLOCK, C. H., & GROSSE, E. H. (2016). Agent-based analysis of picker blocking in manual order picking systems: Effects of routing combinations on throughput time. Proceedings - Winter Simulation Conference (pp. 3937–3948). Darmstadt, Germany: Institute of Electrical and Electronics Engineers Inc.
VAN GILS, T., BRAEKERS, K., RAMAEKERS, K., DEPAIRE, B., & CARIS, A. (2016). Improving order picking efficiency by analyzing combinations of storage, batching, zoning, and routing policies. 7th International Conference on Computational Logistics, ICCL 2016. Diepenbeek, Belgium: Springer Verlag.
GU, J., GOETSCHALCKX, M., & MCGINNIS, L. F. (2007). Research on warehouse operation: A comprehensive review. European Journal of Operational Research, 177(1), 1–21.
HENN, S., KOCH, S., DOERNER, K. F., STRAUSS, C., & WÄSCHER, G. (2010). Metaheuristics for the Order Batching Problem in Manual Order Picking Systems. Business Research, 3(1), 82–105.
HENN, S., SCHOLZ, A., STUHLMANN, M., & WÄSCHER, G. (2015). A New Mathematical Programming Formulation for the Single-Picker Routing Problem in a Single-Block Layout (Working paper No. 5). Magdeburg, Germany: Otto-von-Guericke-Universität Magdeburg.
HENN, S., & WÄSCHER, G. (2012). Tabu search heuristics for the order batching problem in manual order picking systems. European Journal of Operational Research, 222(3), 484–494.
HSIEH, L.-F., & HUANG, Y.-C. (2011). New batch construction heuristics to optimise the performance of order picking systems. International Journal of Production Economics, 131(2), 618–630.
HSIEH, L. F., & TSAI, L. H. (2006). The optimum design of a warehouse system on order picking efficiency. International Journal of Advanced Manufacturing Technology, 28(5–6), 626–637
HWANG, H., & KIM, D. G. (2005). Order-batching heuristics based on cluster analysis in a low-level picker-to-part warehousing system. International Journal of Production Research, 43(17), 3657–3670.
HWANG, H., OH, Y. H., & LEE, Y. K. (2004). An evaluation of routing policies for order-picking operations in low-level picker-to-part system. International Journal of Production Research, 42(18), 3873–3889.
KARÁSEK, J. (2013). An Overview of Warehouse Optimization. Journal of Advances in Telecommunications, Electrotechnics, Signals and Systems, 2(3), 1-7.
DE KOSTER, R., LE-DUC, T., & ROODBERGEN, K. J. (2007). Design and control of warehouse order picking: A literature review. European Journal of Operational Research, 182(2), 481–501.
LI, J., HUANG, R., & DAI, J. B. (2017). Joint optimisation of order batching and picker routing in the online retailer’s warehouse in China. International Journal of Production Research, 55(2), 447–461.
LIU, J., LIMÈRE, V., & VAN LANDEGHEM, H. (2012). An improved largest gap routing heuristic for order picking. 10th International Industrial Simulation Conference 2012 (pp. 179–184). Dalian City, China: EUROSIS.
MANZINI, R., BOZER, Y., & HERAGU, S. (2015). Decision models for the design, optimization and management of warehousing and material handling systems. International Journal of Production Economics, 170(1), 711–716.
MATUSIAK, M., DE KOSTER, R., KROON, L., & SAARINEN, J. (2014). A fast simulated annealing method for batching precedence-constrained customer orders in a warehouse. European Journal of Operational Research, 236(3), 968–977.
PAN, J. C. H., & WU, M. H. (2012). Throughput analysis for order picking system with multiple pickers and aisle congestion considerations. Computers and Operations Research, 39(7), 1661–1672.
PETERSEN, C. G., & AASE, G. (2004). A comparison of picking, storage, and routing policies in manual order picking. International Journal of Production Economics, 92(1), 11–19.
PETERSEN, C. G., & SCHMENNER, R. W. (1999). An evaluation of routing and volume-based storage policies in an order picking operation. Decision Sciences, 30(2), 481–501.
PETERSEN, C. G. (1997). An evaluation of order picking routeing policies. International Journal of Operations and Production Management, 17(11), 1098–1111.
PETERSEN, C. G. (1999). The impact of routing and storage policies on warehouse efficiency. International Journal of Operations and Production Management, 19(10), 1053–1064.
ROODBERGEN, K. J., & DE KOSTER, R. (2001). Routing methods for warehouses with multiple cross aisles. International Journal of Production Research, 39(9), 1865–1883.
ROODBERGEN, K., & VIS, I. (2006). A model for warehouse layout. IIE Transactions, 38(10), 799–811.
SALAZAR, F, GOMEZ, R. A., & CANO, J. A. (2017). El problema de carga de pallets en centros de distribución utilizando diseño de mezclas. Revista Espacios, 38(2), p. 2. Retrieved from: http://www.revistaespacios.com/a17v38n02/17380202.html
TOMPKINS, J. A., WHITE, J. A., BOZER, Y. A., & TANCHOCO, J. M. A. (2010). Facilities Planning (4th Ed.). New Jersey: Wiley.
1. Universidad de Medellín, Colombia. Industrial Engineer, Master in Administrative Engineering. jacano@udem.edu.co
2. Universidad Nacional de Colombia, Colombia. Industrial Engineer, PhD in Engineering, Industry and Organizations. ragomez@unal.edu.co
3. Pontificia Universidad Javeriana, Colombia. Mechanical Engineer, PhD in Logistics and Supply Chain Management. fsalazar.network.com@gmail.com