![]() ISSN 0798 1015
ISSN 0798 1015

![]() ISSN 0798 1015
ISSN 0798 1015
Vol. 38 (Nº 14) Año 2017. Pág. 25
Maricéia Tatiana VILANI 1; Luciana SANCHES 2; Osvaldo Borges PINTO JUNIOR 3; Gustavo Manzon NUNES 4
4. Conclusions and future research
ABSTRACT: Using Fourier coefficient and Morlet wavelet, we analyzed the hourly and daily frequencies of the incoming solar radiation in the city of Cuiabá (Brazil), from the data of weather stations located at four different typologies of occupation. The application of both Fourier coefficients and wavelet coefficients revealed that there are some considerable differences between the two types of analyses. For various typologies of occupation, similar values were obtained over dominant periods, in relation to the influence of seasons and the characteristics of the system. We found that Fourier analyses were particularly useful in the analysis of a specific less than 1 day-long singular signal. |
RESUMO: Variáveis meteorológicas, como a radiação solar devido à natureza temporal de seus sinais, requerem investigações baseadas no espaço tempo-frequência a fim de revelar características espectrais, em função do tempo, a transformada Wavelet fornece uma representação precisa de um sinal em função do tempo e freqüência simultaneamente, bem como, permite analisar qualquer tipo de sinal, que a Série de Fourier se limita a determinadas análises. Sendo assim, o presente trabalho fez uma análise descritiva mensal utilizando a série de Fourier e a transformada de Wavelet da variável radiação solar para quatro pontos de estudo, duas de área urbana e duas de área rural, para o ano de 2007. Para a variável radiação solar tem-se que a intensidade de energia na alta escala de frequência foi de 24h e potências significativas no decorrer do ano todo, cuja variância mais acentuada esteve para o ponto Unicampo. |

Daily total solar radiation is considered as the most important parameter in meteorology, solar conversion, and renewable energy applications (Mellit et al. 2006). Indeed, insolation is important for all of the physical and biological processes in agriculture and forestry (Fu et al. 2002), since it is the primary input for energy balance, and also the driving force for water balance. Knowledge of the local solar radiation is essential for the proper design of building energy systems. This requires a database of long-term measurements at the site of the considered solar system (Harter 2004).
Similar to solar radiation, each climate index presents its own characteristic time-scales, from inter-annual to multi-decadal scales. However, some energy bands present common characteristics in terms of frequency (or time-scale) ranges and/or temporal occurrence, from the inter-annual (a group of 2–4 y, 3–6 y, and 4–8 y fluctuations), to the (pluri-) decadal scale (a group of 5–12 y, 8–16 y, 12–20 y, and 17–30 y fluctuations) but also in the long term (a group of 20–50 y, 40–60 y, and 50–80 y fluctuations) (Rossi et al. 2011).
Techniques used to analyze time series of meteorological variables include the Fourier series, wavelet series, and wavelet transform. Fourier analysis is traditionally used to characterize the daily cycle of a natural phenomenon of lower frequency ranges. However, this is not the best option, because lower frequency ranges are typically characteristic of chaotic phenomena (non-stationary). Wavelet analysis is becoming a common tool for the analysis of localized power variations within a time series. Wavelet analysis is capable of revealing aspects of data that other signal analysis techniques will fail to perceive, such as trends, breakdown points, discontinuities in higher derivatives, and self-similarity (Torrence and Compo 1998; Rehman and Siddiqi 2009).
Numerous studies have used the Morlet transform wavelets time series of decade series. For example, Torrence and Webster (1999) investigated the sea surface temperature in El Niño3 region (time series 1871-1996 years) and the Southern Oscillation Index, obtained from the pressure at sea level between the eastern and western Pacific (time series 1871-1994). Reboita and Krusche (2003) applied wavelets for air temperature and precipitation from 1991 to 2000 in Brazil. Kayano and Blain (2007) investigated minimum and maximum temperature and precipitation using wavelets with time series from 1890 to 2006. Harter (2004) investigated the precipitation between year of 1995 and 2002. Vitorino (2002) used time series of years 1979-1996 for Sea level pressure and long wave radiation.
In order to evaluate the differences yielded by these two techniques, the main objective of this work was to analyze the hourly and daily frequencies of the incoming solar radiation (Rg) in the city of Cuiabá (Brazil) using both Fourier coefficient and Morlet wavelet. We used data from weather stations located at four different typologies of occupation.
The city of Cuiabá is the state capital of the Mato Grosso state, located in the central part of Brazil (15°35’56”S and 56°06’01”W). Its average altitude is 174 m above sea level, and it has a total area of 3,538.17 km² and an urban area of 254.57 km². Field observations were performed from January to December 2007, at three localities in Cuiabá, namely Center, Seplan, and Unicampo, and at a fourth site, located in the city of Chapada dos Guimarães, hereinafter called Chapada, (15º27'38"S and 55º44'59"W at an altitude of 811 m), which is situated approximately 62 km away from Cuiabá.
Table 1 describes the main characteristics of the studied areas. Figure 1 shows the studied sites and presents their surroundings.
Table 1. Description and location of studied four sites.
City |
Local name |
Coordinates |
Altitude |
Description |
Cuiabá |
Center |
15°36'1"S; 56°5'29"W |
187 m |
Dense population and heavy traffic, concrete buildings and pavements. |
Seplan |
15°33'59"S; 56°4'30"W |
239 m |
Area with average building density and near of lake |
|
Unicampo |
15º45’45"S; 56º3'57"W |
202 m |
Sub rural area |
|
Chapada dos Guimarães |
Chapada dos Guimarães |
15°27'32’’S; 55°45'15"W |
809 m |
Urban area of low building density and climate typical of mountainous regions |
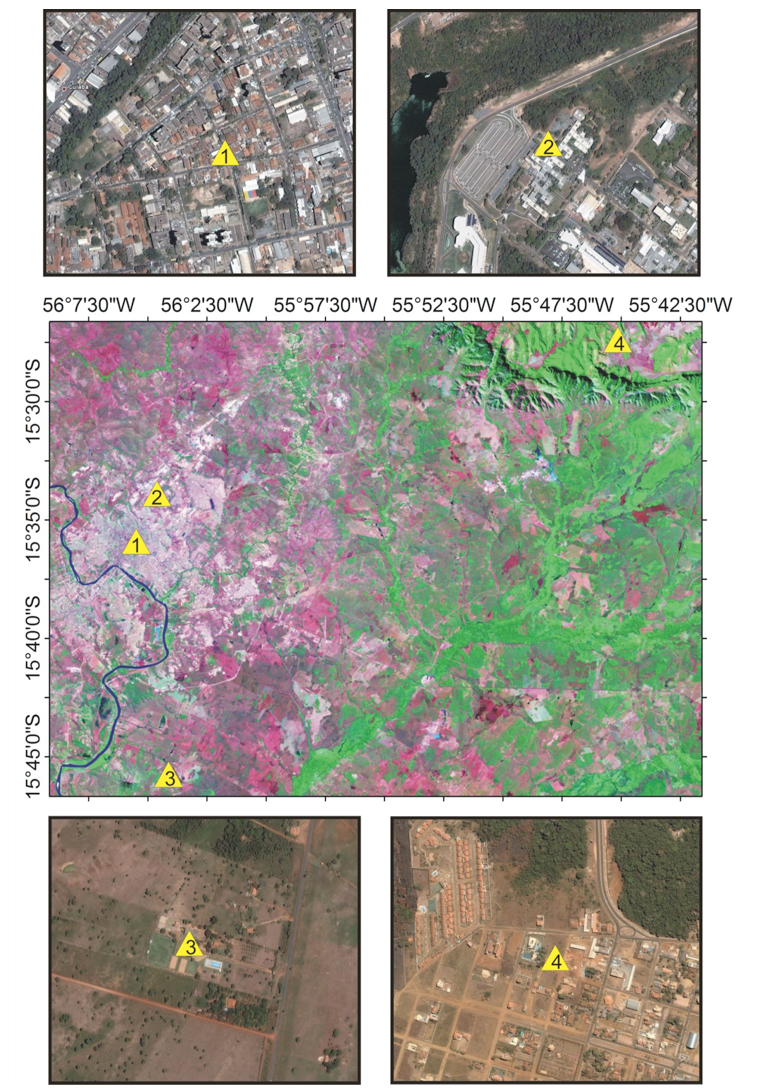
Figure 1: Localization of the weather stations from LANDSAT 7 ETM+ images (GeoCover 2000) in the Center and details of each station from QuickBird images.
The solar radiation (Rg) was measured using sensors installed on weather stations (WM 918 and Catalog with Vantage Pro2 console Manufacturer, Davis Instruments), programmed to store data every 30 min during the year 2007. These weather stations were installed above the ground at a height of 4.20 m, 10.50 m, 7.60 m, and 7.40 m at the Center, Seplan, Unicampo, and Chapada localities, respectively.
Fourier series was applied to analyze the dominant peaks of the time series, in which and are the Fourier coefficients that describe the periodic properties of the function . and coefficients are defined as follows:
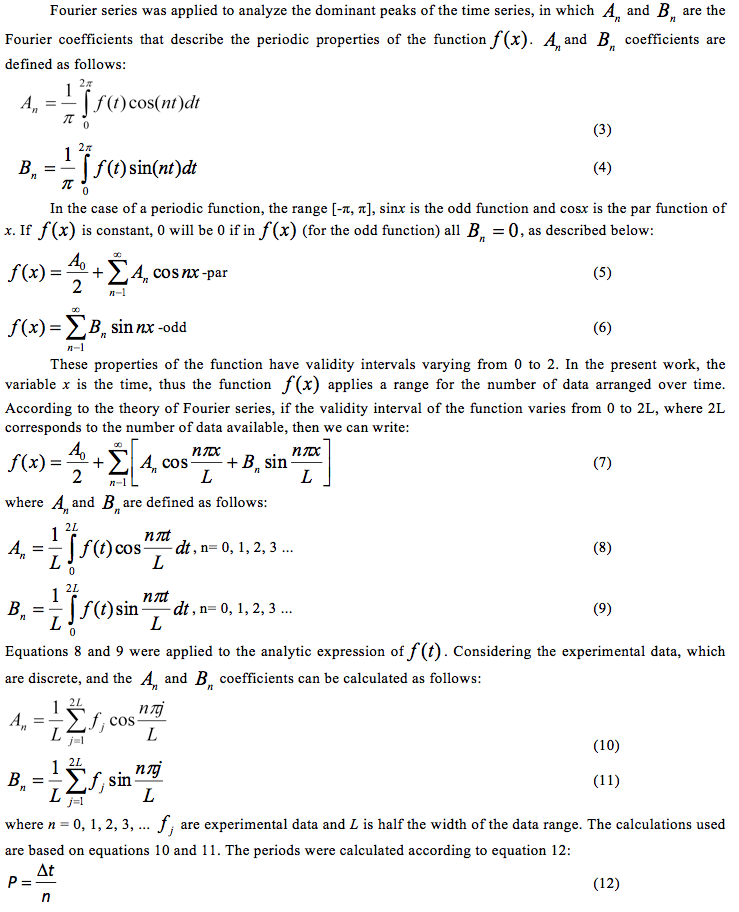
where P is the period (expressed in days); Δt is the number of days corresponding to each time series analyzed (with a Δt of approximately 30 for time series of 1 month), and n is the order of the coefficient corresponding to the peak (Pinheiro and Paulo 2011).
The discrete wavelet transform belongs to the multiresolution analysis (Daudechies 1990). It is a linear transformation with the particular property of simultaneous time and frequency localization. This type of analysis decomposes the given signal series into a set of basic functions of different frequencies called wavelets, each of which is shifted. Unlike the discrete Fourier transform, the discrete wavelet transform is not a single object. Indeed, it contains a whole family of transformations. The individual members of the family are determined by the choice of the so-called mother wavelet function. The goal of discrete wavelet transform is to decompose arbitrary signal into a finite summation of wavelets at different scales (or levels). The set of wavelets of different scales and shifts can be generated from the single prototype wavelet, called mother wavelet, by dilations and shifts. What makes the wavelet bases interesting is their self-similarity: every function in wavelet basis is a dilated and shifted version of one (or possibly several) mother function(s).
Here, we used the Morlet wavelets that are complex and nonorthogonal wavelet functions, according to equation 13:
(13)
where ψ(t) is the wavelet function. This function depends on a nondimensional ‘time’ parameter t, and a nondimensional frequency w0, here taken to be 6. In this study, wavelet analysis was performed using the algorithm developed available at http://paos.colorado.edu/research/wavelets, which uses the same language as the Matlab software.
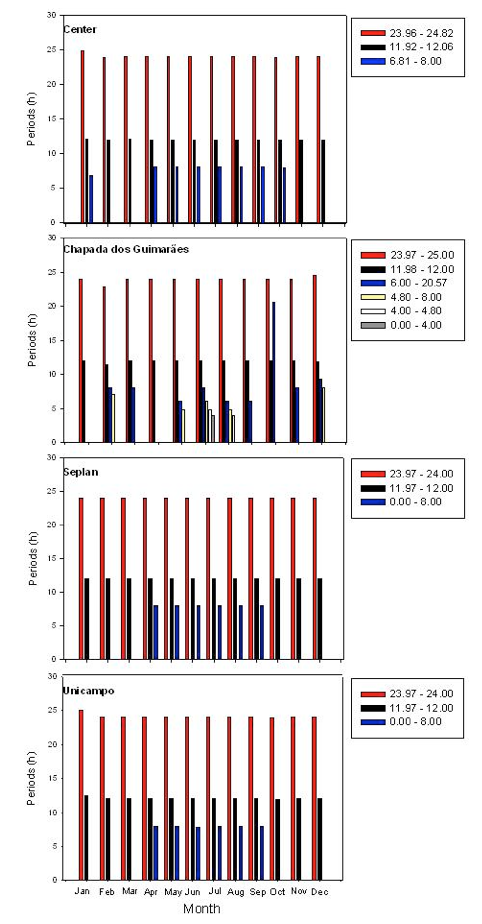
Figure 3: Dominant periods (minimum and maximum values) of incoming solar radiation
of the An coefficient at the Center, Chapada, Seplan, and Unicampo sites.
The daily average of incoming solar radiation (Rg) from January to December 2007 at all four studied sites is shown in Figure 2. For all sites, results show that the maximum values of Rg were higher during the rainy season than during the dry season. The seasonality of Rg was similar for Center, Unicampo, and Chapada sites. However, at the Chapada site, the seasonal Rg values exhibit a decrease. This is probably due to a high cloudiness in this area. Indeed, (Gomes et al. 2012) reported that because of its higher altitude, Chapada is affected by a predominance of cloudiness during the year compared to other localities.
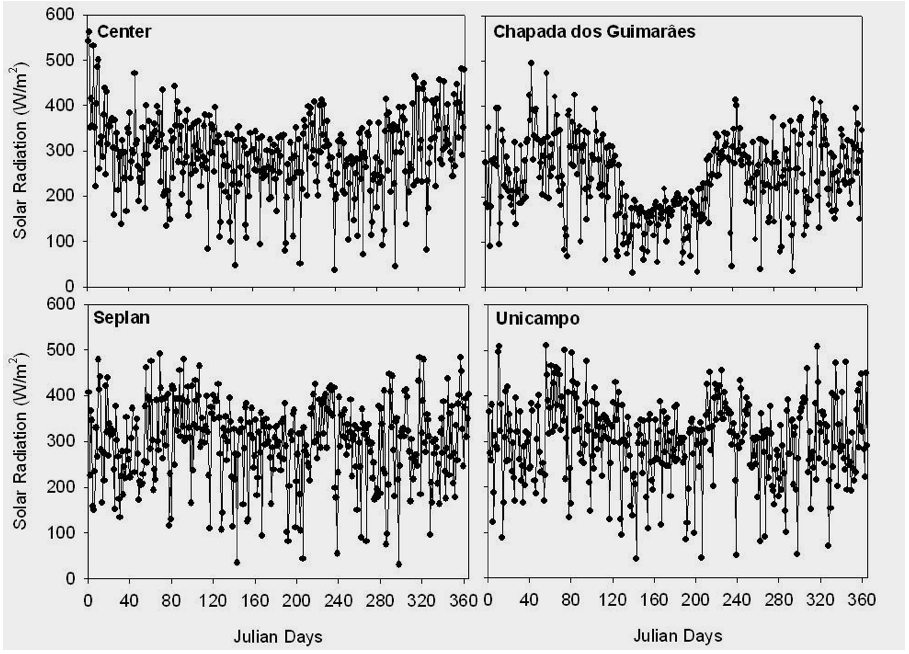
Figure 2: Daily average of the incoming solar radiation at the Center, Chapada, Seplan, and Unicampo sites in 2007.
The maximum Rg values were recorded at Unicampo. This may be related to the presence of clearer skies in this area. At the other sites, Rg values decrease with respect to the following order: Seplan, Centre, and Chapada (Table 2). The difference between the minimum and maximum Rg values during the dry and rainy seasons was of 19.69%.
Table 2: Average monthly of the solar radiation (W/m2) for the year 2007
for the localizations Center. Chapada. Seplan and Unicampo.
Month |
Centro |
Chapada |
Seplan |
Unicampo |
January |
359.28 |
240.48 |
348.64 |
375.70 |
February |
285.61 |
294.11 |
349.42 |
358.26 |
March |
308.87 |
281.72 |
404.29 |
418.04 |
April |
290.51 |
265.70 |
391.26 |
397.42 |
May |
260.99 |
173.27 |
345.70 |
347.08 |
June |
260.01 |
147.71 |
331.70 |
358.19 |
July |
257.17 |
160.75 |
330.09 |
346.05 |
August |
295.81 |
268.19 |
396.48 |
404.68 |
September |
260.90 |
259.89 |
342.72 |
350.88 |
October |
267.14 |
229.86 |
328.85 |
339.75 |
November |
315.45 |
275.20 |
361.62 |
366.26 |
December |
350.58 |
266.87 |
375.96 |
391.82 |
Wet season |
314.49 |
264.71 |
355.52 |
370.98 |
Dry season |
270.90 |
212.58 |
344.21 |
354.54 |
Difference between dry and wet seasons |
13.86% |
19.69% |
3.18% |
4.43% |
Total |
286.91 |
238.64 |
349.03 |
362.26 |
It was shown that urban areas influence the distribution of temperatures, wind patterns and air quality (Furon 2008). These areas can also affect the development of clouds and precipitations. Most studies suggest that the atmospheric instability associated with urban heat island and surface roughness is the most significant factor responsible for changes in convective precipitation, over factors such as microphysical aspects and increased humidity.
Thus, we suggest that the variability in Rg values observed between the four studied sites is due to the location and altitude of each considered site. Moreover, we propose that the differences in Rg values between the dry and the rainy season can be explained by Earth’s translation movement, which during the wet season (corresponding to the summer season in the Southern Hemisphere), induces more radiation because of the higher distance between the Sun and the Earth.
A plot representing the monthly analysis of Rg measurements is shown in Figures 3 and 4 for the peaks of the An and Bn coefficients, respectively. The An coefficient of the dominant periods of solar radiation shows two peaks (of ~ 24 h and ~ 12 h). For all four studied sites, these peaks represent a single frequency due to the yearly rotation of Earth.
Figure 3: Dominant periods (minimum and maximum values) of incoming solar
radiation of the An coefficient at the Center, Chapada, Seplan, and Unicampo sites.
-----
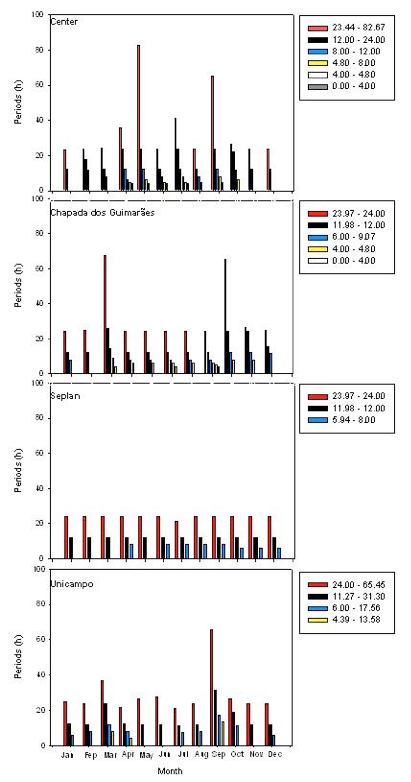
Figure 4: Dominant periods (minimum and maximum values) of incoming solar radiation o
f the Bn coefficient at the Center, Chapada, Seplan, and Unicampo sites.
Similar to An, the Bn coefficient shows the dominance of a 24 h cycle, which makes it very useful to build predictive models.
According to Pinheiro (2007), the error affects the analysis of the peak, because when the error is smaller, the peak has more influence on the signal and the amplitude is more significant.
Pinheiro (2007) obtained four dominant frequencies for the variables studied on a time scale of a day in his study at a forest transition: 24 h, 12 h, 4 h, and 3.4 h. The dominant frequencies found for the sensible heat flux, latent heat flux, and temperature corresponding to the period of 1 day and 12 h were attributed to daily variations of solar radiation due to the rotation of Earth. According to this author, stomatal dynamics arise as the second most important factor allowing understanding the behavior of micrometeorological variables during the day, while other equally important factors also interfere, such as annual cycles and the effect of El Niño on the frequencies. As for seasonality, did not report dependence of Fourier coefficients with the course of the year (Pinheiro 2007). Moreover, Fourier coefficients were lowest during the dry season.
We analyzed the hourly and daily frequency of the solar global radiation and reported our results in Figures 5 and 6, respectively. Wavelet analysis decomposes the time series in terms of time scale and frequency simultaneously, thus providing information on the signal amplitude of any "periodic" in the series and on the variability of this amplitude with time. In these figures, ‘y’ and ‘x’ axes refer to the period in days and to the variance of energy associated with each period, respectively, for the Global Wavelet Power (GWP); and to the present-day periods in the series and to the time in Julian days, respectively, for the Wavelet Power Spectrum (WPS). The color scale in Figures 5 and 6 indicates the power associated with each period of the series. WPS gives the observed amplitude (color levels) over time (x-axis), according to the period (equivalent to the frequency) that contributed to the series. Dashed contours correspond to normalized values of the variance, ranging from 1 to 10, as represented on the horizontal bar. Shaded contours encompass areas with significant variance with respect to the 95% confidence level.
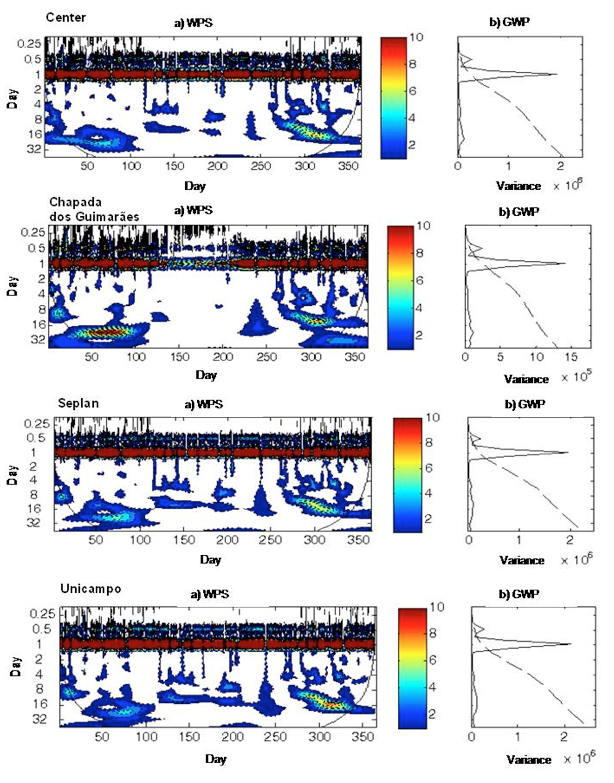
Figure 5: (a) Hourly local Wavelet Spectrum (WPS) of the solar radiation;
(b) Hourly Global Wavelet Spectrum (GWP) at the Center, Chapada, Seplan, and Unicampo sites.
WPS peaks of significant variance are highlighted by a black outline. The region encompassed by this line was called cone of influence (COI). In this region, the edge effect decreases the reliability of the analysis, i.e. periods outside this cone are neglected because they lack an adequate statistical confidence.
Through the GWP of the solar radiation (Figure 5), we can observe, in all four studied sites, a significant peak of 1 day. An important variance was observed in the GWP at the Chapada site. At this site, the WPS had significant powers, temporarily between 50 and 100 days (belonging to the wet season from March to April, with time scales ranging from 16 to 32 days, and between 200-300 days also belonging to the wet season, corresponding to the period from July to November, with the most significant variances ranging from 8 to 16 days for four points. transitioning from hourly to daily analysis,
When transitioning from hourly to daily analysis the wavelets expand and carry only information about the behavior of the great periods corresponding to low frequencies (Furon et al. 2008). Figure 6 presents the analysis of daily applications of wavelets in dimensional scalograms (scale, time and energy intensity) of solar radiation for the Center, Seplan, Unicampo, and Chapada sites.
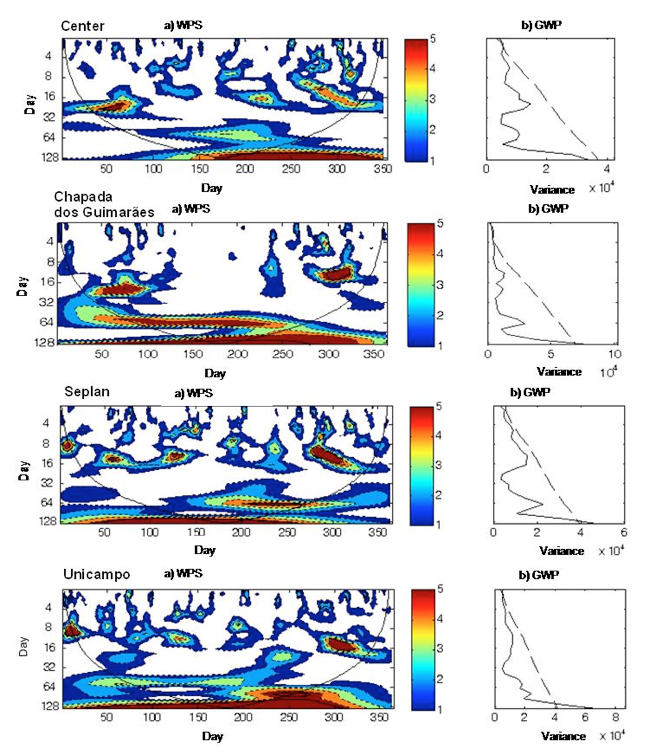
Figure 6: (a) Daily local Wavelet Spectrum (WPS) of the solar radiation;
(b) Daily Global Wavelet Spectrum (GWP) at the Center, Chapada,
Seplan, and Unicampo sites.
Figure 6 also displays the WPS of Rg and shows significant periods of 16 and 32 days with evidence of contours, temporarily located between Julian days 50-100 (February to April, months of the rainy season), in the Center, Chapada, Seplan, and during Julian days 250-300 (September-October, months of the rainy season) at the Center, Seplan, and Unicampo. At the Chapada site, results show another significant period, approximately 64 days long, varying throughout the year mainly in the dry season. Another significant 8-16 days period was observed between the Julian days 100-150 (April-May) in Seplan and Unicampo. The GWP revealed that a significant period and a higher variance stand out at the Chapada and Unicampo sites.
The dominant frequency of 24 h observed in the energy spectrum as well as Global Power, may be due to the daily variation of solar radiation during the period of 1 day because of heat exchange processes. As evidenced by the significant variances, GWP can be associated to the local climate of the considered area. This particular point, where is plate, displays a weakening energy spectrum within 1 day, between Julian days 100 to 200. This could stem from the frequency of the rainfalls evidenced in the micrometeorological analysis, since at the corresponding days, a cover of clouds was present.
The application of both Fourier coefficients and wavelet coefficients revealed that there are some considerable differences between the two types of analyses. Indeed, although the wavelet analysis can compress or de-noise a signal without appreciable degradation, shorter periods would not be identifiable with only use of wavelets. Our results show that Fourier analyses are useful to specifically characterize a less than 1 day-long simple signal, since similar values of dominant periods were obtained even in different types of occupation, probably in relation to the influence of seasons and of the characteristics of the system.
Support was provided in part by Coordenação de Aperfeiçoamento de Pessoal de Nível Superior (CAPES) for Ph.D. scholarship for Maricéia T. Vilani. Thanks to MSc Eduardo Cairo for meteorologicals data.
Angelocci L.R., Pereira A.R., Sentelhas, P.C. (2002). “Agrometeorologia-Fundamentos e aplicações Práticas”. 1.ed., Guaíba/RS: Livraria e Editora Agropecuária Ltda., 475.
Daudechies, I. (1990). “The wavelet transform time-frequency localization and signal analysis”, IEEE Transsactions Information Theory, Barcelona, 36, 961-1004.
Furon, A.C., Riddle, C.W., Smith, R., Warland, J.S. (2008). “Wavelets analysis of wintertime and spring thaw CO2 and N2O fluxes from agricultural fields”. Agricultural and Forest Meteorology, 48, 305-317. doi:10.1016/j.agrformet.2008.03.006
Gomes, F.D., Sanches, L., Alves, M. de C., Nogueira, M. C. de J. A., Nogueira, J. de S. (2012). “The Relationship between Meteorological Variables and Clearness Index for Four Urban/Suburban Areas of Brazilian Cities”. Journal of Environmental Science and Engineering, v. 1, p. 1.
Fu, P. & Rich, P.M. (2002). “A geometric solar radiation model with applications in agriculture and forestry”. Computers and Electronics in Agriculture , Issues 1–3, December, 37, 25–35.
Harter, I.B. (2004). “Rainfall analysis in Pelotas using Wavelet Transform of Morlet”. Dissertation (Post-Graduate in Meteorology), Federal University of Pelotas, Pelotas, 96p.
Jamil Ahmad M. & Tiwari G.N. (2011). “Solar radiation models – A review”. International Journal of Energy Research; 35, 271-290.
Kayano, M.T. & Blain, G.C. (2007). “Análisis de ondeletas de series mensuales de precititación, temperaturas máximas y mínimas mensuales en Campinas”. In: Congreso Venezolano de Agrometeorologia, v.4, Maracay, Anais, Maracay: Svagro, ICD-ROM.
Mellit A., Benghanem M., Kalogirou S.A. (2006). “An adaptive wavelet-network model for forecasting daily total solar-radiation”. Applied Energy; 83, 705–722. doi:10.1016/j.apenergy.2005.06.003.
Pinheiro, M.R. (2007). “Micrometeorological variables of Dominant Frequency of a Northern Transition Forest Mato Grosso”. Cuiabá, Dissertation (Master in Physics and Environmental), University de Mato Grosso, 74p.
Pinheiro, M.R. & Paulo, S.R. (2011). “Use of FOURIER analysis for studying micrometeorological variables of a northern Mato Grosso transition forest”. Acta Amazonica, 41(1), 39-46. http://dx.doi.org/10.1590/S0044-59672011000100005.
Reboita M.S. & Krusche M. (2003). “Climate of southem Brazil described by temperature and precipitation variation periods”. In: Simposio de Cambio Global: hacia uma visión sistêmica, Punta Arenas, Chile. Anais. 94-95.
Rehman, S. & Siddiqi, A.H. (2009). “Wavelet based correlation coefficient of time series of Saudi Meteorological Data Chaos, Solitons and Fractals” 39, 1764–1789. doi:10.1016/j.chaos.2007.06.054
Rossi N.; Masseia, A.; Laignel, B. (2011). “A synthesis of the time-scale variability of commonly used climate indices using continuous wavelet transform”. Global and Planetary Change, 78, 1-13. doi:10.1016/j.gloplacha.2011.04.008
Torrence, C.& Compo, Y.G.P. (1998). “A practical guide to wavelet analysis”. Bulletins of American Meteorological Society, Boston, 79, 61-78.
Torrence, C. & Webster, P. (1999). “Interdecadal changes in the ENSO-monsoon system”. Journal of Climate, Washington, 12, 2679-2690. doi: http://dx.doi.org/10.1175/1520-0442(1999)012<2679:ICITEM>2.0.CO;2
Vitorino, M.I. (2002). “Analysis of intraseasonal oscillations over South America and adjacent oceans using the wavelet analysis”. Thesis (Doctor em Meteorology), Instituto Nacional de Pesquisas Espaciais, INPE, São José dos Campos, 313f.
1. PhD in Enviromental Physics – UFMT. Doctor professor in University of Cuiabá, Master in Environmental Science, Brazil, Av. Beira Rio, 3100, and University Center of Várzea Grande – UNIVAG, Cuiabá, MT, Brazil email: mtvilani@gmail.com
2. PhD in Enviromental Physics - UFMT. Doctor professor in Federal University of Mato Grosso, Department of Sanitary and Environmental Engineering, Brazil. Email: lsanches@hotmail.com
3. PhD in Tropical Agriculture – UFMT. Doctor professor in University of Cuiabá, Master in Environmental Science, Brazil, Av. Beira Rio, 3100, Cuiabá, Brazil email: osvaldo.borges@gmail.com
4. PhD in Geosciences - UNICAMP. Doctor professor in Federal University of Mato Grosso, Department of Florest Engineering. Brazil. Email: gustavomn@gmail.com