Ely Laureano Paiva y Teniza da Silveira
Recibido: 14-04-2010 - Aprobado:
We performed a Confirmatory Factor Analysis (CFA) in order to verify validity and reliability. Different authors have presented several limitations in the traditional Exploratory Factor Analysis method, such as: some items load simultaneously in the factors analyzed, the correlation of some items is not possible to be explained theoretically, Cronbach’s alpha presents limitations under some circumstances, and unidimensionality is checked only after the reliability analysis (Heck, 1998; Ahire et al., 2000; Jiang et al., 2000; Das et al., 2000).
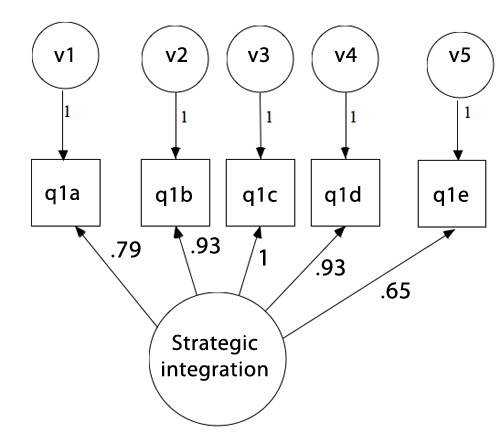
Our analysis is based on three central dimensions: reliability, unidimensionality and convergent validity. We analyzed the constructs through two separate CFA, following a nested approach. According to Burt (1971), this orientation reduces the possibility of a misinterpretation, which can be present in more in complex models. Figures 1 and 2 present the set of items analyzed for the constructs. Figure 1 presents the variables related to Strategic Integration construct. GFI, CFI and NFI present recommendable values (above .97). However, the model presents two aspects that indicate some caution in the construct evaluation: despite chi-square is equal to 16.74, the probability level is significant (.005); also, AGFI and RMSEA are out of the values recommended (.83 and .15). Those results can be related to the relatively small size of the sample (99 cases). Usually, the minimum sample size recommended in this type of analysis is 200 cases (Hair et al., 1998).
Table 3 – General statistics for goodness-of-fit of Figure 1
Stand alone Indices |
|
|---|---|
Chi-Square |
17.35 |
Degrees of Freedom (df) |
5 |
Probability Level |
.004 |
Goodness of Fit (GFI) |
.94 |
Adjusted Goodness of Fit (AGFI) |
.83 |
Standardized RMR |
.04 |
RMSEA |
.15 |
Incremental Indices |
|
Normed Fit Index (NFI) |
.99 |
Incremental Fit Index (IFI) |
.99 |
Comparative Fit Index (CFI) |
.99 |
Figure 1 – Construct of Strategic Integration in the VN
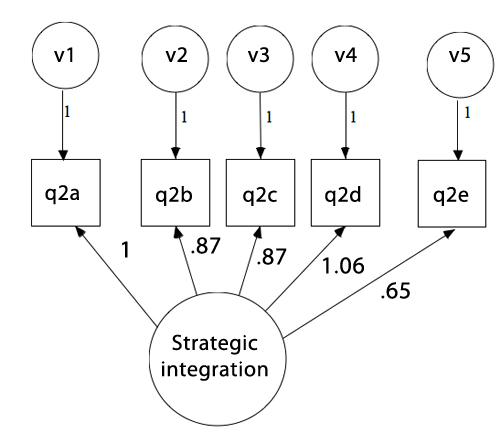
Figure 2 analyzes the construct of Problem-solving Integration. In this case, the model shows a Chi-squared equal to 5.74 and the model is not significant (p<.33) as expected (Hair et al., 1998). GFI, AGFI, CFI and NFI also indicate values above .98, as it is recommended (Figure 2). Convergent validity can be assessed through the individual items loading in both the models. The loading varies from .65 to .93 in the first model. At the same time, items loading are from .65 to 1.06 in the second model. Therefore, the two analysis presented items loading within expected values.
Table 4 – General statistics for goodness-of-fit of the Figure 2
Stand alone Indices |
|
|---|---|
Chi-Square |
5.74 |
Degrees of Freedom (df) |
5 |
Probability Level |
.33 |
Goodness of Fit (GFI) |
.98 |
Adjusted Goodness of Fit (AGFI) |
.93 |
Standardized RMR |
.03 |
RMSEA |
.05 |
Incremental Indices
|
|
Normed Fit Index (NFI) |
.99 |
Incremental Fit Index (IFI) |
1.00 |
Comparative Fit Index (CFI) |
1.00 |
Figure 2 – Construct of Integration in the VN
Based on the validity and reliability analysis, we may identify the two constructs:
- Construct 1: Strategic Information Integration evaluates the extent that manufacturing is integrated to the other activities in the VN in a strategic approach. This integration takes place through the exchange of strategic information during the process of new products/services development. The variables are: manufacturing/supplier (q1a), manufacturing/R&D (q1b), manufacturing/marketing (q1c), manufacturing/services (q1d), manufacturing/customers (q1e).
- Construct 2: Problem-solving Integration evaluates the extent that manufacturing is integrated to the other activities in the VN in an operational approach. This integration takes place through cooperative activities in the VN in order to solve existing problems. The variables are: manufacturing/supplier (q2a), manufacturing/R&D (q2b), manufacturing/marketing (q2c), manufacturing/services (q2d), manufacturing/customers (q2e).
Considering capability as a result from knowledge integration, the extent that manufacturing actions are integrated to a specific activity from the VN indicates a high level of integration with this activity. Therefore, capability creation in this case should be a result from an asymmetric effort. On the other hand, whether companies have the first concern to integrate the VN, we expected similar levels of commitment among all the parts of the VN. We used a paired-means analysis and MANOVA to evaluate the manufacturing’s integration with each part of the VN.
The paired-means T test analyzes the Proposition 1 within the samples from each industry. This test is recommendable when we analyze different variables from the same sample (Malhotra, 1999). In this case, we compared indexes for the variable means from each VN’s activity pair by pair. We used an expanded proposal of the VN, including marketing & sales as an original primary activity (Porter, 1986).
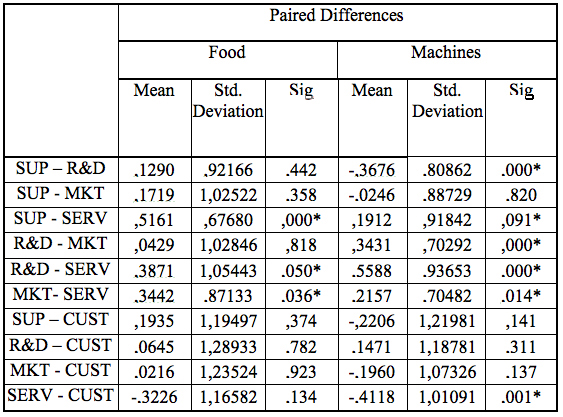
The VN’s parts analyzed were supply (Q1a), R&D (Q1b), marketing & sales ( Q1c), services (Q1d) and customers (Q13e). We evaluate manufacturing’s integration in each one of the VN’s activities, measuring how often manufacturing exchange strategic information with the other VN’s parts. The results presented in the tables below follow two approaches: within the same industry (Tables 5) and cross-industry (Table 6).
The results in the tables 5 and 6 suggest that R&D is a key VN’s activity in the machines industry, comparing with the other VN’s activities such as supply, services and marketing (Table 5).
Table 5 - Paired Samples Test for food industry – Strategic Integration in Food and Machines Industry
Statistically signficant.
On the other hand, this pattern of integration is not identifiable in the food industry. Services seem to deserve a low degree of manufacturing’s integration in both the cases, when we compare it to the other VN´s parts specially in the food industry. This finding suggests that, even service is getting increasing attention as in the three cases presented, this activity does not have received the same level of manufacturing’s commitment comparing to the others VN’s activities in the samples studied. These results confirm the proposition one, indicating asymmetric patterns between manufacturing and other VN´s parts. Specially in machines industry, manufacturing presents higher levels of integration with R&D comparing to other activities.
Table 6 – Manova Test Between-Subjects Effects – Strategic Integration
| Dependent Variable | Means Food | Means Machines | Sig. |
|---|---|---|---|
| SUP | 3.87 |
3.67 |
.342 |
| R&D | 3.77 |
4.01 |
.270 |
| MKT | 3.67 |
3.67 |
.982 |
| SERV | 3.33 |
3.46 |
.550 |
| CUSTOMER | 3.64 |
3.86 |
.344 |
In order to test the second proposition, we used a MANOVA test, comparing the levels of manufacturing integration with each VN’s activity in food and machines industries. The test of variance showed that just R&D presents statistically significant differences. Therefore, the sample characteristics allow MANOVA analysis. The results show that machines industry has a greater level of manufacturing’s integration with R&D comparing to food industry even that it is not statistically significant. This result partiality reinforces the idea of capability creation from R&D and manufacturing integration. Therefore, this result does not confirm the third proposition.
The different levels of environmental dynamism between the two industries studied may explain the asymmetric patterns found in the first analysis. One mature industry, as food, usually presents longer product life cycles comparing to others other more dynamics like machines, especially whether food industry includes commodities products (for instance, in Brazil includes products like rice, soy and flours). The short product life cycles leads R&D from a position of secondary activity to an increasing insertion as a primary activity in the VN. The opposite occurs in a mature industry. Hayes (2002) describes this situation in the new economy context, when product development is increasingly more important than process development. The results showing a weak focus in the service activities may reveal an overemphasis just in existing competencies and a potential negligence in other functions or activities, what may weaken companies’ competitiveness in the future.
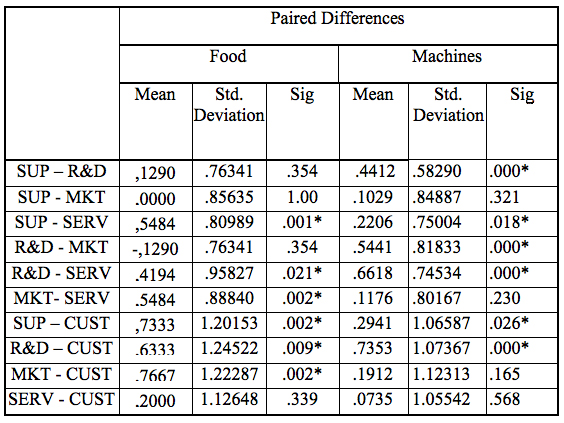
Finally, the last propositions related to the manufacturing integration throughout the VN were analyzed through the specific variables. They measure how often manufacturing interact with the others VN partners in order to solve problem. (Q2a, Q2b, Q2c and Q2d). We include also a variable to evaluate the level of interaction between manufacturing and customers (Q2e).
Table 7 - Paired Samples Test for Food and Machines Industry –
Opertional Integration in Food and Machines Industr
Statistically signficant.
Comparing the integration patterns in the VN´s activities into each industry and between them, closed results were found. Food industry has the same levels of manufacturing commitment for problem solving in any part of the VN, while machines industry has a clear focus in manufacturing and R&D. At the same time, manufacturing and marketing is in the same level of integration comparing with the other VN´s parts. A test of variance did not show any difference between the samples’ variables in order to perform a MANOVA analysis. Again, the results suggest that in machines (more dynamic industry), manufacturing and R&D are more integrated comparing to food industry.
Table 8 – MANOVA Tests Between Food and Machines Industries
| Dependent Variable | Means Food | Means Machines | Sig. |
|---|---|---|---|
| SUP | 3.90 |
3.809 |
.652 |
| R&D | 3.800 |
4.250 |
.015* |
| MKT | 3.933 |
3.706 |
.270 |
| SERV | 3.367 |
3.588 |
.313 |
| CUSTOMER | 3.167 |
3.515 |
.136 |
(*) Statistically significant.
Based on the results presented, we may state that there is not a clear evidence that asymetric integration along the VN’s parts or focus in a external or internal part of the VN are the company’s orientation in order to create their capabilities. Therefore, a complementary view between external and internal networks may be more indicated when we analyzed capability creation along the VN. Manufacturing and R&D are highly integrated in more dynamic situations, which indicates the need for constant new products development.
Even that manufacturing and marketing integration is considered a key aspect for capability creation,, the results suggest that this is not a priority compared to the levels of integration with other activities from the VN in the sample analyzed. Also, services were not highly integrated to manufacturing and this fact is a potential cause of loss of competitiveness whether these companies keep this orientation. Therefore, although literature have stressed the importance of manufacturing and marketing integration, the results suggest that still there is a lack of integration between these two areas when compared to manufacturing and R&D integration.
A limitation of this study is that the results are based on data from one source in each company, and this can be a source of bias in the results. For further research, we suggest the measurement of the impact of the knowledge integration in the VN on organizational performance what allows to access objectively the competitiveness. Additionally, it can be further investigated what type of managerial approaches such as integrated incentive systems, IT technologies or work teams can be adopted to reduce the lack of integration between manufacturing and marketing. Finally, we consider that the need of exploring manufacturing/marketing interface and practice is still present.
Abernathy, W. J. (1976); “Production Process Structure And Technological Change”, Decision Sciences, 7, 607-619.
Brandenburger, A.M.; Stuart Jr., H.W. (1996); “Value-Based Business Strategy”, Journal of Economics & Management Strategy, 5(1), 5-24.
Choi, T.Y.; Hong, Y. (2002); “Unveiling The Structure of Supply Networks: Case Studies in Honda, Acura, and Daimlerchrysler”, Journal Of Operations Management, 20(5).
Crittenden, V. L. (1992); “Close The Marketing/Manufacturing Gap”, Sloan Management Review, Spring, 33(3), 41-52.
De Toni, A.; Forza, R.F., (1992); “Manufacturing Strategy In Global Markets: An Operations Management Model”, International Journal of Operations & Production Management, 12(4), 7-18.
Fine, C. H. (2000); “Clockspeed-Based Strategies for Supply Chain Design”, Production And Operations Management, 9(3), 213-221.
Ghemawat, P. (2000); Strategy and the Business Landscape; New York; Prentice Hall, 176 p.
Grant, R.M. (1996); “Prospering In Dynamic-Competitive Environments: Organizational Capability As Knowledge Integration”, Organization Science, 7(4), 375-387.
Hayes, R.H. (2002); “Challenges Posed to Operations Management by The New Economy”, Production And Operations Management, 11(1), 21-32.
Hayes, R.H.; Pisano, G.P. (1996); “Manufacturing Strategy: at The Intersection of Two Paradigm Shifts”, Production And Operations Management, 5 (1), 25-41.
Hausman, W.; Montgomery, D.; Roth, A. (2002); “Why Should Marketing and Manufacturing Work Together? Some Exploratory Empirical Results”, Journal Of Operations Management, 20 (3), 241-257.
Huang, J.; Newell, S. (2003); “Knowledge Integration Processes and Dynamics within the Context Cross-Functional Projects”, International Journal of Project Management, 21 (3), 167-176.
Hutt, M. D.; Speh, T. W. (1984); “The Marketing Strategy Center: Diagnosing the Industrial Marketer’s Interdisciplinary Role”, Journal of Marketing, 48 (4), 53-61.
Instituto Brasileiro De Geografia e Estatística. 1999, Industrial Data – 97/98.
Kohli, A. K.; Jaworski, B.J. (1990); “Market Orientation: The Construct, Research Propositions, and Managerial Implications”, Journal of Marketing, 54,1-18.
Kohli, A. K.; Jaworski, B. J.; Kumar, A. (1993); “Markor: A Measure Of Market Orientation”, Journal of Marketing Research, 30 (4), 467-477.
Lawrence, P. R.; Lorsch, J. W. (1986); Organization and Environment: Differentiation and Integration; Boston, MA; Harvard Business Press Books, 279 p.
Liebeskind, J.P. (1996); “Knowledge, Strategy, and The Theory of the Firm”, Strategic Management Journal, 17 (Special Issue), 93-107.
Malhotra, N. K. (1999); Marketing Research: An Applied Orientation; Upper Saddle River, NJ; Prentice Hall Inc., 825 p.
Malhotra, M.K. ; Sharms, S. (2002); “Spanning The Continuum Between Marketing And Operations”, Journal Of Operations Management, 20(3), 221-240.
Maltz, E.; Kohli, A. (2000); “Reducing Marketing’s Conflict With Other Functions: The Differential Effects of Integrating Mechanisms”, Journal of The Academy of Marketing Science, 28(4), 479-492.
Mendelson, H.; Pillai, R. R. (1999); “Industry Clokspeed: Measurement and Operational Implications”, Manufacturing & Service Operations Management, 1(1), 1-20.
Narver, J.C.; Slater, S.F. (1990); “The Effect of a Market Orientation on Business Profitability”. Journal of Marketing, 54 (4), 20-35.
Nonaka, I.; Konno, N. (1998); “The Concept Of “Ba”: Building A Foundation for Knowledge Creation”, California Management Review, 40(3), 41-53.
O’Leary-Kelly, S.; Flores, B. (2002); “The Integration of Manufacturing and Marketing/Sales Decision: Impact On Organization Performance”, Journal Of Operations Management, 20(3) 221-240.
Oliver, A. L.; Liebeskind. J. P. (1997); “The Levels of Networking For Sourcing Intellectual Capital in Biotechnology”, International Studies of Management & Organization, 27 (4), 76-103.
Parente, D.H. (1998); “Across the Manufacturing-Marketing Interface: Classification of Significant Research”, International Journal Of Operations And Production Management, 18(12), 1205-1222.
Porter, M. E. (1986); Competitive Advantage; New York, NY; Free Press, 559 p.
Roth, A.; Marucheck, A.S.; Kemp, A.; Trimble, D. (1994); “The Knowledge Factory for Accelerated Learning Practices”, Planning Review, 22 (3), 26-33.
Shapiro, B. P. (1977); “Can Marketing And Manufacturing Coexist?”, Harvard Business Review, 55 (2), .104-114.
Skinner, W. (1969); “Manufacturing - Missing Link In Corporate Strategy”, Harvard Business Review, 47 (3), 5-14.
Slater, S.F.; Narver, J.C. (1994); “Does Competitive Environment Moderate The Market Orientation-Performance Relationship?”, Journal of Marketing, 58 (1), 46-55.
Song, M.; Montoya-Weiss, M.; Schmidt, J. (1997); “Antecedents and Consequences of Cross-Functional Cooperation: A Comparison of R&D, Manufacturing, and Marketing Perspectives”, Journal Of Product Innovation Management, 14 (1), 35-47.
Stalk, G.; Evans, P.; Shulman, L. (1992); “Competing on Capabilities: The New Rules of Corporate Strategy”, Harvard Business Review, 70 (2), 57-69.
Swamidass, P.; Baines, T.;Darlow, N. (2001); “The Role of Manufacturing and Marketing Managers In Strategy Development”, International Journal Of Operational & Production Management, 21(7), 933-948.
Swink, M.; Narasimhan, R.; Wang, C. (2007); “Managing Beyond the Factory Walls: Effects of Four Types of Strategic Integration on Manufacturing Plant Performance”, Journal of Operations Management, 25(1), 148-164.
Tapscott, D. (1999), Creating Value In The Network Economy; Boston, MA; Harvard Business Press Books, 288 p.
Teece, D.; Pisano, G.; Shuen. A. (1997); “Dynamic Capabilities and Strategic Management”, Strategic Management Journal, 18(7), 509-533.
Venkatraman, N.; Subramaniam, M. (2001); Theorizing The Future of Strategy: Questions For Shaping Strategy Research in The Knowledge Economy, en: The Handbook of Strategy and Management; London, England; Sage Publications, 461-474.
Viceconti, P.E. (1977), O Processo De Industrialização Brasileira, Revista De Administração De Empresas, Novembro/Dezembro, 1977, P 33-43.
Wheelwright, S.C. (1984); “Manufacturing Strategy: Defining the Missing Link”, Strategic Management Journal, 5 (1), 77-91.
Wheelwright, R.; Hayes. R.H. (1985); “Competing through Manufacturing”, Harvard Business Review, 63 (1), 99-109.
Wise, R.; Baumgartner. P. (1999); “Go Downstream”, Harvard Business Review, 77(5), 133-141.
Zahra, E.; Das, S.R. (1993); “Innovation Strategy and Financial Performance In Manufacturing Companies: An Empirical Study”, Production and Operations Management, 2(1), 15-37.
Itens
Q1a – Indicate how often manufacturing exchange strategic information related to new products or services with Suppliers
Q1b - Indicate how often manufacturing exchange strategic information related to new products or services with R&D
Q1c - Indicate how often manufacturing exchange strategic information related to new products or services with Marketing and Sales
Q1d - Indicate how often manufacturing exchange strategic information related to new products or services with Services
Q1e - Indicate how often manufacturing exchange strategic information related to new products or services with Customers
Q2a - Indicate how often manufacturing develops cooperative activities for problem solving with the Suppliers
Q2b - Indicate how often manufacturing develops cooperative activities for problem solving with the R&D
Q2c - Indicate how often manufacturing develops cooperative activities for problem solving with the Marketing and Sales
Q2d - Indicate how often manufacturing develops cooperative activities for problem solving with the Services
Q2e - Indicate how often manufacturing develops cooperative activities for problem solving with the Customers
Scale
| Never | Rarely | Sometimes | Frequently | Always |
|---|---|---|---|---|
1 |
2 |
3 |
4 |
5 |
Vol. 32 (1) 2011
[Índice]