1. Introduction
Investment is an important matter which brings about development and advancement to all countries.While investment is injected into proper areas it will be valuable otherwise it will be useless. Stock market is one of the proper areas for investment (Mehrghan, 2004). In the modern world, economic development owes everything to stock market and activities of capital market. Stock market is an official and organized market in which the bonds accepted in it are traded between buyers and sellers based on specific rules. Regarding vast volume of transactions, stock market is considered to be among the main investment centers. Thus the extent of accepted companies in stock market somehow brings about astonishment among investors(Shahrabadi, 2010).
Correct evaluation of companies in industries can reflect the status of different companies in relation to their rivals, specify pros and cons, opportunities and threats of companies. Firm evaluation plays prominent role in industry. Investors are always looking for the best area to invest in order to gain more interests. Thus they always try to evaluate and separate successful and unsuccessful companies. Regarding the weak performance of ranking approaches adopted in Tehran stock market, offering an efficient,reliable and capable approach is matter of tremendous importance (Danesh Shakib and Fazli, 2009).
The DEA approach is an important technique through which relative efficiency evaluation of companies is achieved. This approach can be offered to investors for decision making. The DEA approach is a technique which utilizes several inputs to produce several outputs and by which they can obtain varioustypes of efficiency such as assignment and technical efficiency and so on to the companies. Using this approach also they can determine whether the development of the firm has been successful or the firm should reduce the volume of its activities in the current situation. This circumstance can be determined through increasing return to scale or decreasingreturn to scale which determined by DEA (Banker and Cooper, 1984).
However the DEA approach has some fundamental problems which has been result in at most cases not to be dependable(Mansoury and salehi, 2011). Hence in this paper through TOPSIS approach which is one of the best for decision making, we have tried to overcome inadequacies and consequently offer the most efficient approach to grading companies through integration of techniques.
2. Research backgrounds
Duzakin and Duzakin (2007) in his research has tried to evaluate the performance of different industrial sections of Turkey. In this research 3 factors such as net assets, number of employees and gross added value are used as the input and two factors of the interest prior to cutting taxes and export revenues of each section were used as the output for evaluation for all the companies and also the companies present in each industry. The results indicated that during 2003 only 65companies from among all the companies hadoperated efficiently. 278 companies have also been identified as the most inefficientcompanies that hadworked far less than average. Other research conducted under the title of utilizing the DEA approach in selecting bonds in a big market by Aparicio and et al (2005). This research offers a DEA technique to choose portfolio or proper bonds out of a list of 185 cases. This selection process includes application of research in operations and reflects efficiency of decision making units. This analysis considers appropriateness of many ratios in relation to stocks such as income efficiency and risk.
The result revealed that out of 185 stocks were analyzed, 14 were considered more appropriate and fromamong these 14 efficient stocks several were resistant to inappropriate changes while the rest were not. In this paper the Duk and Canon companies were among the ones with high rate efficiency. In the United States a research was conducted by Redman and et al (2000) on seven portfolios by means of SHARP indices, Trainor and Jensen's alpha. The results of their research during two periods of time; 1985- 1989 & 1990- 1994 showed that the ranking obtained from two criteria of SHARP and Trainor for 4 portfolios is identical. This fact showed that the results obtained are similar to the total risk and the systematic risk. Thus the total risk was close to systematic one. In their research, Johnson and Soenen (2003), concluded that there are meaningful relationship between rankingcompanies based on performance criteria of economic added value, ratio of SHARP and Jensen's alpha and some other financial criteria such as firm size, the ratio of asset value to the value of stock market, growth of sale rate, capital structure, liquidity, cash cycle, profitability changes and the rate of the efficiency of assets. Another study was conducted by Mohanrom (2204) whichtitled separating successful companies from unsuccessful ones.
The resultsindicated that the strategy of combining fundamental signs for companies with office value at the market with low value could lead to unconventional efficiency. A research was implemented by Sabetisaleh (2009) under the title of "Offering fuzzy multi-criteria decision making model in order to grade thecompaniesto be applied for financial support from banks. In the present paper the researcher has tried to identify the most important indices having an impact on firm stock from the viewpoint of credit assigner (banks and financial institutions) and rate top 50 stocks in Tehran's stock market through the fundamental analysisin fuzzyenvironment.
Thus the researcher has put forward a comprehensive model for choosing appropriate options for financial support from banking point of view. Therefore the researcher in the first step of their studies utilized the analysis approach for the main factors (questionnaire issued to stock experts) to identify fundamental indices having an impact on ranking stock and in order to analyze the questionnaire, non-parametric approach utilized. In the next step the researcher took advantages of fuzzy ANP technique to determine the value of identified indices. In this step viewpoints of stock experts about importance of indices and their value were solicited through questionnaire.
Finally after gathering the data relevant to fundamental indices, identified 50top companies in Tehran stock market,the TOPSIS technique has been employed in order to rate and determine their credit priorities. Regarding the results obtained from this research;Mines & Industries Firm ranked at top, Egtesade novin Bank at second, Mehvarsazan firmat third and Saipa Dizel firm stood at50thpositions. Saeed Samadi et al. studied the relationship between development of economic markets and economic growth in Iran and 13 other countries during the years of 1988- 2003 through three approaches; Granger, ARDL test and the approach of estimating Panel Data.
Estimating causality relationship between the size of stock market and production growth indicated that bank and stock market in Iran do not have considerable effect on economic growth. However the effect of economic growth on stocks is positive and meaningful. The results showed thatin all countries,which studied, in very real sense investment and work force status have a positive and meaningful effect on economic growth. In the monetary section the effect of banks is positive and meaningful. Although the effect of stock on economic growth was positivebut wasn'tconsiderably meaningful. The results of ARDL test for Iran between the years 1976 – 2003 indicated that there isn't long term positive relationship between financial markets and economic growth.
Generally long term relationship between financial market and economic growth wasnegative which means that there is no long term meaningful relationship between capital market and economic growth. Mohammad rasti (2009)surveyed Patrick hypotheses ,the causal relationship of economic development and growth, by means of economical measuring techniques and time series such as credibility tests, and Granger causality in 1959 to 1996.Patrick has introduced two hypothesesin this respect. The first hypothesis called "supply leading" maintains that chronically development of financial sector is prior to economic development. The second hypothesis called "demand following" of economic growth is the reason for economic development.
The theory of supply leading was rejected in Iran's economy and the theory of demand following was accepted instead. In fact, in the process of economic development and growth the country has had a passive role. It has not had the necessary potentials to help raise Iran's economic growth and somehow has been depended on economic growth. Reza Rafiee (2008) has evaluated the effect of financial mediators on economic growth and thus applied an intuitive growth pattern by means of auto- regressive. The results obtained from the pattern indicated that the relationship between financial intermediaries and economic growth in Iran is negative and the impact on Iran's economic growth is meager and there is not a tight relationship between financial intermediaries and economic growth in Iran.
2.1 The DEA model
The DEA approach is one of the basic non-parametric approaches which is employed to measure efficiency and productivity of units. The DEA is a linear programming technique to evaluate decision making units having homogeneous inputs to yield homogeneous outputs. In this approach an identical production curve of observed points in the comparison group is obtained which indicates efficiency frontier for group and efficiency of other units in relation to this frontier of efficiency is measured. DEA considers the most appropriate weight for each decision making unit. That is a set of weights which maximize efficiency of adecision making unit without raising efficiency of other decision making units. In other words DEA helps decision makers to classify decision making units into two groups of efficient and inefficient units (daily and demt, 2007).
Generally the DEA analytic models are divided into two groups of input-oriented and output-oriented. Input-oriented models are those that utilize given input to obtain the maximum amount of output butoutput-oriented models obtain lessinput without any change in output rate.(Momeni, 2010).
In this paper the input-oriented CCR model is used. In an input-oriented model a unit is inefficient if the possibility of raising each one of the outputs will exist without raising an input or reducing an output. A unit is efficient only when the case mentioned above cannot happen.Efficiency of less than one for a unit means that linear combination of other units can create the same output by utilizing less input.
An output-oriented model conveys this meaning more assertively. A unit under examination is efficient only when no convex combination out of theother units

can produce more output in relation to the unit under examination by consuming same resources (inputs). Parameter , as defined at bottom, indicates relative reduction of the inputs of objective unit while output is steady. This reduction is simultaneously applied to all inputs and leads to radial movement in the direction of the level under cover and consequently in order to rationalize the units under examination on image of the border, it determines slack variables in a way so that the point of objective unit is driven towards the image on the border. There must be the following conditions:
- The value of must equal one.
- All slack variables must equal zero (Cooper, 1999).
Primary multiple output-oriented model of BCC is according to the following:

2.2 TOPSIS model
This model was proposed by Hwang yoon in 1981. This model is one of the best multi-criteria decision making models which is used more often. In this model m optionsby n indices evaluates. This model is based on the notion that the options must have the least distance with the positive ideal and the most distance with the negative ones. The solution process through this model requires the six following steps:
1. Identifying scaleless Matrix (N): Scale less matrix will be obtained bymaking scale less norm.

2. Defining normalized Matrix (V): Normalized scale less matrix will obtained multiplication of Matrix (N) and weight matrix ( ) as following:

In order to obtain normalized scale less matrix, it is essential to consider indices. For this purpose we computed the weights of indices by means of shannon entropy. These weights obtained through the following steps:

3. Integrating DEA and TOPSIS
As mentioned before the DEA techniques regardless of its orientation tries assign the maximum or minimum value to Ui and Vj, regardless of their initial values,accomplish the best value for objective function and asclearly realizable objective function demonstrate the DMUs' various efficiencies. This means that DEA analysis does not consider theinitial values of inputs and outputs variables thus the final value of objective function will be questionable. Solving this dilemma in this study we used TOPSIS's to consider initial values of inputs and outputs variables. Since the final ranking of alternatives will take advantage of sustainability.
4. Research Design
In this section we deal with analytic model of the research first and then describe research variables separately according to input and output.
4.1. Research Model
This research is conducted toattain a foundation for ranking cement's companies in Tehran stock market. The number of active cement companies in stock market is 28 which operateduring the years 2008- 2012. In order to rate the companies through DEA model, efficiency of each unit has been measured. Since there are a lot of defects in DEA model and as mentioned before it may give incorrect values to the input and output variables and thus produce unreal efficiency. Therefore in order to overcome this obstacle and control the values, we have employed the TOPSIS modelwith above mentioned specifications. Consequently the analytic model of the research is as follows:

After combining DEA model with TOPSIS, through LINGO release 12, we extract efficiency of each firm. The efficiency obtained through the combination of these two models with respect to removing the defects, is more reliable than the efficiency obtained from implementation of each model separately.
4.2. Research variables
Regarding the fact that in this research DEA model has been employed, we defined some effective variables as input and output. Output included average values of 1to 5 year Return On Investment (ROI) and the last dividends for each which all investor demand high rates for thesetwo ratios. The ratio of price to income and sigma tolerance are considered as input since these are those factors that any investor may pay close attention in order to invest on any share.
The investor willdemand these ratios to be at the least possible rate. In this research we consider interests as output and costs as input. The following table demonstrate descriptive form of input and output variables.
Table 1. Descriptive form of input and output variables
Variables |
classification |
Definition |
Average of 5 year efficiency Dividends of stock Ratio of price to income 5 year sigma |
Output Output Input input |
The mean of efficiency in 5 years as percent Ratio of income to the number of stocks left Price of stocks divided by income according to stocks 5 year division of efficiency standards |
5. Data analysis
We used the following methods so that the research has a high level of credibility
- DEA model with variable efficiency in relation to the CCR scale.
- The integrative TOPSIS-DEA model based on steady weights.
- The integrative TOPSIS-DEA model based on variable weights.
5.1. DEA model with variable efficiency in relation to the CCR scale.
In this model which is also known as traditional –DEAapplied to calculate efficiency of any DMU. For this purpose Win4deep was utilized and the following results extracted:
Table.2 calculated efficiency in the integrative model TOPSIS-DEA based on fixed |
||
Efficiency |
Company Cement |
Row |
1 |
Hormozghan |
1 |
1 |
Khazar |
2 |
0.809 |
Urmia |
3 |
0.413 |
Bojnourd |
4 |
1 |
Kordestan |
5 |
0.768 |
Behbaha |
6 |
0.639 |
Sofiyan |
7 |
0903 |
Tehran |
8 |
0.908 |
Shomal |
9 |
0.576 |
Doroud |
10 |
0.812 |
Sepahan |
11 |
0.700 |
Heghmatan |
12 |
1 |
Kerman |
13 |
0.755 |
Fars & Khozestan |
14 |
0.558 |
Shahroud |
15 |
0.089 |
Gharb |
16 |
0.798 |
Sefide Neyriz |
17 |
0.194 |
Fars |
18 |
1 |
Dashtestan |
19 |
0.717 |
Shargh |
20 |
0420 |
Ardabil |
21 |
0.296 |
Esfahan |
22 |
0.710 |
Ghaen |
23 |
1 |
Khash |
24 |
1 |
Darab |
25 |
0.654 |
Ilam |
26 |
1 |
Karoun |
27 |
0.516 |
Mazandaran |
28 |
|
|
|
|
|
|
0.723 |
Average |
|
As shown at then table above there many companies that graded as the most efficient companies with the high efficiency.
5.2. TOPSIS fixed weight and efficiency
As mentioned above we utilized TOPSIS model to weigh all input and output variables then by multiplication of any input and output weight vector to input and output of any firms respectively and entering them to simple following efficiency( ) formula we achieved efficiency of any DMU with fixed weight algorithm.
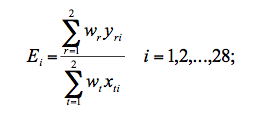
The following table demonstrate TOPSIS weights for any input and output variables.
Table 2. Input and output weight extracted of TOPSIS model |
||||
Variables |
Average of 5 year ROI |
Last dividends of each stock |
Price to income |
sigma risk |
weights |
0.1624 |
0.1876 |
0.4459 |
0.242 |
After obtaining weights of the variables as mentioned above the companiesefficiency separately computed the result summarized at table3.
Table.3 calculated efficiency in the integrative model TOPSIS-DEA based on fixed |
||
Efficiency |
Company Cement |
Row |
0.7439 |
Hormozghan |
1 |
1 |
Khazar |
2 |
0.424609 |
Urmia |
3 |
0.166734 |
Bojnourd |
4 |
0.94164 |
Kordestan |
5 |
0.513789 |
Behbaha |
6 |
0.289572 |
Sofiyan |
7 |
0.757516 |
Tehran |
8 |
0.493609 |
Shomal |
9 |
0.460241 |
Doroud |
10 |
0.735401 |
Sepahan |
11 |
0.203676 |
Heghmatan |
12 |
0.394194 |
Kerman |
13 |
0.414685 |
Fars & Khozestan |
14 |
0.311293 |
Shahroud |
15 |
0.023465 |
Gharb |
16 |
0.259974 |
SefideNeyriz |
17 |
0.095822 |
Fars |
18 |
0.334233 |
Dashtestan |
19 |
0.34338 |
Shargh |
20 |
0.117884 |
Ardabil |
21 |
0.09125 |
Esfahan |
22 |
0.168521 |
Ghaen |
23 |
0.19036 |
Khash |
24 |
0.154121 |
Darab |
25 |
0.087921 |
Ilam |
26 |
0.621029 |
Karoun |
27 |
0.149455 |
Mazandaran |
28 |
Because of exceeding some efficiencies from one we divided all efficiency to the maximum efficiency value to be able compare the result with other methods consequences.
5.3. Integrated TOPSIS-DEA considering confidence level
One problem with above mentioned efficiency calculation model is that there is always the possibility of changes in weight (regarding changes of theexperts sample) then the obtained weights may differsignificantly.This error may result in miss efficiency computation respectively. Thus it is essential to utilize statistical confidence interval techniques to remove thedefect and control all weights. As we remember the primary weight of variables determined by 12 industry experts and then the standard deviation of weight also computed to conduct confidence level for input and output variables weigh in DEA Analysis; the result summarized as following:

Having determined this range for each weights, input and output will be controlled at the favorite levelof confidence. Thus the results obtained through this modelwill have more reliability than previous models.
In this case the integrative model will be as follows;

Having formulated all of 28 companiesusing above mentioned modeland utilizing the LINGO.12 software, the following results were obtained:
Table.4 DMUs efficiency using integrated TOPSIS-DEAModel |
||
Efficiency |
Cement Company Name |
Row |
1 |
Hormozghan |
1 |
0.987961 |
Khazar t |
2 |
0.731945 |
Urmia |
3 |
0.348197 |
Bojnourd |
4 |
1 |
Kordestan |
5 |
0.589024 |
Behbaha |
6 |
0.615926 |
Sofiyan |
7 |
0.44318 |
Tehran |
8 |
0.965706 |
Shomal |
9 |
0.731557 |
Doroud |
10 |
0.769046 |
Sepahan |
11 |
0.562896 |
Heghmatan |
12 |
0.994599 |
Kerman |
13 |
0.620087 |
Fars & Khozestan |
14 |
0.558362 |
Shahroud |
15 |
0.580343 |
Gharb |
16 |
0.125003 |
SefideNeyriz |
17 |
0.19323 |
Fars |
18 |
0.909293 |
Dashtestan |
19 |
0.545744 |
Shargh |
20 |
0.99602 |
Ardabil |
21 |
0.286309 |
Esfahan |
22 |
0.581399 |
Ghaen |
23 |
0.879213 |
Khash |
24 |
1 |
Darab |
25 |
0.61277 |
Ilam |
26 |
0.994925 |
Karoun |
27 |
0.495934 |
Mazandaran |
28 |
As shown at the table above, among 28 companies only 3 have maximum efficiency equal to 1 and Sefide Neyriz with 0.125003 efficiencylevel located at the bottom.
6. Result Analysis
As observedin previous sections wehave calculated selected companies efficiency by three fairly different ways. Now it is time to compare the result of them and conclude which of them have greater validity among them. For this purpose at the firs step the differences in efficiency by three ways compared. Facilitating analysis the result classified at three section:
- Traditional–DEA
- Integrative TOPSIS-DEA method consideringfix weight
- Integrative TOPSIS-DEA method considering confidence interval
Then we operated to differences calculation. The differences among three type of analysis depicted in table 5.
Table5. differences of efficiency |
||||
C-B |
A-C |
A-B |
Company |
Row |
0.256100195 |
0 |
0.256100195 |
Hormozghan Cement |
1 |
-0.0120393 |
0.0120393 |
0 |
Khazar Cement |
2 |
0.307335544 |
0.077055 |
0.384390544 |
Cement Urmia |
3 |
0.181463045 |
0.064803 |
0.246266045 |
Bojnourd Cement |
4 |
0.058360065 |
0 |
0.058360065 |
Kordestan Cement |
5 |
0.075235034 |
0.1789762 |
0.254211234 |
Behbaha Cement |
6 |
0.326353907 |
0.0230744 |
0.349428307 |
Sofiyan Cement |
7 |
-0.31433635 |
0.4598205 |
0.14548415 |
Tehran Cement |
8 |
0.472096581 |
-0.0577058 |
0.414390781 |
Shomal Cement |
9 |
0.271316214 |
-0.1555569 |
0.115759314 |
Doroud Cement |
10 |
0.033644656 |
0.0429544 |
0.076599056 |
Sepahan Cement |
11 |
0.35922065 |
0.1371038 |
0.49632445 |
Heghmatan Cement |
12 |
0.600404332 |
0.0054015 |
0.605805832 |
Kerman Cement |
13 |
0.205401857 |
0.1349129 |
0.340314757 |
Fars & Khozestan Cement |
14 |
0.247068213 |
-0.0003615 |
0.246706713 |
Shahroud Cement |
15 |
0.556878772 |
-0.4913434 |
0.065535372 |
Gharb Cement |
16 |
-0.134970709 |
0.6729972 |
0.538026491 |
SefideNeyriz Cement |
17 |
0.097407652 |
0.00077 |
0.098177652 |
Fars Cement |
18 |
0.575059873 |
0.0907074 |
0.665767273 |
Dashtestan Cement |
19 |
0.202364653 |
0.1712558 |
0.373620453 |
Shargh Cement |
20 |
0.878136157 |
-0.5760199 |
0.302116257 |
Ardabil Cement |
21 |
0.195059254 |
0.0096909 |
0.204750154 |
Esfahan Cement |
22 |
0.412878262 |
0.128601 |
0.541479262 |
Ghaen Cement |
23 |
0.688853039 |
0.1207874 |
0.809640439 |
Khash Cement |
24 |
0.845879349 |
0 |
0.845879349 |
Darab Cement |
25 |
0.524848716 |
0.0412304 |
0.566079116 |
Ilam Cement |
26 |
0.373895299 |
0.0050755 |
0.378970799 |
Karoun Cement |
27 |
0.346479165 |
0.020066 |
0.366545165 |
Mazandaran Cement |
28 |
Comparing the results shows that there are considerable differences between the efficiency evaluated through three mentioned methods. The significant difference rise a question that which of themtake advantage of high validity. The answer to this critical question can be given only by focusing on foundation and structure of three models.
As mentioned before the DEA techniques regardless of its orientation tries assign the maximum or minimum value to and accomplish the best value for objective function and as clearlyrealizable, objective function demonstrate the DMUs'efficiencies. This means that DEA analysis does not consider the initial values of inputs and outputs variables and it may be some inputs or outputs with low value get greater than their worth.Thusthe final value of objective function will be questionable. Solving this dilemma in this study we used TOPSIS's 'sweightsto consider initial values of inputs and outputs variables. But as explained before using fixed mean weights due to expertteam ideas will be unsteady since any changes among experts or selecting new expert team will result in new weights and thereinafter new efficiency. But setting confidence interval for weights according to experts idea remove bothdifficulties. Thus third model take advantages of great sustainability against other two models.
Furthermore regarding what was mentioned above in this research the Kolmogorov-Smirnov test was employed to test unity distribution of difference. The results concerning the difference of efficiency are as follows:
a) Comparison of the results obtained from prioritizing DEA and integrative method TOPSIS-DEA based on fix weights according to Kolmogorov-Smirnov test revealed that distribution of differences in these two methods is significantly different (α<0.05). This means that ranking by to model does have considerable differences at 95 percent confidence level.
b) Comparison of the results obtained from prioritizing DEA and integrative TOPSIS-DEA based on confidence level according to Kolmogorov-Smirnov test showed that distribution of differences in these two methods is significantly different (α<0.05). This means that ranking by to model doesnot have unity distribution and have considerable differences at 95 percent confidence level.
C) Comparison of the results obtained from prioritizing TOPSIS-DEA based on fix weights and TOPSIS-DEA finding based on confidence level according to Kolmogorov-Smirnov test showed that distribution of differences in these two methods don't have significantly differences (α>0.05). This means that ranking by two models does not have considerable differences at 95 percent confidence level.
7. Conclusion
Weighing and ranking all companies in stock exchange market is advantageous to many organization people and companies president, investor, credit assigner and so on. In this paper we suggested three way to weighing and ranking companies. As mentioned before the reliability and infrastructure organization of integrative DEA-TOPSIS based on confidence level is highly dependable. However, comparison of differences between two integrative model didn't show significant difference but this doesn't mean these model have same value in ranking and weighing companies since volatile of result in fix weight approach due to expert team considerably affects the result; this difficulty not only takes the finding under question but also may change the result of comparison between two integrative model consequences.
Finally we propose that integrative DEA-TOPSIS model to weighing and ranking of DMUs rather than two other models.
References
- Aparicio, J., Ruiz, J. L., & Sirvent, I. (2005). Closest targets and minimum distance to the efficient frontier in DEA. Centro de Investigación Operativa, Universidad Miguel Hernández de Elche.
- Banker, R. D., Charnes, A., & Cooper, W. W. (1984). Some models for estimating technical and scale inefficiencies in data envelopment analysis. Management science, 30(9), 1078-1092.
- Cooper, W. W., Park, K. S., & Pastor, J. T. (1999). RAM: a range adjusted measure of inefficiency for use with additive models, and relations to other models and measures in DEA. Journal of Productivity Analysis, 11(1), 5-42.
- DaneshShakib, M.&Fazli, S. (2009). Rating cement firms in Tehran stock market using integrative approach (TOPSIS_AHP), Cheshmandaz –e-Modiryat, 32(3), 109-129.
- Düzakın, E., & Düzakın, H. (2007). Measuring the performance of manufacturing firms with super slacks based model of data envelopment analysis: An application of 500 major industrial enterprises in Turkey. European Journal of Operational Research, 182(3), 1412-1432.
- Johnson, R., & Soenen, L. (2003). Indicators of successful companies. European Management Journal, 21(3), 364-369.
- Mansoury, A., Salehi,M,. (2011), Developing Fuzzy AHP-DEA Combined Model for Efficiency Analysis in Banking System: Evidence from Iranian Banks, International Journal of the Physical Sciences. 6(13), 3205–3217.
- Mehrgan,M,.(2004)."Quantitative models in evaluating performance of organizations", management faculty of Tehran university, Tehran.
- Mohanram, P. S. (2005). Separating Winners from Losers among LowBook-to-Market Stocks using Financial Statement Analysis. Review of Accounting Studies, 10(2-3), 133-170.
- Momeni,M, .(2010). Modern discussions of operation research. Aghah, Tehran.
- Rafiee., R. (2008). The impact of financial intermediaries and economic growth in Iran. Pazhoheshnameh, 28(1), 13-30.
- Rasti., M. (2009). Examine the relationship between financial development and economic growth in OPEC countries: testing the assumptions Patrick. Barasihaye Bazargani, 38(4), 59-67.
- Redman, A. L., Gullett, N. S., & Manakyan, H. (2000). The performance of global and international mutual funds. Journal of Financial and strategic Decisions, 13(1), 75-85.
- Sabetisaleh, E. (2009). Fuzzy multi-criteria decision making model for ranking firms seeking bank financing (Case study: fifty top companies in Tehran Stock Exchange). Second International Conference on Financial System Development in Iran, Tehran.
- Shahrabadi,A. (2010). capital management in stock market. Stock services and information co. 2.