![]() ISSN 0798 1015
ISSN 0798 1015

![]() ISSN 0798 1015
ISSN 0798 1015
Vol. 39 (Number 16) Year 2018 • Page 6
Jorge VINUEZA-MARTÍNEZ 1; Mirella CORREA-PERALTA 2; Denis MENDOZA-CABRERA 3
Received: 12/12/2017 • Approved: 10/01/2018
ABSTRACT: The analysis of the Internet performed for this article has been organized into three sections: first, reviewing sources to identify the importance of internet services; second, obtaining, processing and analyzing information from the Global Internet Maps report, TeleGeography, Internet Atlas, Telxius, PeeringDb, Internet Traffic Report of Venezuela, Colombia, Ecuador, Peru, Chile, Argentina, Uruguay, Brazil, Bolivia and Paraguay; and third, understanding the conclusions from the study regarding connectivity, penetration, affordability, fixed and mobile download speed, with special regard to the South American countries of Brazil and Uruguay. |
RESUMEN: Para este artículo el análisis del internet se organizó en tres secciones: primera, revisión de fuentes para identificar la importancia de los servicios del internet; segunda, obtener, procesar y analizar información del reporte de Global Internet Maps, TeleGeography, Internet Atlas, Telxius, PeeringDb, Internet Traffic Report de Venezuela, Colombia, Ecuador, Perú, Chile, Argentina, Uruguay, Brasil, Bolivia y Paraguay; y tercero, comprender conclusiones del trabajo respecto a la conectividad, penetración, asequibilidad, velocidad de descarga fijo y móvil, destacándose de los países sudamericanos Brasil y Uruguay. |

The Internet has evolved vertiginously since its origins and influenced the daily activities of human beings. Connectivity, bandwidth and heterogeneous devices connected to the network have created a globalization paradigm and connection called "the internet of things" (IoT), establishing intelligent services through the ubiquitous interaction of the information provided through the network as a necessity and challenge. In addition, criteria for security, standardization and governance of technology generate opportunities for R&D of the technological ecosystem, such as applications, architectures, communication networks, data management, perception and business logic in organizations. The term "internet of things" began in the Massachusetts Institute of Technology (MIT) in its effort to standardize electronic technologies, radio frequencies, wireless sensors and emerging technologies to enable what we know today as Service Oriented Architecture (SOA) (Agudelo & Barrera, 2014).
For the management of the internet of things, Fan & Chen (2010) mention the collaboration of a common framework that addresses the treatment of information obtained through devices, encapsulating the service in applications, from capture to transformation and storage of the data provided by the internet. From the internet of things, the concept of the social internet of things (SIoT) is explored, relating exclusively to "intelligent objects" as Alves, André Da Costa, Da Rosa Righi, & Barbosa (2015) reference it in their Mingle model, comparing similarity and integration of information taken from a university social network based on the geographical location of people, access to content and services.
Currently, the IoT is a common philosophy in smart cities and homes or in any connection space that requires a distributed object. However, not all populations have access to the Internet. Taking this into consideration, Meana-Llorian, Garcia, G-Bustelo, Lovelle, & Garcia (2016) propose the union of social networks and integrated subsystems based on the study by Atzori, Iera, & Morabito (2014), applying engineering techniques aimed at models or formal methods from the simulation of the real world (Meana-Llorian et al., 2016). They propose to develop a spontaneous social network made up of people who connect through devices to the location based service (LBS) (Zaupa, Costa, Silva, Barbosa, & Yamin, 2012), based on an evaluation of the technologies considering the frequency and necessary coverage for the internet of things (Banos, Afaqui, Lopez, & Garcia, 2017), where the selection depends on the conditions of the technological equipment and network coverage (Londoño & Céspedes, 2016), speed of response, scalability and mobility (Gordillo, Romero, Abasolo, & Carrera, 2014). In this context, Noguera-Arnaldos, Paredes-Valverde, Valencia-García, & Rodríguez-García (2015) refer to a study of a dialogue system based on instant messaging for the control of devices on the internet of things, ontologically relating an intelligent system with the natural language of the user.
One of the objectives of the European Research Cluster on the Internet of Things (IERC) is to integrate the cooperation of services for the development of an information-based economy from research, coordinating clusters and projects related to technology (Ferreira Da Silva & Oliveira Sa, 2016).
The report of the Information Society in Spain (2016) states that 59.3% of people over 65 have accessed the internet with the use of tablets, showing a growth of 13.2% in 2015 to 42.1 % in 2016. In addition, the report highlights: inclusion of Big Data as a technological trend, idea of an increased man to develop human capabilities through technology, increase of instant messaging, intelligent systems, inclusion of sensors, training through the internet, decision making based on published information, use of mobile phones by users between 14 to 19 years old, and the digital marketing revolution with the inclusion of technologies.
In this context, the technological infrastructure in the physical layer is relevant in the access to Internet services, favoring communication —hence, submarine wiring is the basis for global communication by 97%, while 3% is satellite-based (Douglas R. Burnett, Robert Beckman, Tara M. Davenport, 2014). This creates a dependence on submarine wiring for availability, continuity, reliability, safety and incidence in all parts of the planet (Alazri, 2017). In 2009, the International Cable Protection Committees (ICPC) identified 293 sites and 34 oceanic observation areas that use or plan to use submarine cables for data and energy transmission.
Through its online databases, TeleGeography, Internet Atlas, submarinecablemap, among other research firms of the telecommunications market, represent nodes, locations, distances or others, keeping constantly updated information about the available infrastructure to obtain Internet access and the services it provides.
Table 1
Internet Atlas, physical Internet repository in South America
|
|
Venezuela |
Colombia |
Brazil |
Uruguay |
Ecuador |
Peru |
Chile |
Argentina |
Paraguay |
Bolivia |
RIPE |
X |
X |
X |
X |
|
|
|
|
|
|
IXP |
|
X |
X |
|
X |
X |
X |
X |
X |
|
DATA CENTER |
X |
X |
X |
X |
|
|
X |
X |
|
X |
Source: Internet Atlas, October 2017
This study is of a documentary nature. Its data were taken from the online databases published on the official site of each source consulted. To achieve this, the following was done:
1. Obtaining the report of the Global Map of the Internet of the South American countries, published in https://www.internetsociety.org//map/global-internet-report/ in October of 2017, as a source of information to evaluate the results of: Venezuela, Colombia, Ecuador, Peru, Chile, Argentina, Uruguay, Brazil, Bolivia and Paraguay;
2. Analyzing and evaluating the information obtained from the submarine wiring map published by TeleGeography (https://www.submarinecablemap.com/);
3. Analyzing and evaluating information obtained from the map published by Telxius (https://telxius.com/network/).
The Global Internet Maps report presents broadband penetration, fixed bandwidth affordability, Internet upload and download speed, resilience or risk of Internet disruption, and total monthly Wikipedia page editions by country.
In South America, 49.87% of global penetration of the Internet presents an average growth rate of 13% in the last 3 years, with Chile standing out (ranked 47 worldwide). On the other hand, Paraguay ranks 107 out of 180 countries (world level) with a penetration of 37%, as can be seen in Figure 2. In the case of fixed broadband penetration, the average is only 9% while for mobile broadband it is 28%, with Brazil and Uruguay standing out and Peru and Paraguay below 5%.
Figure 1
Broadband penetration of South American countries

Source: Adapted report from Global Internet Maps, October 2017
The affordability of fixed-broadband is 4.04%, with a monthly GDP average of $20.60 (October 2017) and the affordability of mobile broadband is 3.30%, with a monthly average of $18.80. The information from the Global Internet Maps did not include Argentina, but highlighted Bolivia (9%), as shown in Figure 3. With average latency of 600-700ms as well as Ecuador, Brazil, Argentina, Bolivia and Peru; 300-400 ms in the case of Uruguay and Chile; 500-600ms in Colombia and Venezuela; and more than 1000ms in Paraguay.
Figure 2
Affordability of broadband of South American countries
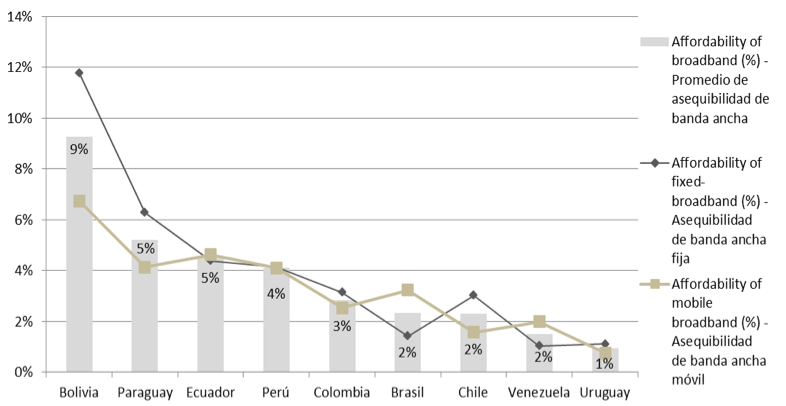
Source: Adapted from Global Internet Maps Report, October 2017
As shown in Figures 3 and 4, regarding the speed of download and upload for Internet access Mb/s of South America, Uruguay stands out in the fixed and mobile Internet access. The average download speed for fixed Internet access is 8.50 Mbit/s and the load is 2.94 Mbit/s, while the average mobile internet is 3.56 Mbit/s download and upload speed 1,24 Mbit/s, with a latency of 627.3ms. In addition, Colombia presents 100% in 3G-technology coverage and Brazil (ranked 7 worldwide) stands out from the other South American countries for having a larger ccTLD domain account, DNSSEC deployment (ccTLD) and allocation of IPV4 addresses in South America.
Figure 3
Internet upload and download speed (Mb/s) in South America
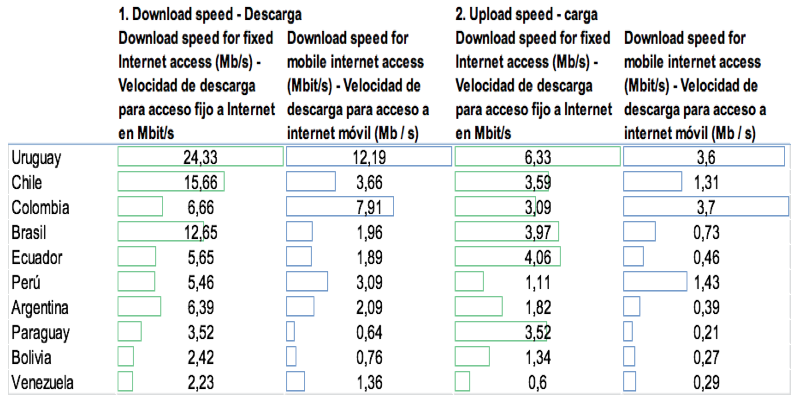
Source: Global Internet Maps Report, October 2017
-----
Figure 4
Internet download speed (Mb/s) in South America
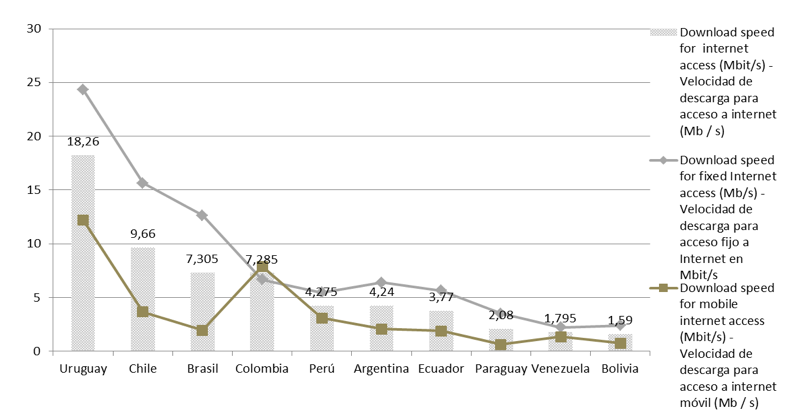
Source: Global Internet Maps Report, October 2017
From the criterion of resilience or risk of interruption of the Internet, Colombia, Argentina and Brazil occupy the first place; in the case of the distribution of autonomous system numbers (ASN), border and national, Brazil occupies the first place.
Table 2
ASNs of South American countries
Country |
# of Border ASNs |
# of Domestic ASNs |
Venezuela |
26 |
44 |
Colombia |
58 |
85 |
Ecuador |
22 |
51 |
Peru |
14 |
19 |
Chile |
32 |
132 |
Argentina |
92 |
327 |
Uruguay |
10 |
16 |
Brazil |
305 |
2679 |
Bolivia |
8 |
16 |
Paraguay |
6 |
22 |
Source: Global Internet Maps Report, October 2017
In addition, Brazil stands out for the content limit with the largest monthly editions of the Wikipedia pages, ranking seventh worldwide.
Table 3
Content Limits of South American countries
Country |
|
Freedom on the net (Overall score) |
Obstacles to access |
Violations of user rights (Score) |
Venezuela |
Partially free |
56 |
17 |
21 |
Colombia |
Free |
30 |
8 |
14 |
Ecuador |
Partially free |
37 |
9 |
17 |
Brazil |
Free |
30 |
7 |
16 |
Argentina |
Free |
27 |
7 |
11 |
Source: Global Internet Maps Report, October 2017
The submarine wiring published by TeleGeography (https://www.submarinecablemap.com/ interactive map of global network of communications service) consists of 32 cables with 59 points located in the South American countries that are connected mainly with the United States, as it is observed in Table 4. The largest wiring installation of South America-1 (SAm-1) with 25,000 km is owned by Telxius, South American Crossing (SAC) / Latin American Nautilus (LAN) and Pan American (PAN-AM), with 227,327 Km of the cable in the South American countries, as shown in Table 5.
Table 4
Submarine wiring in South American countries
Country |
Total |
Cable |
Brazil |
16 |
Tannat, South America-1 (SAm-1), Monet, Americas-II, South Atlantic Cable System (SACS), ARBR, Junior, Atlantis-2, Seabras-1, Brazilian Festoon, South American Crossing (SAC)/Latin American Nautilus (LAN), BRUSA, South Atlantic Inter Link (SAIL), EllaLink, America Movil Submarine Cable System-1 (AMX-1), GlobeNet |
Colombia |
12 |
Pacific Caribbean Cable System (PCCS), South American Crossing (SAC)/Latin American Nautilus (LAN), San Andres Isla Tolu Submarine Cable (SAIT), ARCOS, Maya-1, AURORA, Pan American (PAN-AM), Colombia-Florida Subsea Fiber (CFX-1), South America-1 (SAm-1), Deep Blue Cable, America Movil Submarine Cable System-1 (AMX-1), GlobeNet |
Chile |
8 |
South American Crossing (SAC)/Latin American Nautilus (LAN), South America Pacific Link (SAPL), Segunda FOS Canal de Chacao, Fibra Optica Austral, South America-1 (SAm-1), FOS Quellon-Chacabuco, AURORA, Pan American (PAN-AM) |
Argentina |
7 |
ARBR, South American Crossing (SAC)/Latin American Nautilus (LAN), South America-1 (SAm-1), ARSAT Submarine Fiber Optic Cable, Unisur, Atlantis-2, Bicentenario |
Venezuela |
6 |
GlobeNet, South American Crossing (SAC)/Latin American Nautilus (LAN), Pan American (PAN-AM), Americas-II, ALBA-1, ARCOS |
Ecuador |
4 |
South America-1 (SAm-1), Pan American (PAN-AM), AURORA, Pacific Caribbean Cable System (PCCS) |
Peru |
3 |
Pan American (PAN-AM), South American Crossing (SAC)/Latin American Nautilus (LAN), South America-1 (SAm-1) |
Uruguay |
3 |
Bicentenario, Unisur, Tannat |
Source: TeleGeography Submarine Cable Map obtained: https://www.submarinecablemap.com, October 2017.
----
Table 5
Submarine wiring by longitude in South America
Cable |
Cable length (Km) |
ALBA-1 |
1,860.00 |
America Movil Submarine Cable System-1 (AMX-1) |
17,800.00 |
Americas-II |
8,373.00 |
ARBR |
n.a. |
ARCOS |
8,600.00 |
ARSAT Submarine Fiber Optic Cable |
40.00 |
Atlantis-2 |
8,500.00 |
AURORA |
n.a. |
Bicentenario |
250.00 |
Brazilian Festoon |
2,543.00 |
BRUSA |
11,000.00 |
Colombia-Florida Subsea Fiber (CFX-1) |
2,400.00 |
Deep Blue Cable |
12,000.00 |
EllaLink |
10,119.00 |
Fibra Optica Austral |
3,000.00 |
FOS Quellon-Chacabuco |
350.00 |
GlobeNet |
23,500.00 |
Junior |
390.00 |
Maya-1 |
4,400.00 |
Monet |
10,556.00 |
Pacific Caribbean Cable System (PCCS) |
6,000.00 |
Pan American (PAN-AM) |
7,050.00 |
San Andres Isla Tolu Submarine Cable (SAIT) |
826.00 |
Seabras-1 |
10,800.00 |
Segunda FOS Canal de Chacao |
40.00 |
South America Pacific Link (SAPL) |
17,600.00 |
South America-1 (SAm-1) |
25,000.00 |
South American Crossing (SAC)/Latin American Nautilus (LAN) |
20,000.00 |
South Atlantic Cable System (SACS) |
6,165.00 |
South Atlantic Inter Link (SAIL) |
5,900.00 |
Tannat |
2,000.00 |
Unisur |
265.00 |
n.a.= non available information
Source: TeleGeography Submarine Cable Map obtained: https://www.submarinecablemap.com, October 2017.
The Telxius interactive map reflects the SAM-1 cable present in IP services, capacity services, and location. Connections are found in Brazil, Chile, Argentina, Peru, Ecuador and Colombia.
The exchange of information and direct interconnection between networks, known as "peering", presents 30 connections in Brazil, 22 in Argentina, 8 in Chile, 4 in Ecuador and 1 in Peru, Paraguay, Colombia and Bolivia (https://www.peeringdb.com/advanced_search).
Internet traffic report (http://www.internettrafficreport.com) South America presents 3 routers in Argentina, Colombia and Peru.
In Venezuela (National Institute of Statistics, INE) there is an increase of 55.68% (2013), mainly in social networks (54.49%), electronic mail (33.83%), documents of interest (32.05%), distance education and training (25.04%).
In Colombia (National Administrative Department of Statistics, DANE) there is an increase of 44.5% (2014) to 45.5% (2015) and is reflected with access to the Internet with a fixed connection (82.4%).
In Ecuador (National Institute of Statistics and Census, INEC) populations have cellphones (75.5%), Internet access (11.8%), modem/telephone access (33.1%) and cable/broadband (57,4%) with connection to 29% (2010).
In Peru (National Institute of Statistics and Informatics, INEI) 28% of the populations of 6 to 16 years old use the Internet in their homes, 40% in booths, 1.6% landline telephone and 25% of households oscillate between 512Kbps a 1024Kbps.
In Bolivia, according to the National Institute of Statistics in the 2012 census, 23.6% of the population has a computer; between 2016 to 2017 there was an increase of 3.7% in connections.
In Chile (National Institute of Statistics), between January and September of 2017 Internet access increased from 6.2% to 7% for technological improvements, increase in connection speed and improvement in the supply of fiber optic services.
In Argentina (Economic Social Observatory) data traffic exceeded 260 Gbps in August 2017 with the highest ADSL connection.
Uruguay (National Institute of Statistics), in the 2010 census, reflected that 69% of the population has personal computers and 45% access to the Internet.
In Paraguay (General Directorate of Statistics and Census), 22.7% (2015) has access to the Internet, and 22.5% of households have Internet access.
In Brazil by June 2012 45.6% were Internet users and in 2015 with population penetration of 57.6%.
This document describes the data from the websites of Global Internet Maps, TeleGeography, Internet Atlas, Telxius, PeeringDb, Internet Traffic Report of Venezuela, Colombia, Ecuador, Peru, Chile, Argentina, Uruguay, Brazil, Bolivia and Paraguay as instruments, with the objective of identifying the importance of the service, infrastructure and internet coverage in South American countries. The results obtained show a penetration of 49.87% with 4.04% of affordability of fixed broadband and 3.30% of affordability of mobile broadband, and average download speed for fixed access in 8.50 Mbit/s and the load in 2,94 Mbit/s. In the case of mobile internet, the average is 3.56 Mbit/s download speed and 1.24 Mbit/s load with a latency of 627.3ms with a connection of 110,725.00Km. Regarding connectivity, it includes published information, where it is clear that the physical layer will generate an expansion or transport of internet services. Although the objective is to analyze the connectivity and the services generated by the Internet. In the future, services should be compared according to the wiring connectivity such as ARBR, BRUSA, South Atlantic Inter Link (SAIL), South Atlantic Cable System (SACS) for submitting an RFS (service date) to 2018.
Agudelo, J. P., & Barrera, H. E. C. (2014). Approach for a congestion charges system supported on Internet of Things. In 2014 IEEE Colombian Conference on Communications and Computing, COLCOM 2014 - Conference Proceedings. Bogota: IEEE Computer Society. https://doi.org/10.1109/ColComCon.2014.6860424
Alazri, A. S. (2017). Telecommunication traffic through submarine cables: Security and vulnerabilities. In 2016 11th International Conference for Internet Technology and Secured Transactions, ICITST 2016 (pp. 372–375). Institute of Electrical and Electronics Engineers Inc. https://doi.org/10.1109/ICITST.2016.7856733
Alves, T. M., André Da Costa, C., Da Rosa Righi, R., & Barbosa, J. L. V. (2015). Exploring the social Internet of Things concept in a univeristy campus using NFC. In C.-V. E. Cuadros-Vargas A. Cancela H. (Ed.), Proceedings - 2015 41st Latin American Computing Conference, CLEI 2015. Institute of Electrical and Electronics Engineers Inc. https://doi.org/10.1109/CLEI.2015.7360014
Atzori, L., Iera, A., & Morabito, G. (2014). From “smart objects” to “social objects”: The next evolutionary step of the internet of things. IEEE Communications Magazine, 52(1), 97–105. https://doi.org/10.1109/MCOM.2014.6710070
Banos, V., Afaqui, M. S., Lopez, E., & Garcia, E. (2017). Throughput and Range Characterization of IEEE 802.11ah. IEEE Latin America Transactions, 15(9), 1621–1628. https://doi.org/10.1109/TLA.2017.8015044
Burnett, D., Beckman, R., & Davenport, T. (2014). Submarine Cables: The Handbook of Law and Policy. Boston: first edition, Martinus Nijhoff.
Departamento Administrativo Nacional de Estadística, DANE. (2017). Dane Información Estratégica. Retrieved November 13, 2017, from http://www.dane.gov.co/
Dirección general de Estadística, encuestas y censos Paraguay. (2017). Dirección general de Estadística, encuestas y censos. Retrieved November 14, 2017, from http://www.dgeec.gov.py/
Esri. (2017). Atlas Internet. Retrieved November 1, 2017, from http://atlas-test.wail.wisc.edu/InternetAtlasLimited/
Fan, T., & Chen, Y. (2010). A scheme of data management in the internet of things. In Proceedings - 2010 2nd IEEE International Conference on Network Infrastructure and Digital Content, IC-NIDC 2010 (pp. 110–114). Beijing. https://doi.org/10.1109/ICNIDC.2010.5657908
Ferreira Da Silva, F. J., & Oliveira Sa, J. (2016). Internet-of-Things: Strategic research agenda evolution [Internet-of-Things: Evolução das Agendas Estratégicas de Investigação]. In C. M. P. G. R. S. O. S. Rocha A. Reis L.P. (Ed.), Iberian Conference on Information Systems and Technologies, CISTI (Vol. 2016–July). IEEE Computer Society. https://doi.org/10.1109/CISTI.2016.7521526
Fundación Telefónica. (2016). La sociedad de la información en España 2016. Barcelona: Editorial Ariel.
Gordillo, R. X., Romero, C. G., Abasolo, S. E., & Carrera, M. A. (2014). Testbed for evaluating reference models of Internet of Things (IoT). In 2014 IEEE Colombian Conference on Communications and Computing, COLCOM 2014 - Conference Proceedings. Bogota: IEEE Computer Society. https://doi.org/10.1109/ColComCon.2014.6860426
IERC European Research Cluster on the Internet of Things. (2016). IERC European Research Cluster on the Internet of Things. Retrieved November 1, 2017, from http://www.internet-of-things-research.eu/
INEC. (2017). Instituto Nacional de Estadística y Censos INEC. Retrieved November , 2017, from http://www.ecuadorencifras.gob.ec/institucional/home/
Instituto de Estadística de la UNESCO. (2009). Medicación de las Tecnologías de la Información y la Comunicación (TIC) en Educación - Manual de Usuario - Documento Técnico No. 2. Canada: UNESCO Institute for Statistics. Obtenido de http://unesdoc.unesco.org: http://unesdoc.unesco.org/images/0018/001883/188309s.pdf
Instituto Nacional de Estadística. (2017). Instituto Nacional de Estadística INE Uruguay. Retrieved November 14, 2017, from http://www.ine.gub.uy/
Instituto Nacional de Estadísticas de Chile. (2017). Instituto Nacional de Estadísticas INE. Retrieved November 13, 2017, from http://www.ine.cl/
Instituto Nacional Estadístico de Bolivia. (2017). Instituto Nacional Estadístico INE. Retrieved November 14 2017, from http://www.ine.gob.bo/
Internet Society. (2017). Global Internet Maps. Retrieved November 2, 2017, from https://www.internetsociety.org//map/global-internet-report/
Internet Traffic Report. (2017). Internet Traffic Report. Retrieved November 17, 2017, from http://www.internettrafficreport.com/samerica.htm
ISCP. (2015, Mayo 21). International Cable Protection Committee. Retrieved August 2, 2017, from https://www.iscpc.org/cable-data/scientific-cables/
Londoño, D., & Céspedes, S. (2016). Performance evaluation of CoAP and HTTP/2 in web applications. In B.-J. J. Hevia A. Cespedes S. (Ed.), CEUR Workshop Proceedings (Vol. 1727, pp. 25–27). CEUR-WS. Retrieved from https://www.scopus.com/inward/record.uri?eid=2-s2.0-84999142225&partnerID=40&md5=c9d09d3aff77c10c6147a108c71df34e
Meana-Llorian, D., Garcia, C. G., G-Bustelo, B. C. P., Lovelle, J. M. C., & Garcia, V. H. M. (2016). IntelliSenses: Sensing the Internet of Things [IntelliSenses: Sintiendo Internet de las Cosas]. In C. M. P. G. R. S. O. S. Rocha A. Reis L.P. (Ed.), Iberian Conference on Information Systems and Technologies, CISTI (Vol. 2016–July). IEEE Computer Society. https://doi.org/10.1109/CISTI.2016.7521551
Ministerio del Poder Popular de Planificación. (2011). Instituto Nacional de Estadística. Retrieved November 16, 2017, from http://www.ine.gov.ve/
Noguera-Arnaldos, J. Á., Paredes-Valverde, M. A., Valencia-García, R., & Rodríguez-García, M. Á. (2015). Instant messaging-based dialog system for device control in the internet of things [Sistema de diálogo basado en mensajería instantánea para el control de dispositivos en el internet de las cosas]. Procesamiento de Lenguaje Natural, 55, 173–176. Retrieved from https://www.scopus.com/inward/record.uri?eid=2-s2.0-84941200348&partnerID=40&md5=6308a70145cb16a6cd1a328c9eb9cce3
PeeringDb. (2017). www.peeringdb.com. Retrieved October 13, 2017, from https://www.peeringdb.com/advanced_search
Perú Instituto Nacional de Estadística e Informática. (2017). Instituto Nacional de Estadística e Informática INEI. Retrieved November 13, 2017, from http://www.inei.gob.pe/
TeleGeography. (2017, Noviembre 1). Submarine Cable Map. Retrieved November 3, 2017, from https://www.submarinecablemap.com
Telxius. (2017). Telxius. Retrieved Noviembre 12, 2017, from https://telxius.com/network/
Universidad Nacional de Rosario. (2017). Observatorio Económico Social UNR. Retrieved November 14, 2017, from http://www.observatorio.unr.edu.ar/acceso-estadistico/
Zaupa, D., Costa, C., Silva, J., Barbosa, J., & Yamin, A. (2012). Implementing a spontaneous social network for managing ubiquitous interactions. In Proceedings - 13th Symposium on Computing Systems, WSCAD-SSC 2012 (pp. 163–170). Petropolis, RJ. https://doi.org/10.1109/WSCAD-SSC.2012.19
1. Universidad Estatal de Milagro, Milagro, Ecuador. Contact jvinuezam@unemi.edu.ec
2. Universidad Estatal de Milagro, Milagro, Ecuador. Contact mcorreap@unemi.edu.ec
3. Universidad Estatal de Milagro, Milagro, Ecuador. Contact dmendozac2@unemi.edu.ec