![]() ISSN 0798 1015
ISSN 0798 1015

![]() ISSN 0798 1015
ISSN 0798 1015
Vol. 39 (# 07) Year 2018. Page 13
Brijlal MALLIK 1; Dasarathi SAHU 2; Sisir R DASH 3
Received: 10/10/2017 • Approved: 08x/11/2017
2. A theoretical analysis through the review of literature
ABSTRACT: Corporate Social Responsibility (CSR) is the gateway to welfare economy according to the socially responsible organizations and people can influence practices of corporate towards social responsibility by putting pressures on them through their consumption patterns. But, does CSR actually influence consumption patterns of people? In the present study, by conducting survey using a structured questionnaire and then employing regression analysis on data generated from customers of two FMCG majors of India; empirical evidences on positive impact of CSR on brand image have been detected. |
RESUMEN: La Responsabilidad Social Corporativa (RSE) es la puerta de entrada a la economía del bienestar según las organizaciones socialmente responsables y las personas pueden influir en las prácticas corporativas hacia la responsabilidad social presionándolas a través de sus patrones de consumo. Pero, ¿la RSC realmente influye en los patrones de consumo de las personas? En el presente estudio, mediante la realización de la encuesta utilizando un cuestionario estructurado y, a continuación, utilizando el análisis de regresión en los datos generados a partir de clientes de dos grandes empresas de FMCG de la India, se han detectado evidencias empíricas sobre el impacto positivo de la RSE en la imagen de marca. Palabras claves RSE, Imagen de Marca, Bienestar Social, Análisis de Regresión |

Socially Responsible Consumer Behaviour (SRCB) is shown by one who includes Corporate Social Responsibility (CSR) as one of the major criteria influencing the consumption patterns (Mohr et al., 2001). Hence, higher level of knowledge among consumers regarding issues and happenings related to CSR positively affect the promotion of SRCB. The first principle of practicing SRCB is that the consumers should realize that their purchasing power can influence the company behaviour. And the consumers who relate quality of life in economic terms are less likely to practice SRCB properly. SRCB ensures boycott of socially irresponsible companies and it is only the knowledge level of consumers which can upgrade SRCB in a society. Additionally, it is also important for the corporations to understand what consumers want from them with respect to helping their communities. Most companies feel compelled to give to charity, but only a few have figured out how to do it well (Porter & Kramer, 2002). And many firms now a day are using CSR to gain competitive advantage for establishing long lasting relations with their stakeholders (Naqvi et al., 2013). It is obviously through enhancement of brand image of the product and general image of the firm by proving self socially responsible through CSR. So, a phase of survey in the present study has been undertaken by taking customers of the two chosen Fast Moving Consumer Goods (FMCG) majors who are indulged actively in CSR activities since long in the sample and this article is dedicated to discuss the findings of this phase of primary research in which the impact of CSR on brand image has been attempted to be measured. The statistical tools used for this purpose includes reliability analysis, descriptive analysis, correlation analysis and regression analysis. The results of the study shown that CSR has positive impact on all the components of brand image of the sampled organizations.
Dawkins and Lewis (2003) who are responsible for measuring the impact and importance of citizenships of corporate on their stakeholders at national as well as international levels have made research over a period of ten years. They have discovered in their study that due to increased accessibility of media among the stakeholders including consumers, employees, legislators and investors; the expectations on companies with reference to their CSR activities has dramatically changed and the companies have to bear this. According to Maignan and Ferrell (2004), since in the past few years a climate of stakeholders’ activism has emerged throughout the world, some leading companies have started profiling themselves as socially responsible and there are evidences that the CSR initiatives can increased stakeholders’ support for them. Davis (2001) in this context says that during the last few years’ countries like USA and other economically developed nations have already decided their stand on social responsibility of business and major institutions. And in the coming years the developing nations will fall in this line due to social pressures and involvement of the United Nations at least regarding the environment. The organizations may follow the directions shown by Carrol (1979) on essential aspects of CSR. The more the financial performance of an organization, the better it can perform socially and this empirical linkage has been shown in the study conducted by Waddock and graves (1997). But, does CSR has any positive relationship with brand image and if there exists a relationship between the two then what is the extent to which CSR impacts brand image? In order to answer these research questions, the scale developed by Lai et al. (2010) seems the most suitable because it fully satisfy the requirements of a research instrument to fulfil the objectives of the present phase of research. The questionnaire in their study is a twenty seven (27) items encompassing all major components of CSR as well as brand image. The subsequent sections of this chapter narrates the results of analyses done on primary data collected from customers of the chosen organizations by using the scales developed by Lai et al. (2010).
As discussed above, the CSR and brand image components adapted from Lai et al. (2010) scale can best represent the impact of CSR on brand image and that is why a primary research phase on customers of the chosen organizations has been conducted in this study using this instrument only. The broad objective of the study being to provide empirical evidences on the impact of CSR on brand image, the specific research objectives have been set as per the following:
1. To detect whether there is any relationship between CSR and brand image.
2. To measure the extent to which CSR impacts brand image of the chosen organizations.
After the research objectives are set, the next job is to design the sample. The first decision that is required to be answered at the time of sample design is the sample size that refers to the number of respondents (who are customers of the chosen organizations in this case) to be included in the sample. Since the present study is a conclusive one instead of a descriptive one, a small sample is not acceptable. Secondly, as the number of items included in the questionnaire is equal to 27 (i.e. twenty seven), the sample size should ideally be equal to or more than five times of it. Thirdly, since the present study has been intended to identify a research problem i.e. measuring the impact of CSR on brand image through regression analysis; it will be considered as a problem identification research rather than problem solving research. And the usual sample sizes used in problem identification researches of marketing research studies are of minimum 500 (i.e. five hundred) elements (Malhotra and Birks, 2006). Keeping all these points in mind the survey has been conducted to include at least 500 respondents in the sample and at the end 516 successful face to face interviews got achieved. The method of sampling followed at the time of survey was ‘quota sampling’ about which the previous chapter gives an extensive explanation. Under the method of quota sampling quotas are fixed on the basis of predefined proportions in the sample basis control characteristics and Table 3.1 along with representative graphs is unveiling the demographic profile of respondents.
Table 3.1
Demographic Profile of Respondents (n = 516)
Stratification Variables |
Category |
Frequency |
Percentage (%) |
Age |
Less than 25 Years |
249 |
48.3% |
26 – 32 Years |
192 |
37.2% |
|
33 – 38 Years |
75 |
14.5% |
|
Educational Qualifications |
Non Graduate |
136 |
26.4% |
Graduate General |
162 |
31.4% |
|
Post Graduate General |
141 |
27.3% |
|
Technical Graduate/Post Graduate |
77 |
14.9% |
|
Gender |
Male |
265 |
51.4% |
Female |
251 |
48.6% |
|
Organization |
P&G |
255 |
49.4% |
ITC |
261 |
50.6% |
|
Source: Primary Data |
|||
In Table 3.1, it can be seen that there are four control characteristics chosen in this study: age, educational qualifications, gender and organization. The age of the respondents has been categorized as: less than 25 years, 26 – 32 years and 33 – 38 years. The various types of educational qualifications have been classified in the study as: non graduate, graduate general, post graduate general and technical graduate/post graduate. There are two types of gender listed i.e. male and female. And as discussed earlier there are two organizations in which the survey has been undertaken: P&G and ITC. Once the sample design is complete, the next task is to define the methods for analysis and in this context there are three types of analysis which are undertaken to satisfy the research objectives:
(a) Reliability Analysis
(b) Descriptive Analysis
(c) Regression Analysis
The test of reliability is generally done through a popular statistical tool ‘Cronbach’s Alpha’ for measuring the degree of consistency among items under consideration. If different variables under consideration are having high degree of correlation, it means that they are measuring the same construct and they are contributing to the overall construct. When reliability is measured by Cronbach’s Alpha, by convention a lenient cut off of 0.6 is acceptable in empirical research.
Descriptive statistics analyzed on interval and ratio scale data generally include the measures of location, variability and shape. In the present study, arithmetic mean has been taken as a measure of location because it is a rigidly defined average and most suitable for further statistical treatments like hypothesis testing. Then range, standard deviation and variance have been computed for studying the variability. Additionally, the skewness and kurtosis which are considered extremely useful to understand the nature of distribution has been calculated. Computation of skewness and kurtosis are a must for assessing normality of data. The descriptive analysis here has been carried out only after proper cleaning of the raw data obtained in the survey.
Regression analysis enables us to mathematically measure the average relationship between two or more variables by taking original units of the data. If the regression analysis is confined to only two variables at a time, then it is called ‘simple regression’ and when it more than two variables are considered at a time, it is called ‘multiple regression’. In the present study, there is multiple numbers of variables involved under brand image but the main objective of the study is to measure the impact of CSR on brand image. Hence, we have adopted simple regression by taking CSR as independent variable and brand image as dependent variable. The variable whose influence is to be measured is called ‘independent variable’ while the variable on which the influence is measured is called ‘dependent variable’ in regression analysis. Now, since CSR is the independent variable and brand image is the dependent variable here, for simplicity we can suggest the following mathematical function:
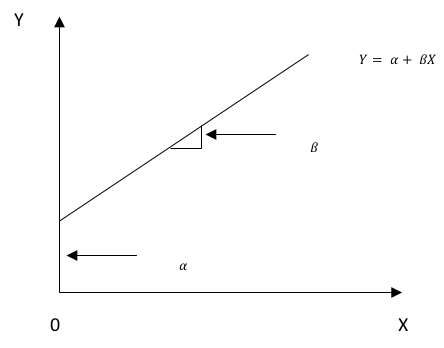
Y = α + βX
Where, Y = Brand Image and X = CSR, and where α and β are the parameters of the model are, respectively, the intercept and slope coefficient. The slope coefficient β measure the influence of CSR on brand image. Geometrically the above equation can be shown with the help of a diagram as per below (See Figure 3.1).
Figure 3.1
Regression Function
Corollary to regression analysis, there is causation and correlation. Although regression analysis can tell us the dependence of brand image on CSR, it does not imply causation. To ascribe causality, we have appeals to a priori or theoretical considerations undertaken during the phase of literature review. We can invoke theory in saying that brand image depends on CSR from the review of extant literature. Then correlation which is used primarily to measure the degree or strength of linear association between two variables is conceptually very much different from regression analysis. In the correlation table shown below, the value of correlation coefficient of CSR with itself is ‘1’. Likewise, the correlation of each of the other constructs i.e. brand loyalty, perceived quality, brand awareness/association, brand satisfaction, corporate reputation and brand performance with themselves are also equal to ‘1’. It indicates that the constructs are hundred percent correlated with themselves. But, the issue is to find out whether they are correlated with other constructs. For this purpose the correlation coefficients with other constructs has been calculated and their significance has been tested at 5% level. The following are the null and alternative hypotheses that have been formed to be tested through application of correlation and regression analysis.
H01: CSR is not positively and significantly related and impacts Brand loyalty.
H11: CSR is positively and significantly related and impacts Brand loyalty.
H02: CSR is not positively and significantly related and impacts perceived quality.
H12: CSR is positively and significantly related and impacts perceived quality.
H03: CSR is not positively and significantly related and impacts brand awareness/association.
H13: CSR is positively and significantly related and impacts brand awareness/association.
H04: CSR is not positively and significantly related and impacts brand satisfaction.
H14: CSR is positively and significantly related and impacts brand satisfaction.
H05: CSR is not positively and significantly related and impacts corporate reputation.
H15: CSR is positively and significantly related and impacts corporate reputation.
H06: CSR is not positively and significantly related and impacts brand performance.
H16: CSR is positively and significantly related and impacts brand performance.
As discussed earlier as there are three types of analysis which have been undertaken to satisfy the research objectives in the present study i.e. Reliability Analysis, Descriptive Analysis and Regression Analysis, the results of these analyses should also ideally be discussed in the same sequence.
In the present study when the data got tested for reliability, it yielded a Cronbach’s Alpha score ranging from 0.65 to 0.96 which is much better than the reliability score obtained in the pilot study. The inter-item correlations are also found to be high which means that the items under consideration are measuring the same underlying construct. In Table 4.1 the results of reliability analysis has been shown where it can be seen that the overall reliability of the research instrument in terms of Chronbach’s Alpha is equal to 0.961152512 which is much more than the lenient cut off of 0.6. Then the Chronbach’s Alpha values for different constructs taken in the questionnaire namely: corporate social responsibility, brand loyalty, perceived quality, brand awareness/association, brand satisfaction, corporate reputation and brand performance carrying 5, 3, 3, 5,4,3 and 4 items respectively has been taken. It has been found that the constructs under consideration are having reliability scores of 0.858106454, 0.872479131, 0.840937390, 0.861336206, 0.850348804, 0.836242813 and 0.816628622 respectively which are also more than the generally acceptable cut off of 0.65. It shows overall fitness as well as segment wise fitness of the forty two items questionnaire.
Table 4.1
Reliability Analysis: Chronbach’s Alpha (n = 516)
Constructs |
No. of Items |
Chronbach’s Alpha |
Inter-item Correlation (Mean) |
Corporate Social Responsibility |
5 |
0.858106454 |
0.639044182 |
Brand Loyalty |
3 |
0.872479131 |
0.657770515 |
Perceived Quality |
3 |
0.840937390 |
0.589695400 |
Brand Awareness/Association |
5 |
0.861336206 |
0.621066478 |
Brand Satisfaction |
4 |
0.850348804 |
0.603408154 |
Corporate Reputation |
3 |
0.836242813 |
0.539284585 |
Brand Performance |
4 |
0.816628622 |
0.646319621 |
Grand Total/Overall Reliability & Correlation |
27 |
0.961152512 |
0.466626821 |
Source: Primary Data, Compiled from MS Excel Output |
|||
After calculations of segment wise and overall reliability and correlations, it is also important to know the contribution of each item in overall reliability of the instrument. For this purpose, another set of analysis has been done in the present study by excluding one item in one go and then computing the overall reliability. This process can be better understood in the following manner. Here, first of all the overall reliability score is calculated which has been already done above. Then the first item is excluded and the reliability score is calculated. If this reliability score is less than the overall reliability score, it implies that the first item is positively contributing to the overall consistency of the instrument. Then the first item is replaced, second item is excluded and the reliability score is calculated to find the contribution of second item to overall consistency of the instrument. This process is continued till all the items are selected once then replaced and finally the contribution of each item to overall consistency of the instrument gets discovered. This is very popularly known as ‘Sensitivity of Chronbach’s Alpha’ and following this procedure the calculated values of reliability to exclusion of individual items has been represented in Table 4.2.
Table 4.2
Sensitivity of Chronbach’s Alpha to Exclusion of an Item (n = 516)
Excluded Item |
Chronbach’s Alpha |
Excluded Item |
Chronbach’s Alpha |
1 |
0.884136713 |
15 |
0.880242261 |
2 |
0.877958831 |
16 |
0.850597682 |
3 |
0.803423164 |
17 |
0.850484765 |
4 |
0.890132475 |
18 |
0.892978951 |
5 |
0.804138438 |
19 |
0.883641727 |
6 |
0.870124581 |
20 |
0.825792484 |
7 |
0.805885290 |
21 |
0.882530538 |
8 |
0.870233238 |
22 |
0.865825793 |
9 |
0.804124562 |
23 |
0.869394858 |
10 |
0.899744872 |
24 |
0.807650190 |
11 |
0.803315693 |
25 |
0.879625893 |
12 |
0.875894632 |
26 |
0.869458767 |
13 |
0.843726721 |
27 |
0.867974594 |
14 |
0.888728227 |
- - - |
- - - |
Note: Overall Reliability = 0.961152512 (Refer Table 4.1) Source: Primary Data, Compiled from MS Excel Output |
|||
Next to reliability analysis is descriptive analysis. The distribution is said to be normal if it takes a bell shaped curve and thereby the skewness and kurtosis computed out of the data becomes equal to zero (Malhotra, 2005). In an absolutely uni-variate data series, skewness value of more than 3.0 and kurtosis value of more than 10.0 may suggest a problem. Of the 27 items taken in the questionnaire and implemented on 516 respondents for generation of primary data, none have reported skewness of more than 3.0 or kurtosis of more than 10.0. In the prescribed scale from ‘1’ to ‘5’ denoting ‘Not Agree At All’ to ‘Strongly Agree’, the means of perception varied in between a range of 2.73 to 4.35 that implies that the perception of respondents is somewhat less than their expectations in a few attributes. It means that the claims of the chosen organization with reference to their CSR activities and brand image are even not fully getting approved by their own customers. Then, since the standard deviation is ranging between 0.96 to 1.38, it implies that the scores are tightly packed around their mean values. The skewness is ranging between -1.94 to 0.69 while the kurtosis is ranging between -1.31 to 3.89. It means there are a few items which are generating negatively skewed distributions and also there are another group of items that are generating positively skewed distributions. In other words, the data so generated have unveiled mixed results.
Table 4.3
Descriptive Analysis (n = 516)
Construct |
Variables |
Range |
Mean |
Std. Dev. |
Variance |
Skw. |
Kurt. |
Corporate Social Responsibility |
1 |
4 |
4.08 |
.997 |
.994 |
-1.804 |
3.530 |
2 |
4 |
3.01 |
1.190 |
1.415 |
.460 |
-1.200 |
|
3 |
4 |
3.94 |
1.074 |
1.153 |
-1.500 |
1.852 |
|
4 |
4 |
3.46 |
1.047 |
1.096 |
-.677 |
-.578 |
|
5 |
4 |
3.84 |
.962 |
.926 |
-1.580 |
2.576 |
|
Brand Loyalty |
6 |
4 |
3.58 |
1.118 |
1.250 |
-1.133 |
.394 |
7 |
4 |
4.31 |
.957 |
.916 |
-1.913 |
3.887 |
|
8 |
4 |
4.04 |
1.299 |
1.687 |
-1.402 |
.808 |
|
Perceived Quality |
9 |
4 |
3.71 |
1.030 |
1.061 |
-1.204 |
.907 |
10 |
4 |
4.35 |
1.162 |
1.350 |
-1.938 |
2.682 |
|
11 |
4 |
4.00 |
.993 |
.986 |
-1.647 |
2.902 |
|
Brand Awareness/Association |
12 |
4 |
3.91 |
1.026 |
1.052 |
-1.565 |
2.403 |
13 |
4 |
4.31 |
1.022 |
1.045 |
-1.919 |
3.572 |
|
14 |
4 |
3.87 |
1.005 |
1.010 |
-1.718 |
2.824 |
|
15 |
4 |
2.97 |
1.244 |
1.549 |
.508 |
-1.314 |
|
16 |
4 |
4.09 |
1.225 |
1.500 |
-1.307 |
.574 |
|
Brand Satisfaction |
17 |
4 |
3.72 |
1.107 |
1.226 |
-1.125 |
.544 |
18 |
4 |
2.73 |
1.116 |
1.245 |
.652 |
-.770 |
|
19 |
4 |
4.30 |
1.095 |
1.199 |
-1.695 |
2.041 |
|
20 |
4 |
2.82 |
1.239 |
1.536 |
.695 |
-1.051 |
|
Corporate Reputation |
21 |
4 |
3.83 |
1.068 |
1.141 |
-1.245 |
1.015 |
22 |
4 |
3.95 |
1.378 |
1.900 |
-1.019 |
-.409 |
|
23 |
4 |
3.82 |
.959 |
.919 |
-1.376 |
1.686 |
|
Brand Performance |
24 |
4 |
4.26 |
1.147 |
1.315 |
-1.692 |
1.980 |
25 |
4 |
4.13 |
1.241 |
1.541 |
-1.406 |
.787 |
|
26 |
4 |
4.21 |
1.207 |
1.457 |
-1.572 |
1.402 |
|
27 |
4 |
4.10 |
1.346 |
1.812 |
-1.299 |
.244 |
|
Source: Primary Data, Compiled from SPSS Output |
|||||||
Results of correlation analysis is shown in the following correlation table i.e. Table 4.4. As per the table, CSR is significantly correlated with brand loyalty, brand awareness/association and corporate reputation. Secondly, brand loyalty is significantly correlated with brand awareness/association and corporate reputation. Thirdly, perceived quality is significantly correlated with brand satisfaction and brand performance. And brand satisfaction is significantly correlated with brand performance. These results are also represented in Figure 4.1 for better understanding.
Table 4.4
Correlation Analysis (n = 516)
Constructs |
Corporate Social Responsibility |
Brand Loyalty |
Perceived Quality |
Brand Awareness/ |
Brand Satisfaction |
Corporate Reputation |
Brand Performance |
Corporate Social Responsibility |
1 |
|
|
|
|
|
|
Brand Loyalty |
0.828* |
1 |
|
|
|
|
|
Perceived Quality |
0.405 |
0.421 |
1 |
|
|
|
|
Brand Awareness/Association |
0.739* |
0.698* |
0.488 |
1 |
|
|
|
Brand Satisfaction |
0.426 |
0.479 |
0.668* |
0.509* |
1 |
|
|
Corporate Reputation |
0.783* |
0.723* |
0.484 |
0.726* |
0.456 |
1 |
|
Brand Performance |
0.546 |
0.463 |
0.675* |
0.493 |
0.678* |
0.414 |
1 |
Note: ‘*’ Correlation is significant at the 0.05level (2-tailed) Source: Primary Data, Compiled from SPSS Output |
|||||||
Figure 4.1
Correlation Analysis
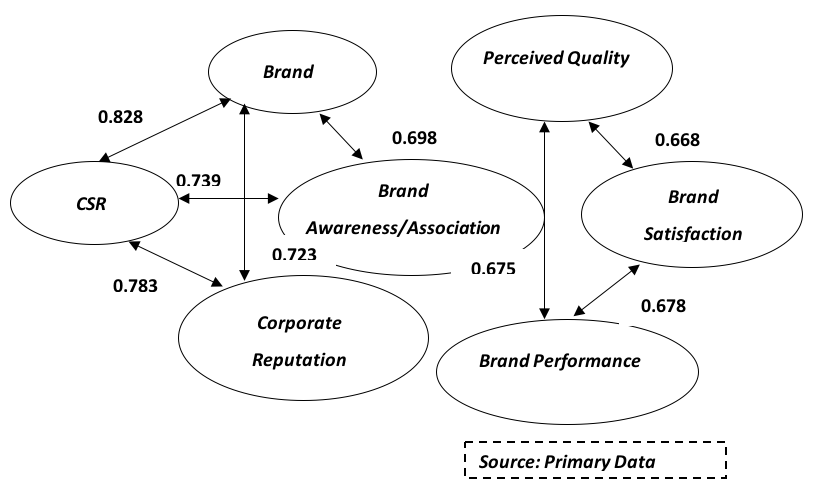
From the figure it can be seen that CSR is positively correlated with all the constructs under brand image, however, it is significantly correlated with only brand loyalty, brand awareness/association and corporate reputation. Now, after correlation analysis we have come to know that there exist positive relation between CSR and brand image, but correlation analysis do not say anything about the degree of influence of CSR on brand image, for which we have to run regression analysis the results of which are shown in Table 4.5 and Figure 4.2.
Table 4.5
Regression Analysis (n = 516)
Constructs |
|
t Value |
p value |
R square |
Adjusted R Square |
Brand Loyalty |
0.658 |
6.794 |
0.012* |
0.572 |
0.511 |
Perceived Quality |
0.253 |
2.173 |
0.054 |
0.483 |
0.437 |
Brand Awareness/Association |
0.712 |
5.619 |
0.036* |
0.568 |
0.503 |
Brand Satisfaction |
0.328 |
2.836 |
0.061 |
0.476. |
0.408 |
Corporate Reputation |
0.687 |
7.468 |
0.001* |
0.594 |
0.535 |
Brand Performance |
0.263 |
2.537 |
0.063 |
0.490 |
0.438 |
Note: ‘*’ Slope Coefficient Significant at 0.05level Source: Primary Data, Compiled from SPSS Output |
|||||
Source: Primary Data
------
Figure 4.2
Regression Analysis
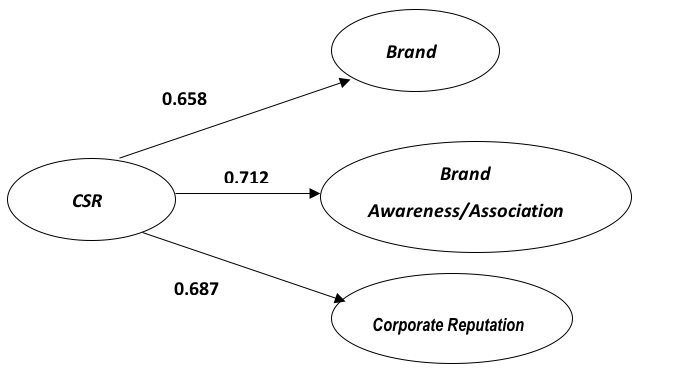
In the above table, it can be seen that the r squared values and adjusted r squared values are less than even 0.5 in case of regressions where perceived quality, brand satisfaction and brand performance have been taken as dependent variables. In these cases the slope coefficients represented by β is also not significant. But, the r squared values and adjusted r squared values are more than 0.05 along with the slope coefficient β being significant for the regressions where brand loyalty, brand awareness/association and corporate reputations have been taken as dependent variables. Hence, on the basis of r squared values and adjusted r squared values if we will discard the regressions then it can be said that CSR has got significant influence on the constructs brand loyalty, brand awareness/association and corporate reputations under brand image.
Hence, to summarize the results of regression analysis and its corollary correlation analysis, it can be said that CSR has got a positive relationship with all the constructs under brand image i.e. brand loyalty, perceived quality, brand awareness/association, brand satisfaction, corporate reputation and brand performance and CSR is able to influence all of the listed constructs positively; but CSR is able to influence significantly only three constructs which are: brand loyalty, brand awareness/association and corporate reputations. From the results is is evident that CSR actually influence brand image. In the present study, through a phase of primary research employing regression analysis on customers of two FMCG majors of India tried to assemble empirical evidences on positive impact of CSR on brand image.
This article is mainly based on the unpublished doctoral thesis of the first author. The authors are grateful to the teaching and non-teaching staff of Department of Business Administration, Utkal University for their constant support and facilitations throughout the process of this research work.
Abbott, W. F. & Joseph, M. R. (1979). On the Measurement of Corporate Social Responsibility: Self-Reported Disclosures as a Method of Measuring Corporate Social Involvement, Academy of Management Journal, 22 (3), 501– 515.
Bragdon, J. H. & Marlin, J. A. T. (1972). Is Pollution Profitable?, Risk Management, 19(1), 09– 18.
Carrol, A. B. (1979). A Three-Dimensional Conceptual Model of Croporate Performance, Academy of Management Review, 4(4), 497 – 505.
Daft, R. L. (2003). Management. USA: Thomson South-Western.
Davis, K. (1973). The Case for and Against Business Assumption of Social Responsibilities, Academy of Management Journal, 16(2), 312– 322.
Dawkins, J. & Lewis, S. (2003). CSR in Stakeholder Expectations: And Their Implications for Company Strategy, Journal of Business Ethics, 44(2/3), 185 – 193.
Lai, C., Chiu, C., Yang, C. & Pai, D. (2010). The Effects of Corporate Social Responsibility on Brand Performance: The Mediating Effect of Industrial Brand Equity and Corporate Reputation, Journal of Business Ethics, 95(1), 457 – 469.
Maignan, I. & Ferrell, O. C. (2004). Corporate Social Responsibility and Marketing: An Integrative Framework, Journal of the Academy of Marketing Science, 32(1), 03– 19.
Malhotra, N. & Birks, D. (2006). Marketing Research: An Applied Orientation. London: Pearson.
Mohr, L. A., Webb, D. J. & Harris, K. E.(2001). Do Consumers Expect Companies to be Socially Responsible? The Impact of Corporate Social Responsibility on Buying Behavior, The Journal of Consumer Affairs, 35(1), 45 – 72.
Naqvi, S. M. M. R., Maria, I., Nousheen, K., Ali, M. & Inderyas, S. (2013). Impact of Corporate Social Responsibility on Brand Image in Different FMCGs of Pakistan, Interdisciplinary Journal of Contemporary Research in Business, 5 (1), 79 – 93.
Porter, M. E. & Kramer, M. R. (2002). The Competitive Advantage of Corporate Philanthropy, Harvard Business Review, December 2002, 05 – 16.
Truker, D. (2009). Measuring Corporate Social Responsibility: A Scale Development Study, Journal of Business Ethics, 85(1), 411– 427.
Waddock, S. A. & Graves, S. B. (1997). The Corporate Social Performance – Financial Performance Link, Strategic Management Journal, 18 (4), 303– 319.
Wood, D. J. & Jones, R. E. (1995). Stakeholder Mismatching: Theoretical Problem in Empirical Research on Corporate Social Performance, International Journal of Organizational Analysis, 3(3), 229– 267.
1. Research Scholar, Department of Business Administration, Utkal University, Bhubaneswar – 751004, India. brijlalmallik@gmail.com
2. Associate Professor, Department of Business Administration, Utkal University, Bhubaneswar – 751004, India. d_sahu2000@yahoo.com
3. Research Scholar, IBCS, Siksha ‘O’ Anusandhan University, Bhubaneswar – 751003, India. dash_sisir@rediffmail.com