![]() ISSN 0798 1015
ISSN 0798 1015

![]() ISSN 0798 1015
ISSN 0798 1015
 Vol. 38 (Nº 62) Year 2017. Páge 34
Talgat Amanzholovich KUSSAIYNOV 1; Gulnara Sartaevna MUSSINA 2; Gizat Zhanarbekovna ABDYKEROVA 3
Received: 06/10/2017 • Approved: 05/11/2017
ABSTRACT: In Northern Kazakhstan, moisture plays a crucial role in forming yield capacity. At the beginning of sowing time, uncertainty regarding the level of moisture for ripping of cultures is significantly reduced by the reason that the amount of moisture in the soil becomes unknown due to the winter precipitation. This fact allows the development of a more accurate yield model in the planned year. In most cases, there is a stochastic interdependence of yield in different crops. This fact has a crucial significance when calculating the effective structure and combination of crops in the presence of risk. In a context of uncertainty, only the appropriate probability models can be an effective tool for the economic processes forecasting, while point forecasts are subject to forecast the distribution of studied phenomenon probability. Multifactor multiplicative model of yield capacity, which separately considered such factors as precipitation in winter and precipitation during the growing season, provides a more reasonable forecast of distributing the probability of yield capacity in planned year and allows the consideration of covariance dependence in yields of different crops. |
RESUMEN: 1273/5000 En el norte de Kazajstán, la humedad juega un papel crucial en la formación de la capacidad de rendimiento. Al comienzo del tiempo de siembra, la incertidumbre con respecto al nivel de humedad para la extracción de cultivos se reduce significativamente debido a que la cantidad de humedad en el suelo se vuelve desconocida debido a la precipitación invernal. Este hecho permite el desarrollo de un modelo de rendimiento más preciso en el año planificado. En la mayoría de los casos, existe una interdependencia estocástica del rendimiento en diferentes cultivos. Este hecho tiene una importancia crucial al calcular la estructura efectiva y la combinación de cultivos en presencia de riesgo. En un contexto de incertidumbre, solo los modelos de probabilidad apropiados pueden ser una herramienta efectiva para la previsión de los procesos económicos, mientras que los pronósticos puntuales están sujetos a pronosticar la distribución de la probabilidad del fenómeno estudiado. Modelo multiplicativo multifactorial de capacidad de rendimiento, que considera factores tales como precipitación en invierno y precipitación durante la temporada de crecimiento, proporciona un pronóstico más razonable de distribución de la probabilidad de capacidad de rendimiento en año planificado y permite la consideración de dependencia de covarianza en rendimientos de diferentes cultivos. |

Volatility is an integral feature of successful performance in any economic sphere, especially in agriculture and its major industry – crop farming. The volatility of economic performance is significant in economy of agriculture due to industry characteristics. Calmer periods with relatively lower volatility may be followed by the turbulent periods with results of large deviations from its expected values.
One of the key trends in the development of prognostics in social sciences, not excepting the economy is moving away from the point forecasts and concentrate on improving the methods of forecasting in form of statistical models, where the product of forecasting is the distribution of object state probability. In other words, appropriate probability models are the instruments for forecasting social and economic processes. In addition, studying the nature of forecast errors and deviations of actual values from the expected ones makes the content of scientific research.
Another defining trend of modern applied researches is the use of scientific approaches that allow taking decisions based on objective data obtained in tests and informal experience of researcher. One of such approaches is the Bayesian methodology, principles of which are widely used for the development and decision-making under uncertainty.
The growing instability of agricultural markets has the effect of increasing interest among researchers to the problems of effective management of economic risk in industry. Models of stochastic processes that take place in agricultural markets are the main tools of forecasting and effective decision-making under uncertainty.
The knowledge gained by experience is summarized and used to predict the future state of the object under investigation. One of the most authoritative scholars of the Bayesian theory, Jeffreys (1966), puts forward five basic rules of regulating the process of generalization (induction):
4. The theory must provide explicitly for the possibility that inferences made by it may turn out to be wrong.
5. The theory must not deny any empirical proposition a priori.
The first two rules are the criteria adopted in mathematics. The third and the fifth rules point to the differences between a priori and empirical observations. The fourth rule is kept in the spirit of materialist dialectic, and shows that these conclusions may be modified or replaced by others with accumulation of new facts. In other words, the truth can never be in the last resort.
Considered principles do not contradict common sense and have a strong practical orientation. Crucially, they allow the avoidance of difficulties (often insuperable), which we can be faced when trying to practically use the frequency interpretation of probability.
As it is known, there are two interpretations of probability: objective probability (frequency interpretation) and subjective probability, understood as "a reasonable level of confidence." Bernoulli (1986) was first to identify the classical definition of probability: "Probability is a degree of certainty and differs from absolute certainty as a part differs from the whole." In the objectivist sense, the probability of an event can be argued in the event of the complex of conditions being essentially reproducible for an unlimited number of times. Attributes of objective probability – a fundamental reproducibility and the possibility of performing an unlimited number of experiments while maintaining the same set of conditions—attest to the fact that, in accordance with the third rule of inductive inference, the objectivistic definition of probability is unacceptable to describe the actual observations. The specified condition for identifying objective probability – an unlimited reproducibility of an unchanging set of conditions – is as desirable as it is rare.
In the subjective sense, probability is a quantitative assessment of the event possibility that the researcher (or the decision maker) is setting based on his individual experience, in other words, a priori information about the experience or the phenomenon. This kind of information can be discussed in a situation when a set of external conditions cannot be considered constant. It passes a pre-individual generalization by researcher and only then receives a quantitative assessment. Subjective probability is adequate to the inductive inference theory, and at the same time satisfies the axioms of probability. Obviously, degrees of certainty are set approximately. Under these conditions, formulating the principles of decision-making is justified on the assumption that confidence levels cannot be measured accurately. However, it is necessary to take into account the effects of measurement error.
Thus, describing the uncertainty of objective probability is unacceptable as it is not a multiple reproducibility of constant conditions. While the subjective probability, as a degree of certainty, is an adequate description of uncertainty. In this sense, the subjective probability is not an alternative to the objective probability. The fact is that the objectivistic or frequency approach assumes that parameters of the phenomenon under investigation are not random, while its evaluations are random, because they are the functions of observation. Subjectivistic approach also involves the randomness of phenomenon parameters, as it considers that the observed process is subject to real random changes. Although it is conceivable that such representation does not always correspond to the reality. However, even if we assume that the parameter that reflects any existing property of researched phenomenon is not accidental, its exact value is unknown. Therefore, the parameter is uncertain. However, the frequency interpretation of probability cannot be used to describe the uncertainty, because it is impossible to repeatedly reproduce the conditions without changes. Therefore, it is necessary to use subjectivistic interpretation of probability to describe the uncertainty.
Application areas of objective and subjective probabilities can intersect only in rare cases dealing with a large number of experimental data, for example, in mass production. In this event, the subjective degrees of certainty are based on the available statistical material and coincide or almost coincide with objective probabilities. At small sampling (a small number of observations, past and current), the resistance of relative frequencies cannot be determined. Therefore, to obtain conclusion, it is necessary to use informal experience of researcher (decision-maker) that means the rejection of objective probability and accepting the subjective one.
In view of this, it is useful to consider the real meaning of the term "objective". The thought of possibility of using the subjective probability instead of the objective one, according to one of the researchers of this concept De Finetti (1974), "has shocked many people who consider the objectivity in the strict sense as a necessary attribute of probability and science. However, regrets in connection with the loss of absolute objectivity in probability and, consequently, in science are unfair. Nothing is lost, except for the obvious illusion. This illusory objectivity is now replaced by real achievable objective, is the degree of objectivity achieved by human science through the human mind." According to another expert in this field, Cornfield (1967), the objectivity of science finds its expression in the fact that some researchers, taking various priori probabilities as original, always come to the same posteriori in a large number of experiments. This fact is even assigned as a theorem (Mizesvon 1964). These statements once again demonstrate that the one criteria of objectivity is practice, which statistically is understood as a set of a large number of experimental data. Otherwise, there is no sense to talk about objectivity.
It should be noted that subjective probabilities are not introduced on their own, but as a rule, when, in order to study a phenomenon or forecast its future state, they try to attract as much available information as possible, including the informal experience of people.
In view of this, it raises the question how to estimate the subjective probability. The most acceptable methods to present the prior information in practical terms is to formulate a set of hypotheses, forming a complete group, and express as unit shares one’s personal attitude towards the possibility of implementing each of the hypotheses. A simple and clear rule of priori probabilities is as follows:
Thus, the probability of judgment may be presented in one of three types:
In the first case with a large number of experimental data, the confidence levels of both rationalistic and subjectivistic attitudes necessarily coincide with relative frequencies. In absolute absence of knowledge, the subjectivistic confidence levels are identical to the rational ones, that is, imply the adoption of uniform a priori probability distribution. In all other cases, that are absolute majority, subjective confidence levels should be taken with the necessity.
Collecting more information and its completion lead to major changes in the subjective assessment of possible outcome from the adoption of a decision. Firstly, with the accumulation of knowledge about the considered phenomenon, manager reduces the range of possible results. For example, a farmer, who does not have any information about the new technology of production, typically cannot deliver any valid boundary possible outcomes from its application. In addition, only receiving the information on the results of testing a new technology in a nearby farm or in his own farm, he may talk about the range of results, which may result from the use of new technology. Secondly, in obtaining the information about the behavior of the studied system, distributing the subjective probability of possible outcomes becomes significant. Consequently, we can more accurately assess the effectiveness of decisions.
The process of modifying the distribution of the a priori probability with the arrival of all new information about the behavior of the system under investigation is formalized using the Bayesian rule, in one form or another described in all works on the Bayesian methodology (Jeffreys 1966, DeFinetti 1974, Cornfield 1967). It is also disclosed in works dedicated to the risk management in agriculture (Hardaker et al, 1997, 2004). A Kazakh researcher Kussaiynov (2001, 2011) applied Bayes’ idea in his works. A rule can be applied consistently to analyze and revise the probability of event after receiving each piece of new information about the state of the system under investigation. Transformation according to Bayes allows getting the posterior distribution of the parameter, which is conditional towards the original information and empirical data.
In the context of the problem under consideration, it is very important to define the terms "uncertainty" and "risk", since in the development of management problems in the production and economic system (and not only), the attempts to distinguish between these two concepts are often made. Currently, there are different definitions of "uncertainty" and "risk". The most common of them is that the risk is an imperfect knowledge of event occurrence possibility, when the probability of its occurrence is known (Hadley 1967).
Uncertainty also exists when the probability is not known. However, as it is seen, in those cases, in which, based on past experience, it is impossible to individually assess the probability of each of the possible events set occurrence, they can be only ascribed the same subjective probability, in the amount equal to one. Objective (frequency) probability cannot be determined because of fundamental impossibility to repeatedly reproduce a constant set of conditions, and therefore it has no practical application. At the same time, as it is seen, the subjective probability is understood as a degree of certainty and is adequate to the description of uncertainty. Thus, the above formulation of differences between concepts of risk and uncertainty is useless and only introduces confusion in the development of system management in terms of instability of its parameters. Instead of this, the definitions of the uncertainty as the imperfect knowledge and of the risk as the possibility of adverse consequences from adoption of one or another decision make more sense. The following example illustrates the above mentioned. A farmer may declare that he cannot say with certainty what the weather will be next week—a meaningless statement, simply implying imperfect knowledge (or lack of it) about the future state of nature. However, if the same farmer says further that he decides to harvest grain next week, and that there is a risk that the weather will be bad in that period, it is clear that this reasoning indicates his concern about the consequences of taking decisions. The proposed definitions of risk and uncertainty are important in the development of practical planning in production and marketing at agricultural enterprises.
Taking risk is to allow a significant chance of economic loss in the form of direct losses or cost of lost profits. In such cases, time and effort required for the formal structuring of problem, collecting of necessary information and analysis of problem solving in terms of the possible consequences are justified if they lead to the best choice in a certain sense.
Selecting a particular set of crops, the scale and structure of crops by a farmer is carried out primarily from economic considerations, from the analysis based on the "income-risk" principle. Different decisions taken before the start of agricultural work on the combination and structure of crops, give different estimates of the expected economic effect of crop production. In turn, the assessment of the expected economic effect is based on forecasts of the crop yield capacity and prices, both on products and on resources used. However, uncertainty about the price of resources for the beginning of sowing time, as a rule, is practically already removed. Therefore, two other indicators – the crop yield capacity and the price of the products – are in the zone of attention.
In Northern Kazakhstan, moisture has a crucial role for the formation of productivity (Suleymenov 2011, Akshalov 2011, Kiyas 2011, Skoblikov, Shupanov 2011). The moisture accumulated during the winter season as well as in the growing season is used. By early sowing time, uncertainty regarding the level of moisture for aging cultures is greatly reduced for the reason that the amount of moisture in the soil becomes known due to the winter precipitation. However, the uncertainty of the productivity level is still preserved, although in reduced form, as weather forecasts for the coming growing season are unreliable. In rare cases, farms have a reliable basis of data on moisture accumulated in the soil before planting for a number of years for the analysis and decision-making in crop farming. Therefore, the modeling and forecasting of yields and the distribution of their probability must be limited to the observational data on the amount of precipitation during the observed season. Calculations of the correlation between yields of agricultural crops and amount of precipitations in winter indicate that there is a moderate relationship between these parameters in Northern Kazakhstan as a whole. In this case, the relationships are observable in those farms, where the winter moisture is accumulated in soil.
In the planning of agricultural crops, the statistical model of crop yields can be evaluated in two ways. One of them is to build a model of crops productivity separately for each culture without reference to other cultures. This approach is justified only if the variables (of crop yield) are stochastically independent of each other. Variables are considered mutually stochastically independent if distributing the probability of one of them does not depend on the probability of values taken by the other. In practice, however, the full independence of stochastic variable is the exception rather than the rule. Ignoring the interdependence of variables in planning may lead to unacceptable, erroneous decisions. On the other hand, record of stochastic relationship in yields of different cultures is a rather difficult task in decision-making. Therefore, in those rare cases, when the covariance of variables is considered insignificant, it is permissible to ignore this problem. For example, there is a clear stochastic relationship of fluctuations in yields. However, in respect to potatoes and wheat yields productivity, it can be said without prejudice that there is probably no connection.
In most cases, there is a stochastic interdependence of variables, in this case, the crop yields. In addition, if the task is to calculate an economically effective structure and a combination of crops, then in the relevant optimization risk-model, it is necessary to take into account the mutual distribution of the probability of yields in different crops. The task is not easy and requires the development and use of instructional techniques and procedures that allow taking into account the relationship of changes in the levels of variables involved in the analysis.
Appropriate presentation of topics in scientific research is possible only based on interdisciplinary approach involving experts from different areas of knowledge: land economies, agriculture, and computer science. Methodology of research is a system analysis; used method of research is methods and procedures of mathematical and statistical modeling of economic processes under conditions of uncertainty. In this case, using the Bayesian modeling principles of stochastic processes is of key importance.
Historical data of sufficient volume can be directly used in the analysis. Evaluation method of a statistical yields model is based on the assumption that the stochastic interdependence of variables needs specific reasons.
The basic properties of the joint distribution of the probability of studied variables can be approximately evaluated by identifying these causes and modeling the connection between them and the considered variables. With regard to the formation of crop yields, as already noted, in Northern Kazakhstan, the moisture and temperature conditions are crucial, especially in critical moments for the development of crop farming. Changes are also important in the manufacturing technology, which in most cases cause the presence of trends in time series. However, the technology is a controllable factor. Therefore, in case when a time series of yield is long enough and there is reason to believe that in the considered period there were improvements in the technology of crops cultivation, time series firstly must be relieved from the influence of trend. In respect of cost variables, such as income, data series must be adjusted for inflation as well as for a possible trend in the dynamics of prices for agricultural products.
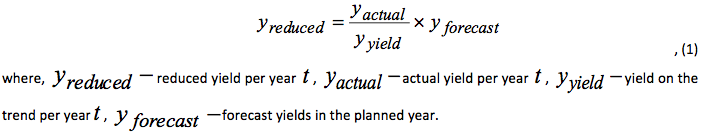
Kussaiynov (2001) in his work represents a method for eliminating the trend component of productivity in agricultural crops. The method consists in calculating the so-called reduced yield, which is interpreted as an estimate of yield in recent years in the conditions of planned year (taking into account modern technology and achieved level of the production intensification). The crop yield is calculated based on the actual crop yield data for a number of consecutive years as follows:
It should be noted that the above method for eliminating the trend component could be successfully applied in respect to any other factors, including cost.
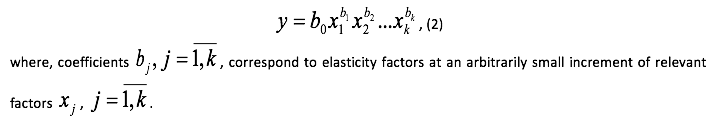
Using a multiplicative model of Cobb-Douglas is of major importance for modeling a relationship between yield and hydrothermal conditions. The rationale basis for this assumption is that the degree of hydrothermal conditions impact in the growing season on the crop farming development and yield formation is determined by the level of soil moisture due to winter precipitation. Conversely, the efficiency of accumulated winter moisture in some extent dependents on weather factors in culture growing season. In other words, the influence of factors on the result cannot be considered in isolation from each other. The multiplicative regression model allows taking into account the specified feature:
Methodical procedures of forecasting the statistical distribution of productivity using a multiplicative model can be examined through the materials on wheat production at the "Akmola Phoenix" Company in the North Kazakhstan region. In the conditions of an enterprise, the following indicators are taken as a factor of variables: the total amount of precipitation for September–April (the accumulated moisture), total precipitation for May–August (the growing season and temperature in June). Table 1 presents data on spring wheat yield and hydrothermal conditions in the period from 1980 to 2011.
Table 1.
Yields of spring wheat and hydrothermal
data of "Akmola Phoenix" JSC for 1980–2011
Year |
Temperature in June, C |
Precipitation in September–April, mm |
Precipitation in May–August, mm |
Yields, dt/ha |
Year |
Temperature in June, C |
Precipitation in September–April, mm |
Precipitation in May–August, mm |
Yields, dt/ha |
1980 |
18.6 |
122 |
216 |
10.3 |
1996 |
19.8 |
232 |
121 |
14.2 |
1981 |
20.1 |
146 |
134 |
10.5 |
1997 |
19.8 |
153 |
102 |
8.9 |
1982 |
20.8 |
111 |
109 |
6.5 |
1998 |
21.7 |
117 |
137 |
6.5 |
1983 |
20.0 |
196 |
114 |
14.5 |
1999 |
15.1 |
108 |
191 |
13.2 |
1984 |
18.8 |
168 |
83 |
8.7 |
2000 |
19.6 |
133 |
149 |
6.9 |
1985 |
18.8 |
236 |
146 |
22.6 |
2001 |
18.4 |
164 |
189 |
8.9 |
1986 |
16.4 |
172 |
143 |
22.3 |
2002 |
17.3 |
248 |
159 |
10.2 |
1987 |
18.3 |
181 |
152 |
21.3 |
2003 |
18.3 |
145 |
181 |
13.8 |
1988 |
21.1 |
172 |
158 |
15.2 |
2004 |
19.9 |
158 |
168 |
9.5 |
1989 |
18.9 |
165 |
99 |
11.6 |
2005 |
20.6 |
174 |
177 |
9.6 |
1990 |
21.5 |
211 |
206 |
21.3 |
2006 |
21.3 |
132 |
128 |
9.8 |
1991 |
23.1 |
157 |
68 |
12.5 |
2007 |
18.0 |
234 |
139 |
12.3 |
1992 |
16.1 |
159 |
222 |
25.3 |
2008 |
20.1 |
157 |
184 |
8.5 |
1993 |
18.8 |
162 |
198 |
11.1 |
2009 |
18.8 |
157 |
177 |
11.9 |
1994 |
22.2 |
106 |
190 |
9.7 |
2010 |
21.6 |
195 |
80 |
5.0 |
1995 |
18.7 |
162 |
169 |
7.0 |
2011 |
19.8 |
122 |
214 |
16.6 |
Data from the Table 1 shows that in the period from 1980 to the middle of 1990, there was a strong direct correlation between the yield of spring wheat and winter precipitation levels. The correlation coefficient in specified period was 0.7; less tangible relationship occurred between yield and precipitation during the growing season (0.4).
Since the middle 1990 to the beginning of 2010, the relationship between productivity and the amount of precipitation in winter almost disappeared. The correlation was at zero. However, there was a slight increase in the dependence of yields on summer wetting (0.5). At the same time, the average annual precipitation, both in winter and in summer, remains unchanged. Temperature conditions at critical periods for the development of crop farming (June decade) did not change as well. These circumstances can indicate only that in the economy, from the mid-90s, farmers practically stopped taking measures to accumulate winter moisture in the soil. Accordingly, the average yield of spring wheat decreased significantly. If in the first of the considered time intervals the productivity of wheat fields was 14.9 dt/ha, in the second period – only 10.2 dt/ha. Objectively the dependence of crop yields from the level of winter moisture accumulated in soil did not disappeared. We can only say that since the middle 1990, farmers ceased the systematically useful utilization of dropped precipitation during the cold season.
Evaluation of relationship between the temperature in June and yield indicates the presence of a significant inverse correlation between indicators (-0.5).
In view of these facts, to establish the relationship between wheat yield and hydrothermal conditions for illustrative purposes, the observational data from 1980 to 1994 was used. Trend in yields of spring wheat in this period was practically absent.
The linearized statistical model of relationship between yields of spring wheat, on the one hand, and the winter and summer precipitation and temperature, on the other hand, took the following form in a farm:

Estimation of model in whole by F-test of Fisher indicates its significance at the level of 0.05. The coefficient of determination was 0.72. However, out all of parameters, the coefficient of the variable x2 (winter precipitation, = 0.01 at the level of credibility α=0.01) is only essential for Student's t-test. The coefficient of the summer precipitation variable is negligible, even at the level of α = 0.1. The coefficient of variable x3 (temperature) and free coefficient cause even less trust. In the resulting equation, they become significant only at a level close to 0.3. The above features of the model can be explained by the fact that there is a correlation of moderate intensity (reverse, -0.3) between the data series in summer precipitation and temperature, while between the winter and summer precipitation, as well as between winter moistening and summer temperatures, this relationship is practically absent. Thus, these parameters are too sensitive to any changes in the input data, making a model unreliable for use in forecasting.
When the temperature is excluded from the analysis, the following regression equation is obtained:

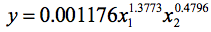
At the level of 0.05, all received coefficients in the equation are significant. Estimated F-statistic of the equation is equal to 13.09 at the table value of 3.89 at a significance level of 0.05. Therefore, the model is significant at this level. The determination coefficient is 0.69. This suggests a significant high predictive force of the model. As it is seen, the determination coefficients in the equations (3) and (4) were approximately identical. This fact also indicates in favor of the model (4), even if in the model (3), all the coefficients were significant. Under other conditions being equal, a model with a smaller number of factor variables is always more preferable.
Let us rewrite the equation (4) in the multiplicative form (2):
In the period from September 1993 to April 1994, the total volume of precipitation in farm was 106 mm. Therefore, before the sowing season, the equation shall have the following form:

In other words, forecasting with two unknowns turns into a task with a single unknown variable. To compile statistical forecast model, the probability of precipitation distribution in the coming growing season should be estimated. The easiest way to approximately estimate the probability distribution of precipitation is in calculation of relative frequency of precipitation levels based on available data from previous observations. For this, the entire range of possible precipitation is divided into equal intervals and the number of observations placed on a given interval is calculated. Thus, the identified relative frequency of each interval of precipitation is used as the estimates of probability.
However, the use of relative frequency as the so-called objective probability is very unreliable. In fact, there are several reasons, the main of which is the fundamental impossibility to perform the whole complex of conditions in the future that occurred in the past.
Another important obstacle to the successful implementation of the abovementioned calculation scheme is that, in practice, a large enough amount of data can be rarely collected. However, even the availability of a complete database of conditions and results of economic activity in the past is not a panacea for errors in forecasting, analysis and decision-making. In case of tangible changes in economic conditions for farm operators or in the presence of too small database, the use of results of the previous observations always lead to erroneous conclusions on the future state of the economic system. For example, a radical change in social and economic relations that have taken place in the Kazakhstani society since 1990 coupled with a noticeable change in the climatic conditions force a critical rethinking of the production and economic data for the period up to the mid-1990s, before using this data for the analysis and forecasting in changing conditions. In other words, not always the data on the results and conditions of economic activity that took place in the past can serve as a rational basis for forming decisions on production management in the future. Therefore, the pragmatic usefulness has prediction methods based on use of historical data combined with subjective approach to assessing the probability of a certain event. In fact, assessing the probability of the future state of economic system is always subjective. All probabilities are subjective, even if they are based on so-called objective data (Kussaiynov 2011).
In the context of the problem under consideration, methods for estimating the statistical model of the indicator, based on fairly simple procedures and calculation methods, have perspective. One of them is to use a so-called triangular distribution of probability. It is very convenient in those cases, in which assessing the probability of any event prevails subjective judgments. For example, in case of insufficient number of observations or in cases when significant changes are expected in economic conditions. In other words, in situations when it is necessary to involve experts to solve problems and to rely on their experience and subjective evaluation. Triangular distribution feature is that it can be completely determined by using only three pieces of data: the lowest a, highest b and most likely m value of variable. The simplicity of this type of distribution has special advantages with insufficient sample data, when farmers or experts in the field of agriculture can assess the probability distribution only subjectively. Another important advantage of the triangular distribution is that the mechanism for its evaluation is quite understandable for farmers and therefore, more likely, they will trust it. The triangular distribution of probability then can be usefully applied in modeling of stochastic processes for interval estimation of probability (based on a formula of cumulative distribution). In addition, it should be noted that the expectation value and variation of distribution could serve as a basis for comparative assessment of different industries (products).
In this example, based on observational data for 1980-1994, the most expected precipitation in summer is in the range of 160-170 mm, the smallest – 68 mm, the largest – 222. The assessment of probability based on triangular distribution is very convenient to carry out using a function of random number in MS Excel (in this example, the results obtained under 100 tests). Table 2 shows the interval estimation of probability distribution of precipitation during the growing season in the "Akmola Phoenix" JSC. The relative number of intervals is equal to 5.
Table 2
Interval estimation of the probability distribution of precipitation during the growing season
Interval of precipitation, mm |
67.9-98.8 |
98.8-129.6 |
129.6-160.5 |
160.5-191.3 |
191.3-222.2 |
Probability |
0.10 |
0.14 |
0.34 |
0.29 |
0.13 |
Then, using the equation (5), the statistical distribution of spring wheat in the "Akmola Phoenix" JSC can be assessed. Table 3 shows distribution in the observation period from 1980 to 1994 for the illustrative purposes. The bottom row of the Table shows the probability values for each possible outcome.
Table 3
Statistical distribution of spring wheat
Year |
Interval of yield, dt/ha |
||||
1980 |
< 7.9 |
< 9.0 |
< 10.0 |
< 10.9 |
< 11.7 |
1981 |
10.2 |
11.6 |
12.9 |
14.0 |
15.1 |
1982 |
6.9 |
7.9 |
8.8 |
9.5 |
10.2 |
1983 |
15.2 |
17.4 |
19.2 |
20.9 |
22.5 |
1984 |
12.3 |
14.1 |
15.6 |
17.0 |
18.2 |
1985 |
19.8 |
22.5 |
24.9 |
27.1 |
29.2 |
1986 |
12.8 |
14.5 |
16.1 |
17.5 |
18.8 |
1987 |
13.7 |
15.6 |
17.3 |
18.8 |
20.2 |
1988 |
12.7 |
14.5 |
16.1 |
17.5 |
18.8 |
1989 |
12.0 |
13.7 |
15.2 |
16.5 |
17.7 |
1990 |
16.9 |
19.2 |
21.3 |
23.1 |
24.9 |
1991 |
11.2 |
12.8 |
14.2 |
15.4 |
16.6 |
1992 |
11.5 |
13.1 |
14.5 |
15.8 |
17.0 |
1993 |
11.8 |
13.4 |
14.9 |
16.2 |
17.4 |
1994 |
6.6 |
7.5 |
8.3 |
9.0 |
9.7 |
Probability |
0.10 |
0.14 |
0.34 |
0.29 |
0.13 |
Note. The upper limit of the previous interval also means the lower limit of subsequent interval |
|||||
Note, that the average yield of spring wheat for the reviewed period in the "Akmola Phoenix" Company is 14.9 dt/ha. In addition, if to predict the yield on its long-term average level in years with low winter precipitation, the forecast will be clearly overvalued. Conversely, a conservative forecast occurs if the level of winter precipitation is above its long-term average. As it is seen, methodical ways for calculating the statistical model based on Bayesian principles give more reasoned forecasts and allow the avoidance of too optimistic or, on the contrary, pessimistic estimates of crop productivity.
Forecasts on the statistical distribution for other crops grown on the farm are calculated according to this scheme. Thus, obtained statistical distribution of crop yields can be used further in optimizing the structure and combination of crops in the enterprise in conditions of uncertainty.
In the "Akmola Phoenix" Company, modeling of statistical distribution of crop yields with the use of such factors as the level of winter precipitation and summer precipitation gives satisfactory results. This model provides for using quite simple procedures to evaluate probability properties of the forecast.
Given methodical ways of crop yields forecasting based on Bayesian principles can be recommended for use in farms, where a systematic register of the moisture content in soil is kept before sowing. Particularly, in those enterprises that take annual measures for the accumulation of winter moisture and, therefore, feature a significant correlation between crop yield and precipitation in winter.
In addition, it should be noted, that discussed techniques and procedures to model and forecast stochastic processes in crop farming provide insight into the probability distribution of crop yields. Involvement in the analysis of additional factors of uncertainty can improve the quality of forecasting model. However, at that, analyzing the probabilistic characteristic of forecasting seems to be considerably complicated. In any case, in practice, according to the Nobel laureate in economics Paul Samuelson (1967), "a rude approximation can be better than none at all", given that the method for calculating the probability distribution of crops productivity has a pragmatic utility.
Akshalov K., Sagimbayev M., Nossacheva N., Eikhvald Yu. Experience in crop diversification and No-till technology at the level of farms: results, problems. Article presented at the international conference "Crop diversification and No-Till as a basis of conservation agriculture and food security," Astana-Shortandy, Kazakhstan, July 23–24, 2011.
Bernulli Ya. (1986). Law of large numbers, Мoscow: Science, pp. 176.
Cornfield, T. (1969).The Bayesian Outlook and its Application. Biometrics, (35)1: 617–657.
Finetti, B. (1974). Bayesianism: its unifying role for both the foundations and applications of statistics. International Statistical Review, (42)1: 117–130.
Jeffreys, H. (1966). Theory of Probability. Oxford: Clarendon Press, pp. 428.
Hardacker, J.B., Huirne, R.B.M., Anderson, J.R. and Lien, G. (2004). Coping with risk in Agriculture. CAB International, Wallingford.
Kiyas А. (2011). Leguminous plants in crop rotation in conditions of Northern Kazakhstan. Article presented at the international conference "Crop diversification and No-Till as a basis of conservation agriculture and food security," Astana-Shortandy, Kazakhstan, July 23–24, 2011
Mizes von, R. (1964). Mathematical theory of probability and statistics. New York: Acad. Press, pp. 360.[9] Hardaker, J.B., Huirne, R.B.M. and Anderson, J.R. (1997).Coping with Risk in Agriculture. Wallingford, CAB International.
Kussaiynov Т. (2001). Science of risk management in Agriculture. Astana: Akmola Institute of Management, pp. 127.
Kussaiynov Т. (2011). Analysis, Forecasting and Decision Making. Astana: Akmola Institute of Management, pp. 229.
Hadley, G. Introduction to Probability and Statistical Decision Theory. San Francisco: Holden-Day, 1967.
Suleymenov M.K. Basics of resource-saving farming system in Northern Kazakhstan – crop rotation and zero or minimum tillage. Article presented at the international conference "Crop diversification and No-Till as a basis of conservation agriculture and food security," Astana-Shortandy, Kazakhstan, July 23–24, 2011
Skoblikov V., Shupanov E. Rape in crop steam and crop rotation in rotation. Article presented at the international conference "Crop diversification and No-Till as a basis of conservation agriculture and food security," Astana-Shortandy, Kazakhstan, July 23–24, 2011
Samuelson P.A. General proof that diversification pays. The Journal of Financial and Quantitative Analysis, 2(1) (1967): 1–12.
1. Saken Seifullin Kazakh Agro Technical University, Republic of Kazakhstan, 010011, Astana, Zhenis avenue, 62
2. Saken Seifullin Kazakh Agro Technical University, Republic of Kazakhstan, 010011, Astana, Zhenis avenue, 62; E-mail: gmusina@mail.ru
3. Saken Seifullin Kazakh Agro Technical University, Republic of Kazakhstan, 010011, Astana, Zhenis avenue, 62