![]() ISSN 0798 1015
ISSN 0798 1015

![]() ISSN 0798 1015
ISSN 0798 1015
 Vol. 38 (Nº 62) Year 2017. Páge 14
Aleksandr Vyacheslavovich ANIKIN 1; Nadezhda Igorevna YASHINA 2; Oleg Vladimirovich TROFIMOV 3; Vladislav Genrikhovich FROLOV 4; Aleksey Sergeevich UDALOV 5
Received: 06/10/2017 • Approved: 25/10/2017
ABSTRACT: The article is devoted to solving the problem of functional diagnostics of the redistribution process of financial resources of the Russian stock market. In solving the problem, a diagnostic entropy model is formulated. It allows obtaining a reliable estimate of the tendencies connected to the fact that the stock market fails to perform the function of financial resources redistribution for the analyzed time period. The scientific novelty of the article consists in that, for the first time, the technique of evaluation of the stochastic system entropy formulated by Tyrsin and Vorfolomeeva is applied to construction of a diagnostic model of the Russian stock market. Also, the authors propose a new quantitative indicator characterizing the intensity of the process of capital transfers between the participants in the appropriate cluster of the stock market. On the basis of the time series of the daily values of the proposed indicator for five clusters of the organized stock market, a system of factors was formed. The use of this system of factors in the entropy model allowed estimating the change of entropy of the Russian stock market for semi-annual time intervals for the period from 2015 to 2016. The analysis of the data obtained by the model revealed a trend demonstrating a decreasing role of the stock market of the Russian Federation in the organization of redistribution process of financial resources during 2015-2016. |
RESUMEN: El artículo está dedicado a resolver el problema del diagnóstico funcional del proceso de redistribución de los recursos financieros del mercado de valores ruso. Al resolver el problema, se formula un modelo de entropía de diagnóstico. Permite obtener una estimación confiable de las tendencias relacionadas con el hecho de que el mercado de valores no cumple la función de redistribución de recursos financieros para el período analizado. La novedad científica del artículo consiste en que, por primera vez, la técnica de evaluación de la entropía del sistema estocástico formulada por Tyrsin y Vorfolomeeva se aplica a la construcción de un modelo de diagnóstico del mercado de valores ruso. Además, los autores proponen un nuevo indicador cuantitativo que caracterice la intensidad del proceso de transferencias de capital entre los participantes en el clúster apropiado del mercado de valores. Sobre la base de la serie de tiempo de los valores diarios del indicador propuesto para cinco conglomerados del mercado de valores organizado, se formó un sistema de factores. El uso de este sistema de factores en el modelo de entropía permitió estimar el cambio de entropía de la bolsa de valores de Rusia para los intervalos de tiempo semestrales para el período de 2015 a 2016. El análisis de los datos obtenidos por el modelo reveló una tendencia que demuestra una papel decreciente del mercado de valores de la Federación de Rusia en la organización del proceso de redistribución de los recursos financieros durante 2015-2016. |

The stable development of the modern financial system is the key to the effective transformation of savings into investment and the competitiveness of the national economy. Achieving and maintaining financial stability is impossible without effective distribution of financial resources on the part of financial intermediaries, financial markets and financial infrastructure, and without effective carrying out by them of key macroeconomic functions. The disturbance of the process of transformation of financial resources and functional destabilization of the entities of the financial system occur as a result of the impact of destructive processes, phenomena and events. In this regard, the problem of early detection of such crisis factors is closely related to solving the problem of systemic functional diagnostics.
The organized stock market is an integral part of the financial system. One of the main functions performed by the organized stock market is the process of redistribution of ownership of securities. In addition, the stock market promotes intersectoral and cross-industry transfer of savings of the participants in the financial system. Solving the problem of identifying the signals that testify to the failure of these functions of the stock market is a part of the complex task of functional diagnostics of the financial system as a whole. The modern systemic approach and the general theory of systems consider information as a quantitative measure of the closeness and effectiveness of interaction of the system elements. Thus, information can be considered as a quantitative measure of both systemic stabilization and destabilization. The formalization of the information criterion within the diagnostic problem is reflected in entropy modeling.
At the present stage of the development of economic science, the entropy approach is beginning to be applied in scientific research to evaluate the efficiency of functioning of the raw materials markets (Ortiz-Cruz, Rodriguez, Ibarra-Valdez, & Alvarez-Ramirez 2012) and financial markets (Alvarez-Ramirez, Rodriguez, & Alvarez 2012; Bury 2014; Eom, Oh, & Jung, 2008; Kristoufek, & Vosvrda, 2014; Li, Liang, Zhu, Sun, & Wu, 2013; Sheraz, Dedu, & Preda, 2015). Let us consider the following studies in more detail. Bury (2014) in his dissertation "Collective behaviors in the stock market. A maximum entropy approach" constructs a pairwise maximum entropy model of stock market. The author "shows that a pairwise maximum entropy model (or autologistic model) is able to describe switches between the ordered (strongly correlated) and disordered market states" (Bury 2014). He also "shows that it is a statistically consistent model since pairwise co-movements explain almost all statistical dependencies" (Bury 2014). Sheraz et al. (2015) use the entropy approach in order to estimate a volatile stock index. They view the term "entropy" as the measure of disorder, uncertainty or ignorance of a system which also resembles the features of the stock market volatility. They use "the Tsallis, Shannon and Renyi entropy measures and the approximate entropy as well as an alternative way to reflect the stock market volatility. Computational results show that the Paris Index for the period 2000 to 2012 is more volatile than other underlying indices in both weekly and monthly data series" (Sheraz, Dedu & Preda 2015). In the study "Risk Contagion in Chinese Banking Industry: A Transfer Entropy-Based Analysis" by Li et al. (2013), based on the stock market data, the authors form an entropy model, determine the degree of interconnection of Chinese credit institutions within the banking cluster, and simulate the process of realizing systemic risks in the banking sector of China (Li, Liang, Zhu, Sun & Wu 2013). The absence of a single entropy theoretical concept, explaining the functioning of financial markets, indicates the poor development of the problem under study and the need for further scientific research in this field.
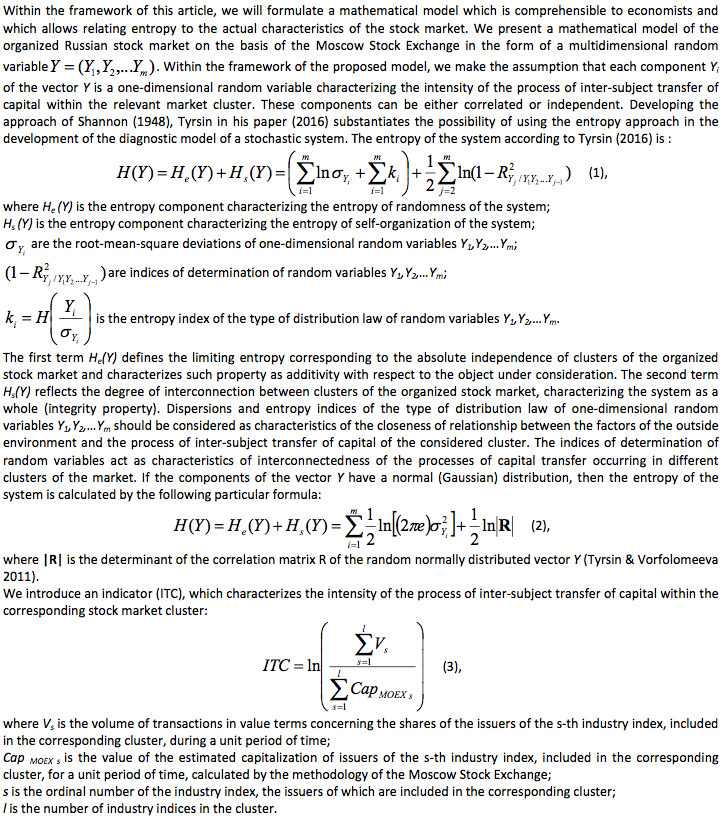
For the purposes of our analysis, the following conventional clusters of the organized stock market are introduced: the "production and energy" cluster, the "raw materials sector" cluster, the "financial sector" cluster, the "innovations and telecommunications" cluster, and the "transport, trade and consumer sector" cluster. The indicators of the "production and energy" cluster are calculated on the basis of such sector indices of the Moscow Stock Exchange as the index of energy, the index of mechanical engineering, and the index of chemical production. The indicators of the "raw materials sector" cluster include the data on the oil and gas index, and the index of metals and extraction. The indicators of the "financial sector" cluster are calculated according to the index of banks and finance. The indicators of the "innovations and telecommunications" cluster are determined taking into account the data of the telecommunications index and the MICEX Innovation Index. The indicators corresponding to the "transport, trade and the consumer sector" cluster are formed on the basis of the transport index, the index of consumer goods and trade.
The parameter Cap MOEX s differs from the total market capitalization of issuers, as it is adjusted by a correction factor that takes into account the number of securities of an issuer in free circulation (free-float ratio). Also, this indicator can be adjusted with the help of a coefficient, which is set by the exchange, limiting the capitalization ratio of shares of a particular issuer (weight coefficient). The first coefficient allows cutting off the volume of capital that is owned by strategic owners and whose probability of transfer through an organized market is small. The second coefficient smooths out the impact on the capitalization of the largest issuers. As a unit period, one day is taken. The initial data for the calculation of the indicator is the data on one-day volumes of trading in securities and the one-day estimated capitalization of issuers that are taken into account when calculating the industry indices of the Moscow Stock Exchange (Moscow Exchange. Sectoral Indices of Moscow Exchange: Chemicals, n.d; Moscow Exchange. Sectoral Indices of Moscow Exchange: Consumer Goods and Services, n. d.; Sectoral Indices of Moscow Exchange: Electric Utilities, n. d.; Moscow Exchange. Sectoral Indices of Moscow Exchange: Financials, n. d.; Moscow Exchange. Sectoral Indices of Moscow Exchange: Manufacturing, n. d.; Moscow Exchange. Sectoral Indices of Moscow Exchange: Metals & Mining, n. d.; Moscow Exchange. Innovation Index MICEXINNOV, n. d.; Moscow Exchange. Sectoral Indices of Moscow Exchange: Oil & Gas, n. d.; Moscow Exchange. Sectoral Indices of Moscow Exchange: Telecoms, n. d.; Moscow Exchange. Sectoral Indices of Moscow Exchange: Transport, n. d.)
The ratio of the volume of transactions to the value of the estimated capitalization shows the fraction of the estimated capitalization of the issuers of the corresponding cluster, redistributed among market participants during the day. In fact, this indicator illustrates the capacity of the market to redistribute capital.
Table 1
Algorithm for diagnosing possible variants of market situations,
determined through a change in the ITC indicator
Value of indicator |
Short term period |
Medium and long term period |
ITC → 0 |
a) Panic on the stock exchange due to falling stock prices and a wave of sales inside the cluster; b) Feverish demand for shares of the issuers of the cluster |
An increase in the role of the stock market in the organization of the process of inter-subject transfer of capital within the cluster |
ITC → −∞ |
Reduction of liquidity for shares of the issuers of the cluster traded on the market |
Reduction of the role of the stock market in the organization of the process of inter-subject transfer of capital within the cluster |
Table 1 presents an algorithm for diagnosing the change in the market situation in a particular stock market cluster through the proposed indicator (ITC). Using the proposed algorithm and data on the dynamics of ITC for five clusters, we will analyze the potential of these clusters in the context of providing the process of inter-subject transfer of capital.
Figure 1
Dynamics of the ITC indicator in the considered clusters
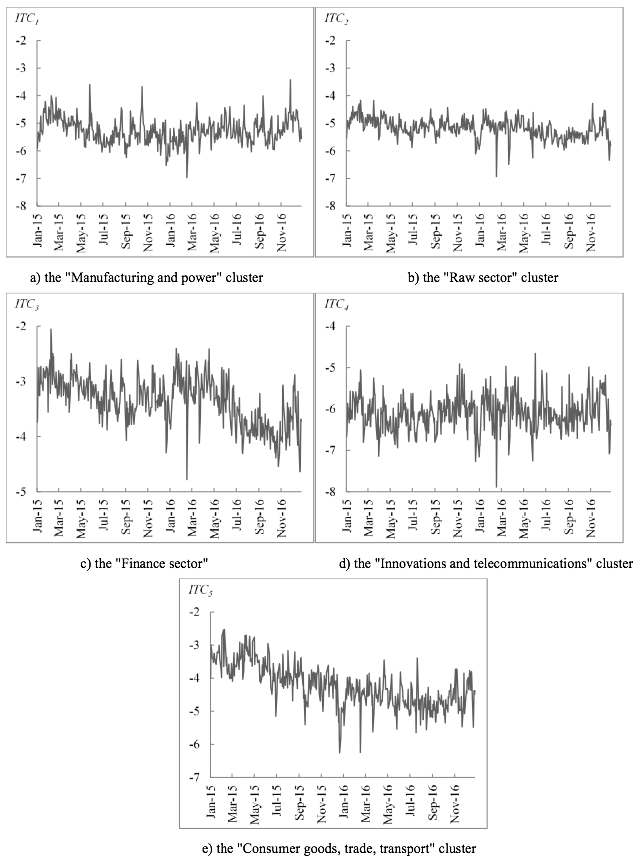
The dynamics of the ITC indicator for the respective clusters is shown in Figure 1. The "Raw sector" cluster is characterized by a weak downward trend in the ITC indicator. The "Finance sector" and "Consumer goods, trade, transport" clusters are characterized by a volatile downward trend in the ITC indicator. The obtained empirical results testify to reduction of the role of the share market in the organization of process of inter-subject transfer of capital in these clusters. As for the "Manufacturing and power" and "Innovations and telecommunications" clusters, we can see from the figure that they are characterized by a volatile lateral trend in the ITC indicator. These clusters demonstrate relative stability of the process of inter-subject transfer of capital for the analyzed period.
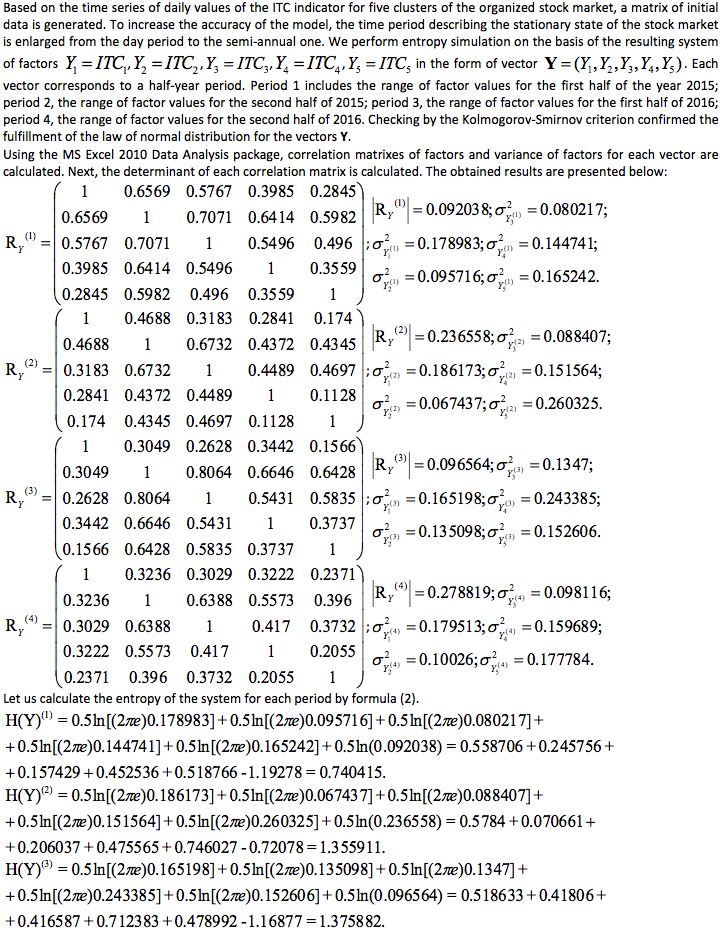
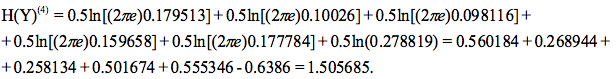
Table 2
The results of evaluation of entropy change in the
organized stock market of the Russian Federation
Periods |
1st half of 2015 |
2nd half of 2015 |
1st half of 2016 |
2nd half of 2016 |
H(Y)e |
1.933192 |
2.076691 |
2.544656 |
2.144282 |
H(Y)s |
-1.19278 |
-0.72078 |
-1.16877 |
-0.6386 |
H(Y) |
0.740415 |
1.355911 |
1.375882 |
1.505685 |
The results of calculations of the change in the system entropy parameter of the stock market of the Moscow Stock Exchange, which is the largest in the Russian Federation, with respect to the capital transfer process for semi-annual time intervals from 2015 to 2016, are presented in Table 2.
The conducted analysis of the organized stock market showed that the entropy component characterizing the system relationship between clusters in the second half of 2016 most closely approached 0 compared with the previous values (-0.6386 conventional units). This means weakening of the interconnectedness of the processes of transfer of capital in different clusters of the market. The maximum interconnection between clusters of the share market was observed in the first half of the year 2015 (the value of H(Y)s was -1.19278 conventional units). The local maximum of the entropy component, which characterizes the entropy of the randomness of the system, is observed in the first half of 2016 (2.544656 conventional units). Despite this fact, the system entropy parameter H(Y) reaches its largest value only in the second half of 2016 (1.505685 conventional units). An increase in the parameter of system entropy indicates that in some clusters the intensity of the process of capital redistribution remains at the same level, while in other clusters the intensity is weakening. The decrease in intensity may indicate the presence of endogenous and exogenous processes taking place in the system of the Russian stock market. The endogenous processes are associated with the flow of capital from equity securities to debt financial instruments (government and corporate bonds). The exogenous processes are manifested in the outflow of capital from the Russian stock market to foreign markets that are more attractive to investors.
In the present article, a particular problem of functional diagnostics of the state of the Russian stock market is solved. In solving the problem, a diagnostic entropy model is formulated, which allows detecting deviations and establish the extent to which the stock market fails to perform the function of redistribution of financial resources. The input data of the model are the values of the indicator characterizing the intensity of the process of inter-subject transfer of capital within the relevant cluster of the stock market. The output data of the model are the values of the system entropy indicator of the organized stock market of Russia. The analysis of the data obtained with the help of the model makes it possible to conclude that the role of the Russian stock market in the organization of the inter-subject transfer of capital in the second half of 2016 as compared to the first half of 2015 has decreased.
The study was carried out with the financial support of the grant of the Russian Humanitarian Science Foundation 15-02-00102 a. The theme is "Formation of the mechanism for managing the innovative development of the industrial region (based on the example of the Nizhny Novgorod region)".
Alvarez-Ramirez, J., Rodriguez, E., & Alvarez, J. (2012). A Multiscale Entropy Approach for Market Efficiency. International Review of Financial Analysis, 21, 64-69.
Bury, T. (2014). Collective Behaviours in the Stock Market. A Maximum Entropy Approach (Ph.D. Dissertation). Université libre de Bruxelles. (p. 146).
Eom, C., Oh, G., & Jung, W.S. (2008). Relationship between Efficiency and Predictability in Stock Price Change. Physica A: Statistical Mechanics and its Applications, 387(22), 5511-5517.
Kristoufek, L., & Vosvrda, M. (2014). Measuring Capital Market Efficiency: Long-Term Memory, Fractal Dimension and Approximate Entropy. The European Physical Journal B, 87(7), 1-9.
Li, J., Liang, C., Zhu, X., Sun, X., & Wu, D. (2013). Risk Contagion in Chinese Banking Industry: A Transfer Entropy-Based Analysis. Entropy, 15, 5549-5564.
Moscow Exchange. (n.d.). Indeks MMVB-innovatsii MICEXINNOV [Innovation Index MICEXINNOV]. Retrieved March 27, 2017, from http://moex.com/ru/index/MICEXINNOV/archive/#/from=2015-01-01&till=2016-12-31&sort=TRADEDATE&order=desc.
Moscow Exchange. (n.d.). Otraslevye indeksy Moskovskoi birzhi: Bankov i finansov [Sectoral Indices of Moscow Exchange: Financials]. Retrieved March 27, 2017, from http://www.moex.com/ru/index/MICEXFNL/archive/#/from=2015-01-01&till=2016-12-31&sort=TRADEDATE&order=desc.
Moscow Exchange. (n.d.). Otraslevye indeksy Moskovskoi birzhi: Elektroenergetiki [Sectoral Indices of Moscow Exchange: Electric Utilities]. Retrieved March 27, 2017, from http://www.moex.com/ru/index/MICEXPWR/archive/#/from=2015-01-01&till=2016-12-31&sort=TRADEDATE&order=desc.
Moscow Exchange. (n.d.). Otraslevye indeksy Moskovskoi birzhi: Khimicheskogo proizvodstva [Sectoral Indices of Moscow Exchange: Chemicals]. Retrieved March 27, 2017, from http://www.moex.com/ru/index/MICEXCHM/archive/#/from=2015-01-01&till=2016-12-31&sort=TRADEDATE&order=desc.
Moscow Exchange. (n.d.). Otraslevye indeksy Moskovskoi birzhi: Mashinostroeniya [Sectoral Indices of Moscow Exchange: Manufacturing]. Retrieved March 27, 2017, from http://www.moex.com/ru/index/MICEXMNF/archive/#/from=2015-01-01&till=2016-12-31&sort=TRADEDATE&order=desc.
Moscow Exchange. (n.d.). Otraslevye indeksy Moskovskoi birzhi: Metallov i dobychi [Sectoral Indices of Moscow Exchange: Metals & Mining]. Retrieved March 27, 2017, from http://www.moex.com/ru/index/MICEXM%26M/archive/#/from=2015-01-01&till=2016-12-31&sort=TRADEDATE&order=desc.
Moscow Exchange. (n.d.). Otraslevye indeksy Moskovskoi birzhi: Nefti i gaza [Sectoral Indices of Moscow Exchange: Oil & Gas]. Retrieved March 27, 2017, from http://www.moex.com/ru/index/MICEXO%26G/archive/#/from=2015-01-01&till=2016-12-31&sort=TRADEDATE&order=desc.
Moscow Exchange. (n.d.). Otraslevye indeksy Moskovskoi birzhi: Potrebitelskikh tovarov i torgovli [Sectoral Indices of Moscow Exchange: Consumer Goods and Services]. Retrieved March 27, 2017, from http://www.moex.com/ru/index/MICEXCGS/archive/#/from=2015-01-01&till=2016-12-31&sort=TRADEDATE&order=desc.
Moscow Exchange. (n.d.). Otraslevye indeksy Moskovskoi birzhi: Telekommunikatsii [Sectoral Indices of Moscow Exchange: Telecoms]. Retrieved March 27, 2017, from http://www.moex.com/ru/index/MICEXTLC/archive/#/from=2015-01-01&till=2016-12-31&sort=TRADEDATE&order=desc.
Moscow Exchange. (n.d.). Otraslevye indeksy Moskovskoi birzhi: Transport [Sectoral Indices of Moscow Exchange: Transport]. Retrieved March 27, 2017, from http://www.moex.com/ru/index/MICEXTRN/archive/#/from=2015-01-01&till=2016-12-31&sort=TRADEDATE&order=desc.
Ortiz-Cruz, A., Rodriguez, E., Ibarra-Valdez, C., & Alvarez-Ramirez, J. (2012). Efficiency of Crude Oil Markets: Evidences from Informational Entropy Analysis. Energy Policy, 41, 365-373.
Shannon, C. (1948). A Mathematical Theory of Communication. The Bell System Technical Journal, 27, 379-423, 623-656.
Sheraz, M., Dedu, S., & Preda, V. (2015). Entropy Measures for Assessing Volatile Markets. Procedia Economics and Finance, 22, 655-662.
Tyrsin, A. (2016). Entropiinoe modelirovanie mnogomernykh stokhasticheskikh sistem [Entropy Simulation of Multidimensional Stochastic Systems]. Voronezh: Nauchnaya Kniga. (p. 156).
Tyrsin, A., & Vorfolomeeva, O. (2011). Entropiinoe modelirovanie raboty avtotransportnogo predpriyatiya [Entropy Simulation of Functioning of the Motor Transportation Enterprise]. Vestnik YuRGTU (NPI). Sotsialno-ekonomicheskie nauki, 3, 145-150.
1. Lobachevsky State University of Nizhny Novgorod, Russia
2. Lobachevsky State University of Nizhny Novgorod, Russia
3. Lobachevsky State University of Nizhny Novgorod, Russia
4. Lobachevsky State University of Nizhny Novgorod, Russia; E-mail: frolov.unn@gmail.com
5. Lobachevsky State University of Nizhny Novgorod, Russia