![]() ISSN 0798 1015
ISSN 0798 1015

![]() ISSN 0798 1015
ISSN 0798 1015
Vol. 38 (Nº 47) Year 2017. Page 41
Juliya Sergeevna TSERTSEIL 1 Viktoriya Vladimirovna KOOKUEVA 2
Received: 03/10/2017 • Approved: 06/10/2017
ABSTRACT: This paper analyzes the development prospects of the property market and discusses its current state in Russia. The study identifies the main problems and factors affecting the development of the Russian housing market. It is shown that the key problems of the Russian housing market are the low effective demand and income level of the population, a high level of interest rates, the low consumer satisfaction with respect to the volume of housing construction in certain regions, particularly in rural areas, the lack of borrowed and attracted financial resources and other factors. The paper gives a review of the main development trends of the property market in Russia and presents a comparative analysis of its development trends in other countries. |
RESUMEN: En este trabajo se analizan las perspectivas de desarrollo del mercado inmobiliario y se discute su estado actual en Rusia. El estudio identifica los principales problemas y factores que afectan el desarrollo del mercado inmobiliario ruso. Se demuestra que los problemas clave del mercado inmobiliario ruso son la baja demanda efectiva y el nivel de ingresos de la población, un alto nivel de tasas de interés, la baja satisfacción del consumidor con respecto al volumen de construcción de viviendas en ciertas regiones, particularmente en las zonas rurales, la falta de recursos financieros prestados y atraídos y otros factores. El documento da una revisión de las principales tendencias de desarrollo del mercado inmobiliario en Rusia y presenta un análisis comparativo de sus tendencias de desarrollo en otros países. |

The property market plays an important role for any state and its population. An important task for the state is not only the development of the property market in the whole country, but also the promotion of housing affordability for citizens through various tools for housing market financing. In recent years, the property market has experienced various conditions, including a sharp jump before the crisis and a fall after the crisis. All this confirms the need for state support to develop the property market, which will contribute to the solution of many social problems and the development of the economy as a whole. On the one hand, the property market is sensitive to the changes in interest rates.
The key problems of the housing market include the insufficient effective demand and the low per capita income of the population in need of housing, high loan interest rates, uncoordinated relations between executive authorities and developers, insufficient volumes of housing construction in certain regions, particularly in rural areas, a deficit in borrowed and attracted financial resources and other factors.
The purpose of this study is to review the main trends in the development of the property market in Russia, make a comparison with its development trends in other countries, as well as identify the main problems and influencing factors in this area.
With regard to the theoretical foundations of the essence of the housing market and its development models, a large number of studies are devoted to determining the role of mortgage housing lending in the development of the property market as well as the models and forms of housing financing. A significant contribution to the development of theoretical and methodological issues in the analysis of the residential property market and the main directions of its development was made by A.N. Asaul, V.V. Buzyrev, A.I. Vakhmistrov, S.A. Ershova, V.A. Zarenkov, L.M. Kaplan, A.N. Larionov, Yu.P. Panibratov, N.I. Pasyada, A.S. Robotov, E.B. Smirnov, R.A. Faltinsky, L.I. Tsapu, V.A. Yakovlev and a number of other researchers. Certain aspects of the mortgage lending process were considered in the works of such scholars as T.A. Akulova, L.Yu. Andreeva, A.V. Krysin, A.A. Lupar, E.S. Maltseva, I.V. Pavlova, E.A. Rusetskaya, L.I. Ryabchenko, V.A. Savinova, E.N. Sokolovskaya, E.S. Tkacheva, A.D. Yushkantsev, Yu.S. Berestova, Т.V. Volodina, G.A. Grabsky, E.A. Zakharov, M.P. Loginov, O.N. Loginova, I.V. Dovdienko, L.Yu. Grudtsyna, S.V. Pechatnikova, I.V. Zhigunov, A.S. Kudeev, V.V. Klevtsov, Yu.A. Timagina, A.V. Falkovsky, A.I. Shakiryanova.
Modern problems of mortgage housing lending were analyzed by such foreign researchers as M. Halter, E. Davidson, E. Sanders, L. Wolf, S. Dobson, J. Dolan, R.J. Strike, R. Dornbusch, S. Fisher, K. Campbell, D. Lindsay, S. Polfreman and others.
A form (model) of housing financing is understood as the totality of organizational, functional, legal and financial-economic mechanisms operating in a single system according to a certain pattern of relationships between subjects of the housing market.
The following forms of housing financing are distinguished by economists:
Studying the experience of housing construction financing with the help of lending allows all forms to be structured into models, according to the used refinancing mechanism within them and financing sources:
- shared construction and housing installment sale;
- provision of loans and credits for housing acquisition for employees by enterprises;
- housing certificates;
- municipal housing bonds;
- regional schemes (programs) using resources of regional and local budgets;
- bank crediting;
- savings scheme and experience of consumer unions;
- a classical two-level model (developed in Moscow and St. Petersburg).
Each case has its problems, advantages and disadvantages. In terms of equity participation, the problems are the risks of non-completion of construction, the existence of high effective demand, the need to attract credit resources, the inaccessibility for the population with low incomes, and the low level of insurance protection.
Regional programs using budgetary funds are implemented only in the regions whose budget has sufficient financial resources. The advantage is the availability of state guarantees for low-income families, their reliability, and the disadvantage is the limitation in terms of financing.
The housing financing mechanism has not been widespread in Russia.
Consumer lending is possible in profitable and financially sustainable companies that have sufficient resources for this activity and are ready to provide their employees with such opportunities. This option is not of a mass nature.
Banking mortgage should be one of the most important and massive ways to develop the residential property market. However, in Russia, despite some decline, interest rates are rather high, which does not allow the development of this type of lending. The constraints to the development of this model are lending conditions that are inaccessible to the majority of the population – the amount of down payment and monthly payments on the loan, depending on the monthly income.
The loan and savings model is not widely spread due to the lack of confidence in savings and loan funds, high inflation, the lack of state support and state guarantees.
A classical two-level model can only develop in large cities, where the incomes of the population are relatively high.
Despite the fact that currently the mortgage lending system occupies an insignificant share in the total volume of housing construction financing, with regard to foreign experience, it is the most progressive one. The insufficiency of its wide application in Russia is caused by a number of reasons: the insignificant growth of housing construction, rather tough conditions of mortgage lending, and the instability of the socioeconomic situation in the country.
Let us consider some models of property market development in foreign countries.
Reed and Wu (2010) consider the model of property market development in terms of the principle of cyclicity and risk factor, based on the work of Barras (1994), which is shown in Table 1.
Table 1. How the building cycle works
Real economy |
Property economy |
Money economy |
Economic up-turn |
|
Credit expansion |
|
Increased property demand |
|
Supply shortage |
||
Rising rents/falling yields |
||
Economic boom |
Building boom |
Credit boom |
Economic down-turn |
Increased supply + slackening demand |
Rising interest rate |
Falling rents/rising yields |
||
Recession |
Property slump |
Credit squeeze |
Source: https://dro.deakin.edu.au/eserv/DU:30024131/reed-understandingproperty-post-2010.pdf
Hornstein (2009) examines the impact of innovative methods of financing the mortgage property market, the development of which directly and indirectly affects the growth of the country's gross domestic product (GDP). In this case, it is emphasized that increasing the incomes of the population requires not expanding the range of innovative financial services, but increasing the return on investment in real estate in the future.
The features of a real estate investment financial analysis were reviewed by Poorvu (2003). He outlines the following assumptions that complicate the process of conducting a financial analysis with respect to a real estate investment: the extremely long time horizon involved, the effects of an ever-changing environment, and liquidity problems. In this connection, the following components of an analysis are distinguished:
- cash flow,
- tax effect,
- future benefits.
Lin (2012) built the dependence of the main participants of the property market on the key parameters, as reflected in Table 2 and Table 3.
Table 2. Variables and ratios for property market analysis
Market |
Housing |
Industrial |
Office |
Retail |
Variable and ratio |
|
|
|
|
Variable |
|
|
|
|
Money supply |
+ |
+ |
+ |
+ |
Interest rate |
+ |
+ |
+ |
+ |
GDP |
+ |
+ |
+ |
+ |
Housing starts (for residential) |
+ |
|
|
|
Number of days on market |
+ |
|
|
|
Number of unsold homes in a city |
+ |
|
|
|
Number of homes on market over 120 days |
+ |
|
|
|
Number of mortgage applications |
+ |
|
|
|
Population growth |
+ |
|
|
|
Household formations |
+ |
|
|
|
Cost of renting housing |
+ |
|
|
|
Industrial production |
|
+ |
|
|
Manufacturing employment |
|
+ |
|
|
Transportation employment |
|
+ |
|
|
Airfreight volume |
|
+ |
|
|
Rail and truck volume |
|
+ |
|
|
Retail sales |
|
+ |
|
+ |
New office construction (for office) |
|
|
+ |
|
White collar employment |
|
|
+ |
|
Inflation expectation |
|
|
|
+ |
Car registrations |
|
|
|
+ |
Retail sector expenditure |
|
|
|
+ |
Aggregate household wealth |
|
|
|
+ |
Ratio |
|
|
|
|
Affordability (household income to price) |
+ |
|
|
|
House price to employee compensation |
+ |
|
|
|
Asking price to transaction price |
+ |
|
|
|
% of properties bought for investment |
+ |
|
|
|
Industrial capacity utilization |
|
+ |
|
|
Vacancy rates |
|
+ |
+ |
+ |
Cap rates to interest rates |
|
+ |
+ |
+ |
Rental cost to mortgage costs |
|
+ |
+ |
+ |
Source: https://eres.architexturez.net/system/files/pdf/eres2012_355.content.pdf
-----
Table 3. A comparative framework for commercial and residential markets by property market data and information
|
Property market information |
|||||
Location/level data |
User-occupier |
Development – land market |
||||
International level |
User cost ratio |
New order |
New output |
New building sold/new building built |
||
National level |
Rent |
Interest/deposit |
Service charge |
Developer as an occupier (number, space m^2, value) |
||
Regional level |
Maintenance cost |
Tax (council tax) |
Price elasticity of supply |
|||
Sub-regional level |
Owner-investor |
Development cost structure analysis |
||||
Corporate level |
Owner – investor market ratio |
Property price |
Construction cost |
|||
|
Price |
Rent /cost |
Stock volume and value |
Land price |
Developers profit |
|
Physical characteristics data |
Affordability (income price ratio) |
Land price vs. Developer's total cost, construction cost, sold price, developer' profit |
||||
Age |
Bubble (rent-price ratio, income yield) |
Developer analysis |
||||
Structure |
Transaction |
|||||
Style |
Total volume |
Total value |
Company background |
Performance |
||
Type of use |
Exist stock |
% of existing stock |
Capital, output |
Short term debt / equity |
||
Layout |
New output |
% of new output |
Company age |
Long term debt / equity |
||
Size |
Total stock |
% of total stock |
Employee |
Long term debt / fix asset |
||
Height (floor)/density |
Vacancy rate (by region and sectors) |
Revenue, profit |
Operation cost / equity |
|||
Environment |
SUPPORTING |
|||||
|
Financial market |
|||||
|
Interest rate |
Exchange rate |
Return-risk |
Credit affordability |
Debt structure – credit control |
|
Source: https://eres.architexturez.net/system/files/pdf/eres2012_355.content.pdf
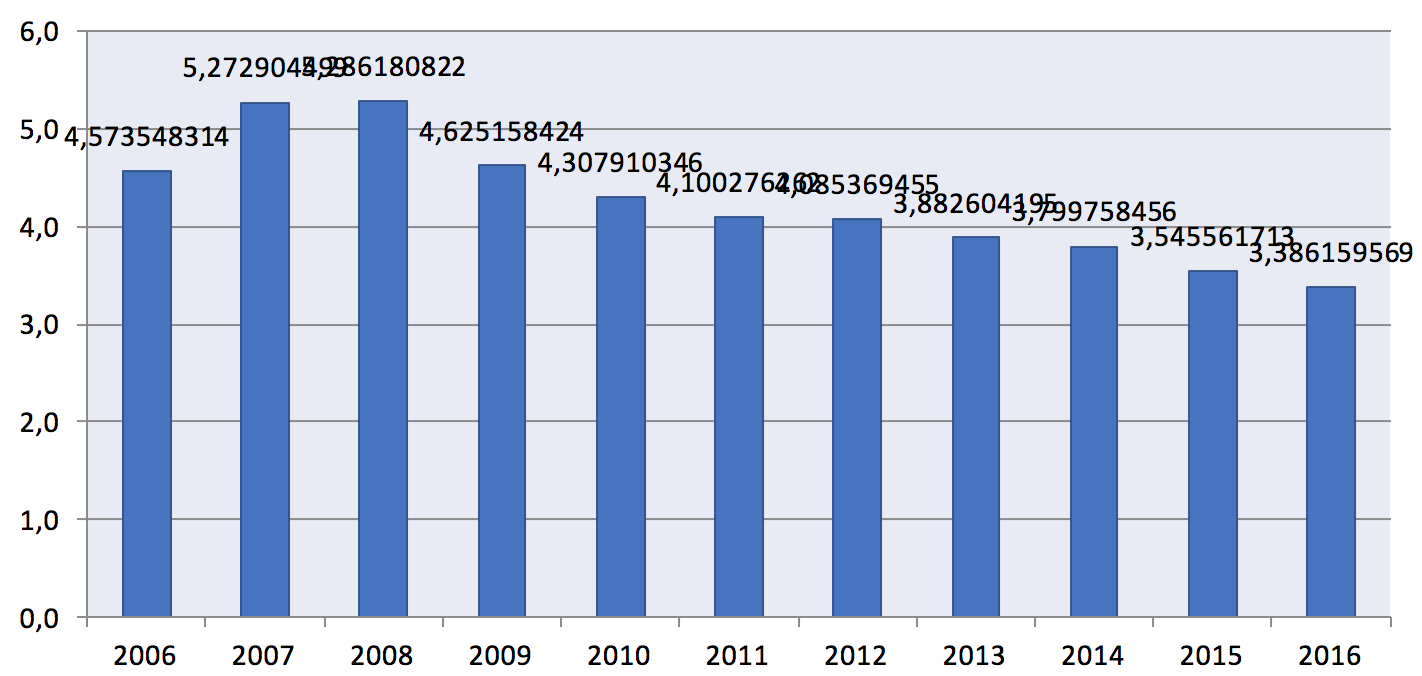
Consider the main housing affordability indices in Russia. The housing price to income ratio is calculated as the ratio of the average price of an apartment of 54 square meters in area to the average income of a family consisting of three persons per year. The value of this index corresponds to the number of years during which a family can save for an apartment, assuming that the entire money income received will be deferred to purchase an apartment. In Figure 1 and Figure 2 we observe a downward trend in this index, which indicates a certain increase in housing affordability. It is also positive that the proportion of families with mortgage payments is growing. However, it should be noted that despite the growth, this level yet cannot be called high.
Figure 1. The housing price to income ratio in Russia (the ratio of
prices and revenues, years) (compiled by the authors)
-----
Figure 2. Share of families that afford house mortgage in Russia, % (compiled by the authors)
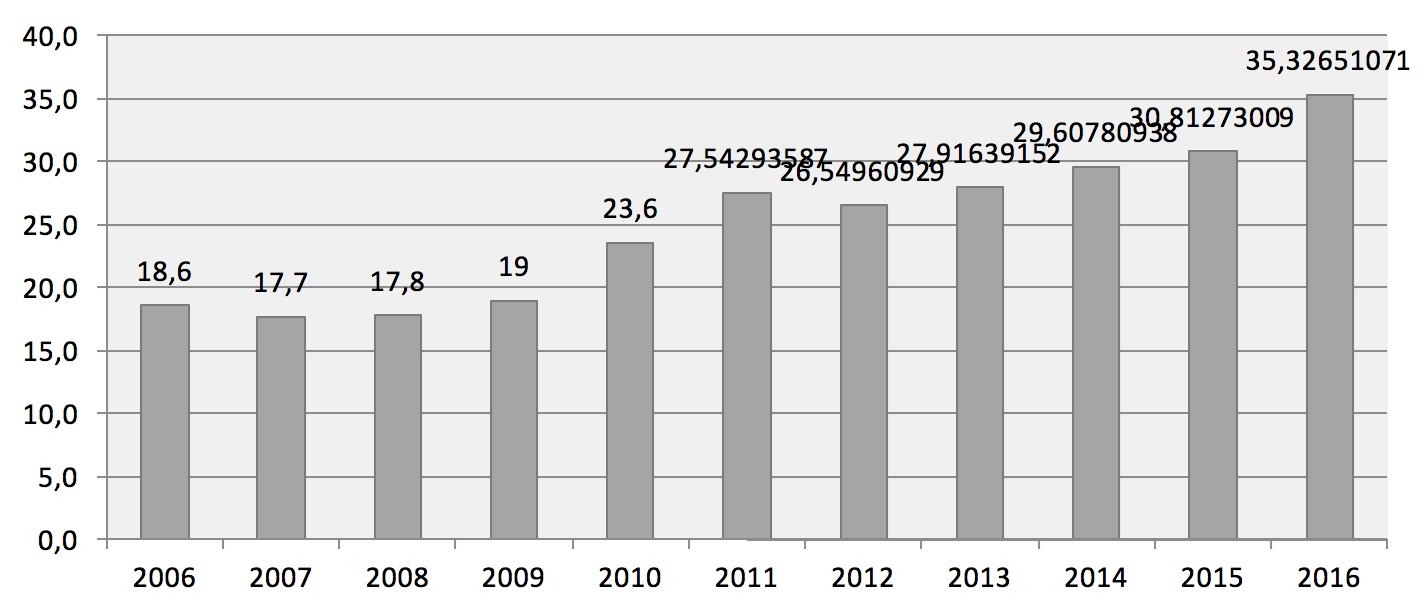
Table 4 presents the main indices that characterize the Russian property market. The dynamics of many indices is unstable. For example, after the crisis of 2014, the number of mortgage loans issued as well as property rights of individuals for residential premises decreased. A sharp increase in the rate of mortgage loans in 2015 had an adverse impact on the development of the residential property market in Russia.
Table 4. Main indices characterizing the Russian
property market for the period of 2012-2016
Indices |
2012 |
2013 |
2014 |
2015 |
2016 |
Average per capita money income of the population (per month), thousand rubles |
23,2 |
25,9 |
27,8 |
30,5 |
30,7 |
Share of costs for property acquisition in the population’s money expenditures, % |
4,2 |
3,9 |
4,5 |
2,9 |
н/д |
Housing fund, million m2 of the total area of residential premises |
3349 |
3359 |
3473 |
3581 |
3663 |
Commissioning, million m2 of the total area of residential premises |
65,7 |
70,5 |
84,2 |
85,3 |
80,2 |
Average size of apartments built, m2 of total area |
78,4 |
75,8 |
74,9 |
71,4 |
68,7 |
Share of the volume of housing mortgage loans provided in GDP, % |
1,54 |
1,91 |
2,23 |
1,4 |
1,71 |
Registered property rights of individuals for residential premises, units |
8 729 967 |
9 768 589 |
9 696 212 |
9 069 938 |
8 374 828 |
Registered mortgages of residential premises, units |
1 159 208 |
1 245 833 |
1 425 016 |
1 134 333 |
1 290 682 |
Number of housing mortgage loans provided, units |
691 724 |
825 039 |
1 012 814 |
699 510 |
856 461 |
Average weighted rate, % |
12,29% |
12,56% |
12,37% |
13,44% |
12,62% |
Average price in the residential property market for 1 m2 of total area, thousand rubles (primary market) |
48,2 |
50,2 |
51,7 |
51,5 |
53,3 |
Source: Author’s own computations.
The search for dependencies between the average mortgage rate and other indices makes it possible to conclude that the correlation between the mortgage rate and the share of costs for property acquisition is the strongest. It is interesting that the correlation between the size of mortgage rates and the number of loans issued is weak, and the correlation between the rate and GDP, the total amount of housing stock is average (see Table 5).
Table 5. Correlation coefficients between the average
weighted mortgage rate and other indices in Russia
Indices |
Average weighted mortgage rate |
Correlation |
Number of housing mortgage loans provided, units |
-0,4322 |
Reverse weak |
Share of the volume of housing mortgage loans provided in GDP, % |
-0,5841 |
Reverse average |
Share of costs for property acquisition in the population’s money expenditures, % |
-0,9657 |
Reverse strong |
Average per capita money income of the population (per month), thousand rubles |
0,6661 |
Direct average |
Housing fund, million m2 of the total area of residential premises |
0,5327 |
Direct average |
GDP, billion rubles |
0,5516 |
Direct average |
Source: Author’s own computations.
The search for dependencies between the volume of housing fund and other indices makes it possible to conclude that the strongest correlation is between the average per capita money income of the population, the volume of GDP and the average price. It is interesting that the number of mortgage loans provided has a small impact on the volume of housing stock, and there is a correlation with the interest rate for a loan, but it is average (see Table 6).
Table 6. Correlation coefficients between the volume
of housing fund and other indices in Russia
Indices |
Housing fund, million m2 of the total area of residential premises |
Correlation |
Average weighted mortgage rate |
0,5327 |
Direct average |
Average price in the residential property market for 1 m2 of total area, thousand rubles (primary market) |
0,8896 |
Direct strong |
Registered mortgages of residential premises, units |
0,1083 |
Direct weak |
Number of housing mortgage loans provided, units |
0,1301 |
Direct weak |
Share of costs for property acquisition in the population’s money expenditures, % |
-0,6520 |
Reverse average
|
Average per capita money income of the population (per month), thousand rubles |
0,9408 |
Direct strong |
GDP, billion rubles |
0,9679 |
Direct strong |
Source: Author’s own computations.
As a result of the study it was revealed that the size of average per capita income is connected to the volume of housing stock, and this relationship is described by the model:
y = 40,697x + 2361
R² = 0,8852
where x is the size of average per capita incomes of the population,
y is housing stock, million m2 of the total area of residential premises.
Figure 3. Correlation between the size of average per capita
income and the volume of housing stock in Russia.
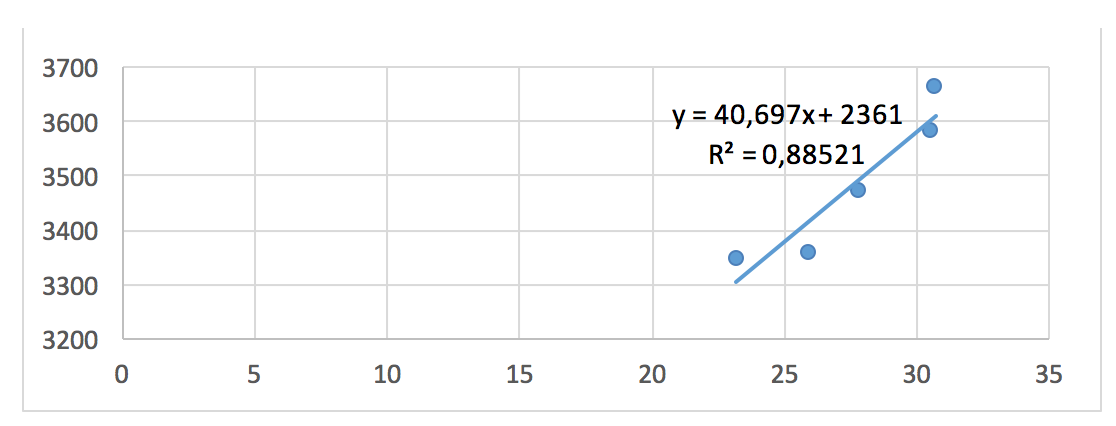
Source: Author’s own computations.
It was revealed that the average weighted mortgage rate is connected to the share of costs for property acquisition, and this relationship is described by the model:
y = -126,83x + 19,938
R² = 0,9327
Figure 4. Correlation between the average weighted mortgage rate
and the share of costs for property acquisition in Russia.
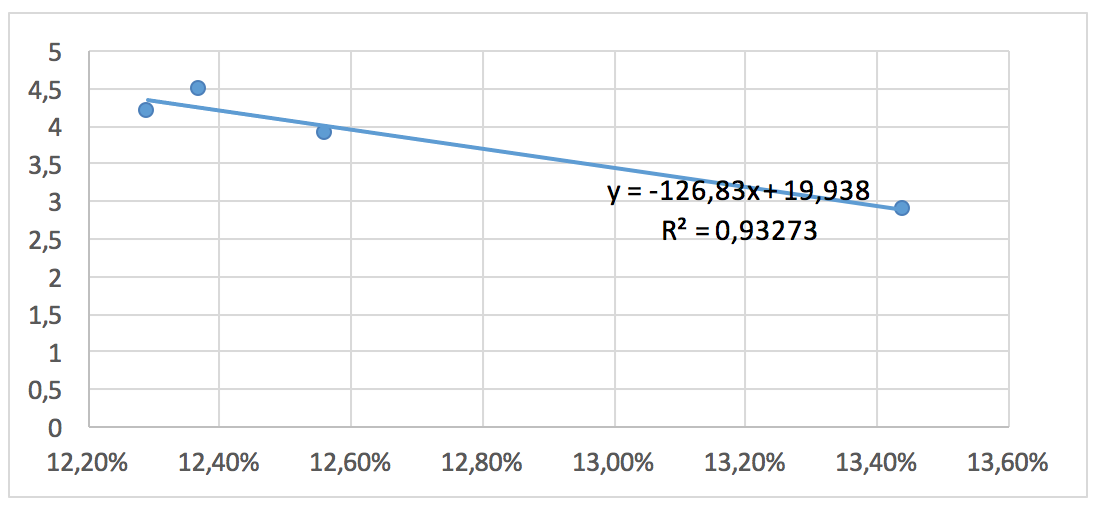
Source: Author’s own computations.
The study showed that there was a correlation between the average monthly accrued wages and the amount of early repaid mortgage loans, as can be seen in Figure 5.
Figure 5. Correlation between the index of the average monthly nominal
accrued wages within a full range of organizations by entities of the Russian
Federation, rubles (х) and the resulting index of the volume of early repaid
mortgage housing loans by borrowers in 30 largest banks (regional section)
(y) as of January 1, 2017, million rubles.
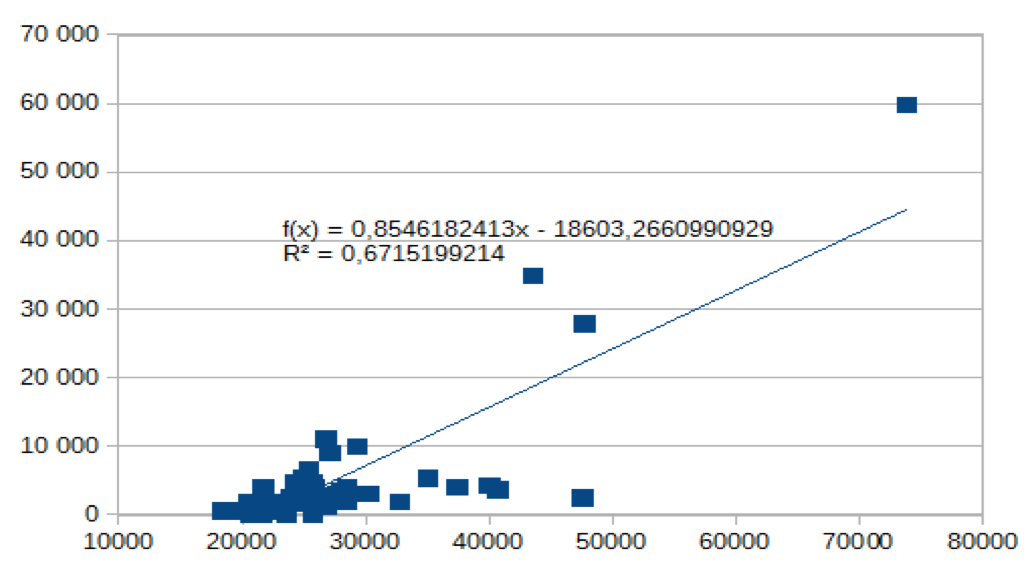
Source: Author’s own computations.
The presented dependence is based on the official data of the Federal State Statistics Service for such federal districts as the Central Federal District (excluding the Belgorod and Bryansk regions), the Northwestern Federal District (excluding the Nenets Autonomous District), the Southern Federal District, and the Volga Federal District. As can be seen, the growth of wages stimulates the receipt of payments for the satisfaction of mortgage. It is of great importance in this case to stimulate people's intentions to save and implement capital investments under constantly changing economic conditions in the long term.
Property market development problems and trends as an object of investment from both commercial and private structures are considered by various analytical agencies in foreign countries, which explore the experience of this market development in large cities such as London (UK) (Report, 2016). The value of commercial property in the UK in 2015 reached a record level, with most of it –41% – being retail property, offices accounted for 31%, industrial property – 19%, as can be seen from Table 7 and Table 8.
Table 7. Owner-occupied and invested
commercial property in London, 2015
Indicators |
Pounds, BN |
% of total |
1. Retail |
360 |
41 |
Shopping centers |
66 |
8 |
Retail warehouses |
52 |
6 |
Other retail (including supermarkets) |
243 |
28 |
2. Offices |
270 |
31 |
London |
173 |
20 |
South Eastern |
32 |
4 |
Rest of UK |
65 |
7 |
3. Industrial |
169 |
19 |
London and South Eastern |
67 |
8 |
Rest UK |
102 |
12 |
4. Other commercial |
73 |
8 |
Hotels |
31 |
4 |
Leisure |
17 |
2 |
Miscellaneous other commercial |
24 |
3 |
5. Total commercial property |
871 |
100 |
of which London |
330 |
38 |
of which rest of UK |
541 |
62 |
Source: http://www.bpf.org.uk/sites/default/files/resources/PIA-Property-Report-2016-final-for-web.pdf
Analysis of the commercial property market by investor type shows that the majority are overseas investors – 28%, UK institutions – 17%, collective investors – 16%.
Table 8. Ownership of UK commercial
property by investor type
|
Pounds, BN 2015 |
% change 2005-2015 |
% of total |
Overseas investors |
135 |
125 |
28 |
UK institutions (insurance companies and pension funds) |
84 |
- 10 |
17 |
UK collective investment schemes |
79 |
64 |
16 |
UK REITS & listed prop companies |
71 |
37 |
15 |
UK unlisted prop companies |
59 |
-13 |
12 |
UK traditional estates/ charities |
23 |
40 |
5 |
UK other |
20 |
-8 |
4 |
UK private investors |
13 |
19 |
3 |
Total value of buildings in investment portfolios |
483 |
31 |
100 |
Source: http://www.bpf.org.uk/sites/default/files/resources/PIA-Property-Report-2016-final-for-web.pdf)
The total cost of investment of insurance companies and pension funds in commercial property in 2015 was £178 billion (about 6%). Almost 3% of their total investments are direct investments in state institutions.
Table 9. Insurance company and pension fund investment
in commercial property in UK as & of total investments
|
2015 pounds BN |
% of total |
Total assets (equity, bonds, property, etc.) |
3064 |
100 |
Directly – owned UK property |
84 |
2.8 |
Investments in UK collective investment schemes (net asset value) |
57 |
1.9 |
UK & overseas property company shares (market capitalization) |
37 |
1.2 |
Total property |
178 |
5.8 |
Lending against commercial investment property |
26 |
0.8 |
Source: http://www.bpf.org.uk/sites/default/files/resources/PIA-Property-Report-2016-final-for-web.pdf
Housing is one of the key priorities of the UK government. For many people, the affordability and accessibility of housing has become increasingly difficult in recent years. As part of its housing policy, the government has two goals: to stimulate housing for the next five years and to increase the proportion of its own housing (Boyd, 2014).
The total amount of public housing costs in England was about £28 billion in 2015-16. “The Home Building Fund is worth £3 billion up to 2020-21 and provides a mix of short- and long-term development and infrastructure loans. Of this funding £1 billion will be targeted at small and custom builders, through which the government aims to complete 25,500 new homes by 2020. The remaining £2 billion is designed to provide long-term funding for infrastructure” (https://www.nao.org.uk/wp-content/uploads/2017/01/Housing-in-England-overview.pdf).
The volume of property transactions remains high in 2017 in Finland. However, in the first quarter of 2017, the average transaction amount was relatively low, leaving the total volume clearly lower than in 2016. Strong investment demand has reduced the volume of profitability, which has reached record low levels.
In recent years, the most active groups of investors in the market are companies and funds as well as overseas investors. All these groups have increased their portfolios, both funds and overseas players. As the total size of the market continued to grow, the share of institutional investors in the overall market continued to decline.
Table 10. The structure of Finish property investment market by investor
group. Direct property investments in Finland 2011-2015, EUR billion
|
2011 |
2012 |
2013 |
2014 |
2015 |
Institutional investors |
15.4 |
16.2 |
16.2 |
16.0 |
15.6 |
International investors |
9.0 |
9.0 |
9.3 |
9.8 |
11.9 |
Listed property companies |
5.2 |
5.4 |
5.6 |
5.6 |
5.8 |
Non-listed property companies |
6.5 |
7.6 |
8.4 |
9.9 |
11.1 |
Real estate funds |
5.7 |
6.3 |
7.1 |
7.5 |
9.1 |
Charities, endowments and other |
1 |
1 |
1 |
1 |
1 |
Source: https://kti.fi/wp-content/uploads/The-Finnish-Property-Market-2016.pdf
As can be seen from Table 11, the share of direct domestic investments in real estate is 72.1%, indirect domestic investments – 13.5%, and the share of all foreign investments – 14.4%.
Table 11. Real estate exposure of Finish institutions in 2015, %
|
Direct domestic investments |
Indirect domestic investments |
Direct foreign investments |
Indirect foreign investments |
2015 |
72.1 |
13.5 |
2.1 |
12.3 |
Source: https://kti.fi/wp-content/uploads/The-Finnish-Property-Market-2016.pdf
The total investment of these groups of investors in the Finish property market amounted to €21.6 billion in 2015.
The structure of the Finish property market in 2016 is reflected in Table 6, where it can be seen that most of it is occupied by office property is 29.2%, residential property – 28.6%, and retail property – 25.9%.
Table 12. The structure of Finish property investment market by sector in 2015, %
(the total size of EUR 54.5 billion)
|
Office |
Retail |
Industrial |
Residential |
Hotel |
Other |
2015 |
29.2 |
25.9 |
8.1 |
28.6 |
4.6 |
3.7 |
Source: https://kti.fi/wp-content/uploads/The-Finnish-Property-Market-2016.pdf
Analysis of the ownership structure of rent in Finland in 2015 showed that most of them are private investors – 36% and municipalities – 29%.
Table 13. Ownership structure of rental apartments in
Finland (total 824,000 rental apartments), 2015
2015 |
Professional investors (non-subsidized) |
Households/private investors (non-subsidized) |
Subsidized/municipalities |
Subsidized/other owner |
% |
17 |
36 |
29 |
19 |
quality |
139,000 |
295,000 |
237,000 |
153,000 |
Source: https://kti.fi/wp-content/uploads/The-Finnish-Property-Market-2016.pdf
In accordance with the Strategy for the Development of Housing Mortgage Lending in the Russian Federation until 2020, the main areas are:
• development of the primary mortgage lending market;
• implementation of special mortgage programs for socially priority categories of citizens;
• provision of long-term resources for financing of the mortgage lending market;
• unification and standardization of the mortgage lending market, development of the market infrastructure;
• development of mechanisms for crediting commercial developers for housing construction, crediting of individual housing construction and housing non-profit associations of citizens, financing of the construction (acquisition) of engineering infrastructure facilities, crediting for construction or acquisition of rented houses.
Currently, the number of credit organizations in Russia is 623, of which 506 provide mortgage loans. At the same time, most of these organizations (more than 50%) are located in the Central Federal District.
Table 14. The number of credit organizations – participants in the housing
(mortgage) lending market (regional section) in the Russian
Federation as of January 1, 2017
|
Total |
Number of credit organizations providing housing loans |
Providing mortgage housing loans |
Providing mortgage housing loans, issued on security of the rights of claims under agreements for participation in equity construction |
Acquiring rights for mortgage housing loans |
Implementing on-lending of previously issued mortgage housing loans |
Attracting refinancing in the secondary mortgage market |
Russian Federation
|
623 |
506 |
484 |
210 |
128 |
41 |
93 |
Central Federal District |
358 |
268 |
1 |
107 |
69 |
34 |
52 |
Northwestern Federal District |
49 |
42 |
41 |
18 |
11 |
1 |
6 |
Southern Federal District |
38 |
37 |
36 |
12 |
5 |
2 |
2 |
North Caucasian Federal District |
17 |
8 |
4 |
2 |
0 |
0 |
0 |
Volga Federal District |
77 |
75 |
75 |
39 |
24 |
2 |
22 |
Ural Federal District |
29 |
29 |
28 |
14 |
8 |
1 |
1 |
Siberian Federal District |
37 |
31 |
31 |
13 |
7 |
1 |
7 |
Far Eastern Federal District |
18 |
16 |
15 |
5 |
4 |
0 |
3 |
Source: https://www.cbr.ru/statistics/UDStat.aspx?Month=01&Year=2017&TblID=3-2
-----
Figure 6. The number of operating credit organizations in the Russian
Federation in terms of federal districts in 2017 (the total number of 623 units)
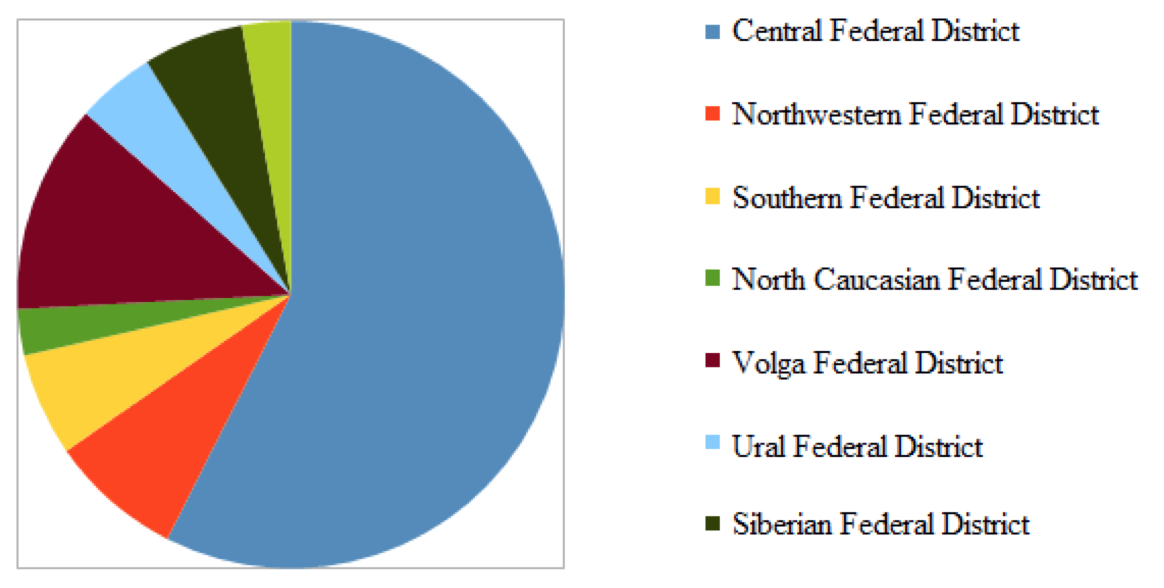
Source: https://www.cbr.ru/statistics/UDStat.aspx?Month=01&Year=2017&TblID=3-2
The property market plays an important role in the development of the country's economy and affects the volume of GDP, which causes the need to stimulate its development. The development of the residential property market is of special social significance for the country’s population as well as the level and quality of living standards. The development of the residential property market requires the expansion of the possibilities of housing financing with the support of state, development institutions and organizations. The most important influencing factors also include the size of the average weighted mortgage rate and the per capita income of the population. In turn, these factors depend on other social and economic indicators, the state of the monetary market, the financial system, the country's budget system, economic growth and political situation in the country and at the international level. To further stimulate the development of the property market, it is necessary to gradually reduce mortgage rates, expand subsidies, as well as elaborate various tools for the development of housing construction and social mortgage.
The writing of this paper was supported by Plekhanov Russian University of Economics.
Boyd, T. (2014). Property market analysis. The key to looking forward. PRRES. Retrieved from: http://www.prres.net/papers/Boyd_Property_Market_Analysis.pdf
Finnish property market report (2016). The Finnish property market. Published by KTI Finland. Retrieved from: https://kti.fi/wp-content/uploads/The-Finnish-Property-Market-2016.pdf
Hornstein, A. (2009). Problems for a fundamental theory on house price. Economic Quarterly, 95(1), 1-24.
Lin, R. F.-Y. (2012). A comparative framework for commercial and residential markets. Bartlett School of Graduate Studies, University College London (UCL).
Official statistics (2017). Labor market, employment and wages. Efficiency of the Russian economy. Retrieved from: http://www.gks.ru/wps/wcm/connect/rosstat_main/rosstat/ru/statistics/wages/
Poorvu, W.J. (2003). Financial analysis of real property investments. Harvard Business School.
Reed, R. & Wu, H. (2010). Understanding property cycles in a residential market. Property management, 28(1), 33-46.
Report of UK (2016). Property Data Report 2016. Facts and figures about the UK commercial property industry to year-end 2015. A publication by the Property Industry Alliance. Retrieved from: http://www.bpf.org.uk/sites/default/files/resources/PIA-Property-Report-2016-final-for-web.pdf
1. Candidate of Economical Sciences, Associate Professor, Department of Financial Management, Plekhanov Russian University of Economics, Moscow, Russian Federation. Email: sensusveris11@gmail.com
2. Associate Professor, Department of Financial Management, Plekhanov Russian University of Economics, Moscow, Russian Federation