![]() ISSN 0798 1015
ISSN 0798 1015

![]() ISSN 0798 1015
ISSN 0798 1015
Vol. 38 (Nº 47) Year 2017. Page 33
Mayis GULALIYEV 1; Suriya ABASOVA 2; Shahla HUSEYNOVA 3; Reyhan AZIZOVA 4; Tabriz YADIGAROV 5;
Received: 03/10/2017 • Approved: 06/10/2017
3. Data, Analysis, and Results
ABSTRACT: With development of globalization and integration of national economies the question on the state intervention in economy became more sharply. In modern economic and political conditions all governments in the world has intervention in economy but in different levels. Thus, almost nobody challenges the fact about necessity intervention in economy. Thus, assesment of relationship between some macroeconomic indicators and intervention levels in economy has great scientific and practical value. |
RESUMEN: Con el desarrollo de la globalización y la integración de las economías nacionales, la pregunta sobre la intervención estatal en la economía se hizo más aguda. En las modernas condiciones económicas y políticas, todos los gobiernos del mundo tienen intervención en la economía, pero en diferentes niveles. Así, casi nadie cuestiona el hecho de la intervención de necesidad en la economía. Así, la evaluación de la relación entre algunos indicadores macroeconómicos y los niveles de intervención en la economía tiene un gran valor científico y práctico. |

The development of science and technology causes an increase in the consumer demand. As the demand volume increases, goods and services exchange between two countries expands. Not a state has the opportunity to meet the demand of its nation in full, that’s why it has to exchange goods and services with other states. However, each country should have necessary amount of currency in order to acquire necessary goods and services. Export is, therefore, necessary to realize import. Nonetheless, each country imports necessary amount of goods and services only in two cases. Firstly, these goods and services aren’t produced in the country. Secondly, the production of goods and services of the same quality in the given country is more expensive. It means that trade between two countries is not obligatory, it is of voluntary and mutually beneficial nature.
However, it is all good only at first sight. It actually happens that seemingly mutually beneficial international trade brings a number of problems. Firstly, continuous imports of goods, which aren’t produced in a country, prevent development of personnel, skills and expertise necessary for manufacture of these products in years to come. Secondly, imports of the goods, which are produced in a country, provoke additional competition for local goods and generally displace them from the market. This is detrimental to local manufacturers’ incomes and causes further social problems. Generally, the quality of an imported product is much different from the quality of a local product, and competitive environment on the market, therefore, changes subject to new criteria.
Considering the importance of foreign economic activity of each country, it should be noted that its limitation to some extent is necessary. For example, the import has to have such limits in order to 1) protect country’s local manufacturers against economic damage; 2) prevent the import of poor or low-quality products.
Export business is a specific activity, which is maintained by all countries. Nonetheless, this activity should have limits too. In other words, export business should fall within the limits to prevent profound effects on domestic prices. On the other hand, the uncontrolled freedom of goods export may eventually depress demand for local products within a country and lead to a disbalance between demand and supply. Thus, export business brings additional currency to a country and its main task is to provide currency supply for import. Export, therefore, should be on such a level to not stimulate import in the future.
Over the time as international economic relations, and, particularly, states’ foreign trade, evolve, the issue of its control and regulation has been a major focus of interest. As a result, two opposite points of view regarding foreign trade activities was formed. The first (protectionism) involves protection of domestic market against adverse external influence of different economic and political factors and protection of local businesses on the domestic market; the second (free trade), on the contrary, provides for removal of any constraints in international trade (in a broad sense of this word – economic relations between states).
There’s no such country in the world that carries out foreign trade activity and doesn’t try to expand it. At the same time, there’s no such country that doesn’t make efforts to protect its domestic market. Protectionism and free trade, therefore, manifest itself to a greater or lesser degree in all countries. For this reason discussions shouldn’t be focused on which of these approaches is “good” and which is “bad”. The major issue is to determine which approach is the most optimal for a certain country. In other words, country’s foreign trade should be “free” (free trade) to the extent necessary to keep its domestic market safe (protectionism). Researchers, who attack protectionism, believe that export of cheaper foreign products of higher quality to the country’s domestic market is nothing else but protection of domestic customers’ rights. The constitutions of most countries recognize the right of buying a quality product on the market as a basic law. Then why the consumers’ right is being violated by creating additional privileges for local goods? For example, the import of toys is restricted in some countries, where toys are manufactured. However, all families have a right to buy more beautiful and interesting toys for their children. So why should these families and their children be divested of that right? Such restrictions to different consumer goods were used extensively in the territory of the former USSR. Such restrictions shaped a “black market” and promoted expanding the illegal economy in the country.
However, there are entirely different cases. For example, the import of cheap and low-quality oils even of unknown origin with a low purchasing power, and by the means of advertising the product becomes more available to population. To buy or not to buy this product – this is consumer’s right. However, not all consumers can be classified as highly skilled “experts” of goods. It means that government should control imports of goods in order to take care of its citizens’ health. Such control can impose restrictions on the import of substandard goods to the domestic market. Thus, “protectionism” and “free trade” cannot be considered two views completely contradicting each another. As a matter of fact, there is a different, high or low degree of protectionism.
Thus, the key issue for the economy of any country is not “the need for restriction” of state’s foreign trade, but “the degree of necessary restrictions”. For every country it is necessary to find optimum between liberalization and dirigisme on foreign trade. This optimum is not universal for any country and depends on many economic or non-economic factors, including mentality of the society and democratization. Restriction of any aspect, including foreign trade activity, to a greater or lesser degree is government intervention in the economy. The level of government intervention in the economy is measurable and can be evaluated with different indicators. So to develop any methodology for measuring balance between liberalization of foreign trade rejims and dirigisme is necessary to stimulate sustainable economic growth.
Liberalization issues of foreign trade as researching object has been investigating for a long time. But until now there is not clear methodology to find optimum for liberalization of foreign trade regime to maintain sustainable development and economic security. Some countries which as usual agitate liberal foreign trade rejimes, e.g. USA and UK and etc. sometimes put very strong restrictions in foreign trade. It means liberalization is not unique methods for development. To find balance between liberalization of foreign trade and protectionism is same to find balance between domestic market interest and integration to world economy. So strengthening of liberalization of foreign trade connected with government intervention in this area of economy.
The relationship problems between food security and liberalization of economy isvestigated by many researches. Essential sense of ajastment programs that supported by World Bank and IMF to decrease poverty in developing countries is liberalization of economy in generaly and foreign trade in particulaly (Gera, Nina, 2004). Relationship between food security and liberalization of foreign trade investigated by R. Isgenderov and etc. (Iskenderov, Gulaliyev, Nasirova, 2015) According to the their findings the foreign trade liberalization level and economic growth play special role for ensuring food security. As well as there is no need to choose the agrarian sector as a strategic priority for ensuring food security if the country has no competitive advantage in this sector in the globalization condition.
As well as the investigation by Tweeten (1999), and Dorosh (2001) show that economic growth and trade liberalization are important means for attaining food security.
Some researches, e.g. Jenkins and Scanlan (2001) argue that trade liberalization doesn’t decrease domestic food security, on the contrary trade liberalization increase food supply. Some researchers, e.g. argue that foreign trade liberalization can increase imports and this can create dangerous situation for domestic agricultural production (Friedmann, 1982).By the analyzing of many papers that argue about negative or positive impacts of foreign trade liberalization on economic development and food security we can conclude that essential problems connected with difficulties to find optimum of the foreign trade liberalization level. When liberalization presses is going towards optimum, and then such programs stimulate economic growth. On the contrary, when liberalization prosess is going far from optimum and then such programs is preventing economic growth and food security. So the essential question for every country is to find optimum for liberalization of foreign trade. But it is necessary to take into account that the optimum level for foreign trade liberalization connected with country’s economic situation and different non-economic characteristics, e.g. ethnical and social mentality.
Thus government intervention to economy should take into account countries specification for the foreign trade liberalization optimum. Some authors, e.g. Edwards (1993), Balassa B. (1965),W. Max Corden (1966) call this “optimum” as effective rate of protection. They try to measure this rate as ratio of difference between domestic value added and world value added on any industry to world value added on this industry.
Effective rate of protection methodology is esed by Little, I., etc. (1970) as well as with Balassa B. (1971), for assessment of foreign trade liberalization on the some developing countries’ economies. But these studies don’t take into account many aspects of foreign trade liberalization issues.
“Government intervention in the economy” and “economic freedom” are contradictory terms, but in fact there are only acts, rules, regulations and other restrictive or prohibitive limits of the law, which realize “government intervention in the economy”. Full or partial absence of such limits creates “economic freedom”.
It is, therefore, possible to evaluate “economic freedom” in each country by measuring economic indicators relating to restrictive or prohibitive limits.
Different international organizations, research and development centres conduct such evaluations. For example, the Fraser Institute, The Heritage Foundation, World Bank, World Economic Forum and other organizations carry out comparative evaluation regarding government intervention in the economy. The Heritage Foundation relates “economic freedom” with 4 main aspects, which can be under government control to a greater or lesser degree and influence the economic environment: a) supremacy of law; b) government size; c) regulation effectiveness; d) degree of market openness.
“Doing business” rankings prepared by World Bank is a comparative evaluation, they cover 11 aspects: starting a business, dealing with construction permits, getting electricity, registering property, getting credit, protecting minority investors, paying taxes, trading across borders, enforcing contracts, resolving insolvencies, regulation of labour market.
Index of leftness (rightness) of economy (Muzaffarli, 2014) developed by the Institute of Economics of the Azerbaijan National Academy of Sciences is one of such evaluation methods. The procedure is based on the fundamental principle, i.e. the line of economic activity in each country depends heavily on the legislation of that country. Changes in legal acts more or less influence economic development. Any act is of restrictive and regulatory nature. For this reason the degree of restriction and regulation as well as coverage fields of such intervention is a main feature that differentiates acts. The same is true for foreign trade, since economical-politic tools used in foreign trade activity, for example, import taxes and duties, import and export quota, administrative restrictions, direct grants, export incentives are indicators of government intervention in foreign trade activity. Based on the main principle of Index of leftness (rightness) of economy (IL(R)E), a decrease in such intervention is attributed to adoption of “right” laws, and an increase – with “left” laws. Reducing or increasing the degree of intervention, in other words, adopting laws using “rightism” or “leftism” approaches doesn’t produce the same effect in all countries. It means that adopting laws using “rightism” approach can lead to economic growth in some countries, while in other countries it can be achieved through adoption of laws using “leftism” approaches.
Hypothesis:
• The main hypothesis is that reducing government intervention in the area of foreign trade is necessary, but insufficient for economic growth. In other words, reducing government intervention in the area of foreign trade doesn’t always lead to economic development.
• Another hypothesis is that government intervention in foreign trade is typical even for developed countries, but such intervention is limited.
• Freedom of foreign trade for developing countries doesn’t always lead to economic development.
According to the methodology the modelcreated forms of state intervention are main criteria to distinguish different economic systems (models of market economy) and bipolar, e.g. both objectives pursued by the regulation of foreign trade that, in fact, mutually exclude one another – the freedom of imports and domestic market protection – have a right to exist. As well as the modelcreated forms of state intervention are subjects for political competition, i.e. for the left-wing political groups (parties, organizations, think tanks) a higher priority is, as a rule, the internal market protection, while for the right-wing groups – the freedom of foreign trade.
According to the methodology the leftness or rightness of economy is measurable and can be assessed by the Index. There is not any overall (universal for all economies) optimal value of IL(R)E. Moreover, optimum point of Index for a single country also changes over time under the influence of a variety of economic and non-economic factors. Nevertheless, the cumulative economic growth for several years in any particular country provides a certain ground to define how close the IL(R)E of that country is to its optimal level – the methodology called indicative. It can also be useful in evaluation of government regulation changes in separate sectors of the economy. If government introduces more liberal (or stricter) regulation in any sector of the economy, and as a result, the development pace of that sector becomes higher than that of other sectors (or higher than overall economic growth rate), then policies are chosen properly and reforms of same nature should be continued.
N. Muzaffarli suggests comparative analysis through identification of public intervention in economy as rate of implementation of "leftist" or "rightist" ideas respectively. By "public intervention in economy" Muzaffarli generally deems activities by "public institutions". Precise public institutions do not operate for their own sake but rather have to comply with enforced legislation. Hence, ideological persuasions by decision makers around precise economic challenges resolution are specified in the core essence of the decisions made. For example, if leftist parties constitute majority at the Parliament of any country, leftist ideas will underlie decision making process. And the other way round, rightist ideology will gain the upper hand in decisions made provided the legislation is adopted by the rightist majority. It happens that leftist or rightist insight of decision makers shapes the economic system within a given time. To put it more correctly, it is precisely politics that constrains or expands public intervention in economy.
Leftness and Rightness are issues of political and economic system. The key aspect that distinguishes these two insights lies in different views around evaluation of essential and satisfactory rate of public intervention in social life and, in particular, in economy: as compared to the rightists, the leftists promote more extensive and strict intervention. Indeed, bearers of leftist or rightist ideas contribute to emerging fundamentally new system of economic relations pursuant to their political and economic ideologies. For instance, the Bolshevik coup in Russia provoked drastic changes in real economic relations through private property ban, large-scale expropriation and collectivization policies.
N. Muzaffarli discerns precise forms of public intervention in economy and grounds measurability of different forms of intervention. He asserts that a certain set of indicators will enable us to make rather valid conclusions on prevalence of Leftness or Rightness of economy based upon relevant analysis of the above-mentioned set and to provide grounded country-by-country comparison of public intervention rates. The suggested assessment should specify concrete political and ideological forms of public intervention in economy. Among them one might mention the following: 1) public property and public property-based entrepreneurship percentage; 2) redistribution of income through taxation; 3) social programs implementation; 4) price regulation; 5) planning of economy; 6) foreign trade regulation; 7) arrangement of favorable conditions for business activities.
Muzaffarli-proposed "index of leftness (rightness) of economy" only encompasses assessment of intervention of the government in its capacity of regulatory institution in the fields of real economy. As distinct from similar indices, the suggested indicator enables to evaluate correlation between the current economic system and actual political environment. On the other hand, by keeping track of IL(R)E you can elicit development trends in political and economic outlook in any given country. This method also provides opportunities for revelation of the optimum rate of economic development-oriented public intervention.
IL(R)E is an integral index that consists of several indexes, including foreign trade subindex. In turn, foreign trade subindex is made up of three sub-subindices. The first relates to foreign trade procedures. Favourable rules for carrying out foreign trade activity are vital for an exporter or an importer. World Bank uses three indicators to define favourable foreign trade procedures: a) amount of necessary documents for conducting export-import operations; b) time necessary for executing export-import operations; c) export-import operations execution cost. The sub-subindex named the ease of conducting export-import procedures index is calculated as the simple average value of these three indicators. Certainly, such estimates are made with some assumptions. For example, it’s assumed that cargo is dry, safe, not ammunition, one of main export (import) goods of the country, weights 10 tons, costs $20 000, etc. Foreign trade activity is carried out by a local limited-liability company. That company has no exclusive privileges and counts 60 employees. Such assumptions in the course of estimation may cause some inaccuracies, however they allow comparatively evaluating the state’s foreign trade procedures.
The second sub-subindex of foreign trade subindex is the freedom of foreign trade index. The freedom of foreign trade index is calculated by the Fraser Institute. To measure this index supposedly different indicators are evaluated, including tariffs (relation of foreign trade taxes to overall volume of foreign trade, average tariff rate, tariff rate deviation from average tariff rate), regulation barriers (non-tariff trade barriers, ease of imports and exports documentation execution), exchange rate on the black market, free capital flow and population’s freedom of action (restriction to foreign property, capital supervision, freedom of the entry and leave of foreigners to a country).
The third sub-subindex of foreign trade subindex is the participation in international trade or economic value of imports index. World Economic Forum calculates indicators of this sub-subindex using the methodology of The Global Enabling Trade Report once every two years. This index is calculated based on 4 sub-subindices weighting equal 25%: a) import tariffs and duties, taxes paid by exporters to enter the foreign market; b) quality of frontier and customs services; c) infrastructure; d) working environment.
The fourth sub-subindex of foreign trade subindex is the freedom of trade index, which is calculated using the methodology developed by The Heritage Foundation. For this index weighted average tariff rate for a country is calculated based on the tariff rate applied to this product and the share of each imported product in the total imports and it is indexed with an opposite sign (i.e. not with trade restriction, but an indicator of free trade), and then “penalty” points (0, 5, 10, 15 or 20 points) in respect to non-tariff barriers are derived from this index.
Thus, based on the methodology of international rating agencies, foreign trade subindex, which is a part of IL(R)E, allows roughly assessing the impact of political struggle attributes (economic laws, rules, standards) on the economy. This subindex as IL(R)E is designed to assess not all kinds of state intervention, but such an intervention that could create a model for a certain period. The use of such assessment makes it possible to determine and forecast the economic results of fluctuations in any field of government’s economic policy and in the area of foreign trade. Relations between the performance of foreign trade index and other macroeconomic indicators based on this methodology can, therefore, reflect positive or negative effect of implemented economic reforms.
Foreign trade subindices, sub-subindices and points by sub-subindices based on the methodology of IL(R)E for 66 countries as of 2015 are shown in Table 1. GDP per capita in 66 countries is also reflected there. It stands to reason that the table includes countries with different geographic location, level of economic development, population and territory size, etc. Comparing states with different economic political geographic and other indicators provides some information what impact foreign trade conditions have on the economic development of one or another country.
Possible maximum and minimum limits of points for each index are taken into account when measuring sub-subindices of IL(R)E foreign trade subindex. The following minimum and maximum values are taken in the indexation research: freedom of trade sub-subindex (0;10), economic evaluation of import (0;10), free trade (0;100).
Table 1
Relation between foreign trade subindex, its sub-subindices and GDP per capita for some states
|
Freedom of foreign trade (The Fraser Institute, 2014) |
Freedom of foreign trade sub-subindex |
Economic value of import (point) World Economic Forum, 2014) |
Economic value of import sub-subindex |
Freedom of trade (point) The Heritage Foundation, 2015) |
Freedom of trade sub-subindex |
Foreign trade subindex |
GDP ($/per capita) |
United States |
7,7 |
0,77 |
5,3 |
0,72 |
87 |
0,87 |
0,21 |
54629,5 |
Albania |
7 |
0,7 |
5,9 |
0,82 |
87,8 |
0,878 |
0,20 |
4564,4 |
Germany |
7,8 |
0,78 |
4,9 |
0,65 |
88 |
0,88 |
0,23 |
47773,9 |
Australia |
7,7 |
0,77 |
5,6 |
0,77 |
86,4 |
0,864 |
0,20 |
61979,9 |
Austria |
7,8 |
0,78 |
4,9 |
0,65 |
88 |
0,88 |
0,23 |
51122,4 |
Azerbaijan |
6,8 |
0,68 |
4,3 |
0,55 |
76 |
0,76 |
0,34 |
7886,5 |
United Arab Emirates |
8,2 |
0,82 |
4,9 |
0,65 |
82,4 |
0,824 |
0,23 |
43962,7 |
Bulgaria |
7,6 |
0,76 |
4,9 |
0,65 |
88 |
0,88 |
0,24 |
7851,3 |
Bosnia-Herzegovina |
7,3 |
0,73 |
5,3 |
0,72 |
87,2 |
0,872 |
0,23 |
4851,7 |
Great Britain |
8,6 |
0,86 |
4,9 |
0,65 |
88 |
0,88 |
0,20 |
46297 |
Brazil |
7,1 |
0,71 |
4 |
0,5 |
69,6 |
0,696 |
0,36 |
11726,8 |
Republic of South Africa |
7,2 |
0,72 |
5 |
0,67 |
76,6 |
0,766 |
0,28 |
6483,9 |
Czech Republic |
7,9 |
0,79 |
4,9 |
0,65 |
88 |
0,88 |
0,23 |
19502,4 |
China |
6,7 |
0,67 |
4,2 |
0,53 |
71,8 |
0,718 |
0,36 |
7590 |
Denmark |
8,2 |
0,82 |
4,9 |
0,65 |
88 |
0,88 |
0,22 |
60718,4 |
Armenia |
7,3 |
0,73 |
5,8 |
0,8 |
85,4 |
0,854 |
0,21 |
3873,5 |
Estonia |
8,3 |
0,83 |
4,9 |
0,65 |
88 |
0,88 |
0,21 |
20147,8 |
Finland |
8,4 |
0,84 |
4,9 |
0,65 |
88 |
0,88 |
0,21 |
49842,7 |
France |
8 |
0,8 |
4,9 |
0,65 |
83 |
0,83 |
0,24 |
42725,7 |
Georgia |
8,5 |
0,85 |
6 |
0,83 |
88,6 |
0,886 |
0,14 |
4435,2 |
India |
6,2 |
0,62 |
2,9 |
0,32 |
64,6 |
0,646 |
0,47 |
1581,5 |
Indonesia |
6,8 |
0,68 |
5,4 |
0,73 |
74,8 |
0,748 |
0,28 |
3491,9 |
Iran |
2,6 |
0,26 |
2,4 |
0,23 |
41,4 |
0,414 |
0,70 |
5442,9 |
Ireland |
8,7 |
0,87 |
4,9 |
0,65 |
88 |
0,88 |
0,20 |
54339,3 |
Spain |
7,7 |
0,77 |
4,9 |
0,65 |
88 |
0,88 |
0,23 |
29721,6 |
Israel |
7,9 |
0,79 |
5,3 |
0,72 |
88,6 |
0,886 |
0,20 |
37206,2 |
Sweden |
7,9 |
0,79 |
4,9 |
0,65 |
88 |
0,88 |
0,23 |
58898,9 |
Switzerland |
7,2 |
0,72 |
4,6 |
0,6 |
90 |
0,9 |
0,26 |
85616,6 |
Italy |
7,6 |
0,76 |
4,9 |
0,65 |
88 |
0,88 |
0,24 |
35222,8 |
Canada |
7,7 |
0,77 |
5,7 |
0,78 |
88,4 |
0,884 |
0,19 |
50230,8 |
Cyprus |
7,7 |
0,77 |
4,9 |
0,65 |
88 |
0,88 |
0,23 |
27194,4 |
Latvia |
8,1 |
0,81 |
4,9 |
0,65 |
88 |
0,88 |
0,22 |
15692,2 |
Lithuania |
7,6 |
0,76 |
4,9 |
0,65 |
88 |
0,88 |
0,24 |
16489,7 |
Luxembourg |
8,1 |
0,81 |
4,9 |
0,65 |
88 |
0,88 |
0,22 |
116613 |
Hungary |
7,7 |
0,77 |
4,9 |
0,65 |
88 |
0,88 |
0,23 |
14026,6 |
Macedonia |
7,7 |
0,77 |
5,5 |
0,75 |
86,2 |
0,862 |
0,21 |
5455,6 |
Malaysia |
7,6 |
0,76 |
4,8 |
0,63 |
80 |
0,8 |
0,27 |
11307,1 |
Malta |
8,1 |
0,81 |
4,9 |
0,65 |
88 |
0,88 |
0,22 |
22776,2 |
Mexico |
7 |
0,7 |
5,2 |
0,7 |
85,6 |
0,856 |
0,25 |
10325,6 |
Egypt |
6,2 |
0,62 |
3,3 |
0,38 |
70 |
0,7 |
0,43 |
3365,7 |
Moldova |
6,8 |
0,68 |
5 |
0,67 |
79,8 |
0,798 |
0,28 |
2238,9 |
Montenegro |
7,7 |
0,77 |
5,7 |
0,78 |
84,8 |
0,848 |
0,20 |
7378,3 |
Netherlands |
8,5 |
0,85 |
4,9 |
0,65 |
88 |
0,88 |
0,21 |
52138,7 |
Norway |
7,4 |
0,74 |
5 |
0,67 |
89,4 |
0,894 |
0,23 |
97299,6 |
Poland |
7,4 |
0,74 |
4,9 |
0,65 |
88 |
0,88 |
0,24 |
14336,8 |
Portugal |
7,9 |
0,79 |
4,9 |
0,65 |
88 |
0,88 |
0,23 |
22124,4 |
Kazakhstan |
5,5 |
0,55 |
3,8 |
0,47 |
79 |
0,79 |
0,40 |
12601,6 |
Qatar |
7,8 |
0,78 |
5,9 |
0,82 |
81,8 |
0,818 |
0,19 |
96732,4 |
Kirghizia |
6,5 |
0,65 |
4,7 |
0,62 |
80,2 |
0,802 |
0,31 |
1268,9 |
Romania |
7,8 |
0,78 |
4,9 |
0,65 |
88 |
0,88 |
0,23 |
10000 |
Russia |
6,1 |
0,61 |
3,3 |
0,38 |
75 |
0,75 |
0,42 |
12735,9 |
Source: calculated and compiled by the author
The relations between foreign trade subindex and GDP per capita are shown on Chart 1. It’s shown that countries with a high level of GDP implement more liberal foreign economic policy. Among 66 countries all countries with GDP per capita over $20 thousand have foreign trade subindex below 0,26. It’s impossible to claim the opposite, since more liberal foreign trade conditions of a country, for example, foreign trade subindex below 0,26 doesn’t guarantee the absolute high level of GDP per capita. The above-stated hypothesis is, therefore, correct, i.e. reducing government intervention in foreign trade is necessary, but insufficient for economic growth. In other words, reducing government intervention in the area of foreign trade doesn’t always lead to economic development. One of the researched countries, Saudi Arabia, is an exception to the hypothesis. However, it should be noted that oil exports play a leading part in its GDP per capita, and the relation between foreign trade conditions and GDP reflects the level of country’s economic liberality inadequately. Among the researched countries Iran has the greatest foreign trade subindex, i.e. it’s the most “left” country, and Singapore, the most “right” country, has the lowest.
Chart 1
Relation between foreign trade subindex and GDP level per capita (2015)

All L(R)IE components, including foreign trade subindex and its sub-subindices, are dynamic indices. The dynamism of these indicators depends on the government intervention dynamics. Any measures adopted by the government with regard to different branches of economy, particularly, foreign trade, such as tariff shift, increasing or decreasing non-tariff barriers, reforms in customs policy, etc. are reflected in the values of foreign trade subindex and its sub-subindices. Such reforms usually play a “model-forming” part in the country’s economy. These reforms, depending on its nature, either direct the country’s foreign trade activity towards liberalization (“to the right”) or protectionism (“to the left”). As we have already mentioned, the trend of the country’s foreign trade activity “to the right” is necessary, but insufficient for economic growth, since the country’s economic development depends not only on foreign trade. The direction “to the right” in the foreign trade of developing countries, therefore, creates potential conditions for its future development.
Table 2
Foreign trade subindex performance in Azerbaijan
|
Freedom of trade (point) The Heritage Foundation, 2015) |
Index |
Freedom of foreign trade (point) The Fraser Institute, 2014) The Fraser Institute, 2014) |
Index |
Economic value of import (point) |
Index |
Subindex of foreign trade |
2000 |
55 |
0,45 |
5,92 |
0,408 |
4,3 |
0,45 |
0,436 |
2001 |
66,8 |
0,332 |
5,92 |
0,408 |
4,3 |
0,45 |
0,397 |
2002 |
74,4 |
0,256 |
5,92 |
0,408 |
4,3 |
0,45 |
0,371 |
2003 |
71,6 |
0,284 |
5,92 |
0,408 |
4,3 |
0,45 |
0,381 |
2004 |
69,2 |
0,308 |
5,92 |
0,408 |
4,3 |
0,45 |
0,389 |
2005 |
69,2 |
0,308 |
5,92 |
0,408 |
4,3 |
0,45 |
0,389 |
2006 |
72,6 |
0,274 |
5,92 |
0,408 |
4,3 |
0,45 |
0,377 |
2007 |
77,6 |
0,224 |
5,92 |
0,408 |
4,3 |
0,45 |
0,361 |
2008 |
78,4 |
0,216 |
5,92 |
0,408 |
4,3 |
0,45 |
0,358 |
2009 |
78,4 |
0,216 |
5,92 |
0,408 |
4,3 |
0,45 |
0,358 |
2010 |
77,1 |
0,229 |
6,48 |
0,352 |
4,3 |
0,45 |
0,344 |
2011 |
77,1 |
0,229 |
6,54 |
0,346 |
4,3 |
0,45 |
0,342 |
2012 |
77,2 |
0,228 |
6,79 |
0,321 |
4,3 |
0,45 |
0,333 |
2013 |
77,2 |
0,228 |
6,79 |
0,321 |
4,3 |
0,45 |
0,333 |
2014 |
77,2 |
0,228 |
6,79 |
0,321 |
4,3 |
0,45 |
0,333 |
2015 |
76 |
0,24 |
6,79 |
0,321 |
4,3 |
0,45 |
0,337 |
2016 |
75,8 |
0,242 |
6,79 |
0,321 |
4,3 |
0,45 |
0,338 |
Source: calculated and compiled by the author
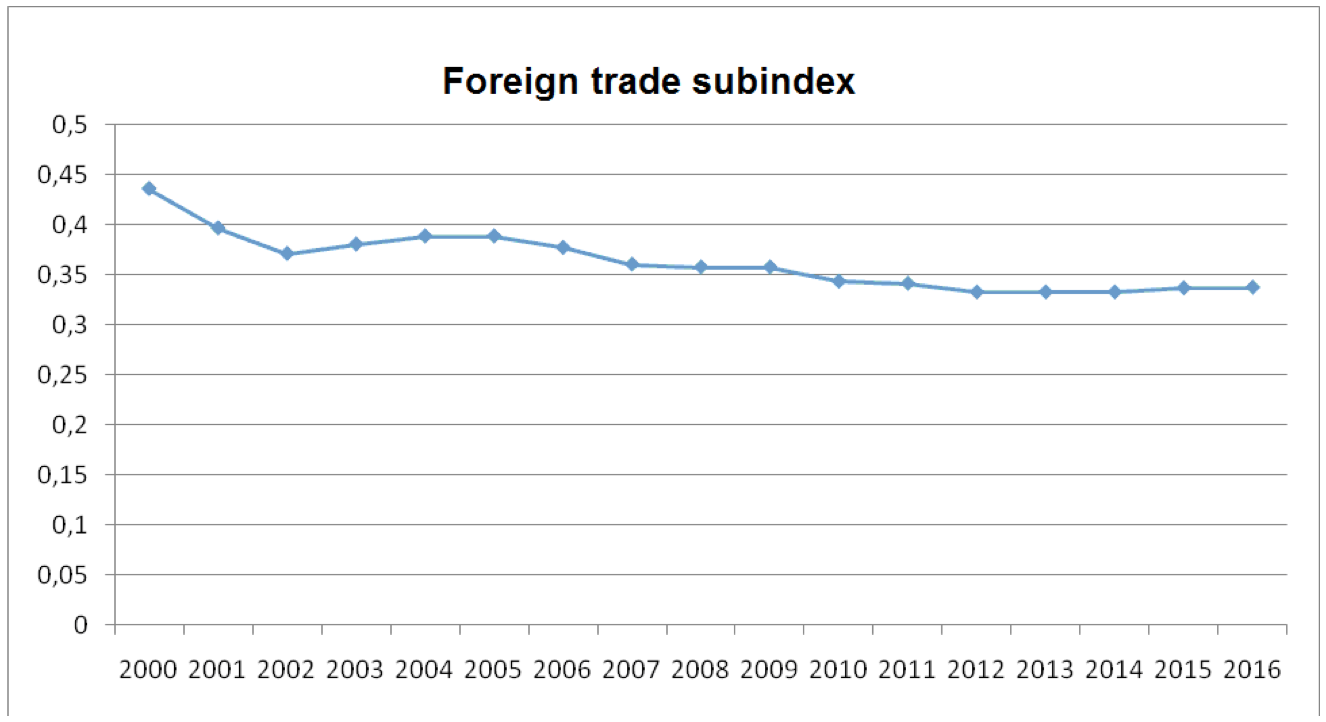
The performance of foreign trade subindex and its sub-subindices in Azerbaijan over the last 15 years is presented in Table 2. As it seen from the table, indicators of foreign trade subindex and all its sub-subindices represent a steady downward trend. In other words, foreign trade conditions in Azerbaijan over the last 15 years have had a trend “to the right”. This trend can be observed on Chart 2. The conditions of foreign trade of Azerbaijan in 2000-2003 were rapidly liberalized. Although the process of liberalization slightly slowed down in the following years, it was stable in 2005-2012. As it seen from the chart, since 2013, especially following devaluation in 2015, protectionist trends in the foreign trade of Azerbaijan have intensified. And it makes sense, since countries all over the world practice taking “leftism” decisions, when they face economic problems. Nonetheless, the need for protecting the domestic market called for adoption of protectionist decisions over the last year due to national currency devaluation in Azerbaijan, however that decisions weren’t sweeping, and “rightism” in foreign trade persists.
Chart 2
Foreign trade subindex
As it seen from the first chart, in developing countries, where GDP per capita is below 20 thous. USD, foreign trade subindex for 2015 is between 0,1-0,7. This indicator is 0,34 in Azerbaijan and within this range. But there’s no country that took part in the research, where this indicator exceeds 0,26. It means that foreign trade subindex should decrease and foreign trade policy should acquire the “rightism” trend to make GDP per capita values exceed 20 thousand USD.
Table 3
Relation between foreign trade subindex and some macroeconomic indicators
|
Foreign trade subindex
|
GDP (mln. USD) (ASSC, 2015) G |
Import (mln. USD) (Import-ASSCI,2015)
|
Export (mln. USD) Et
|
Foreign trade turnover (mln. USD) Bt=Et+It |
Foreign trade balance (mln. USD)
|
2000 |
0,436 |
5272,8 |
1172071,3 |
1745220,0 |
2917291 |
573148,7 |
2001 |
0,397 |
5707,7 |
1431107,4 |
2314206,4 |
3745314 |
883099 |
2002 |
0,371 |
6235,9 |
1665484,0 |
2167400,0 |
3832884 |
501916 |
2003 |
0,381 |
7276,0 |
2626181,0 |
2590377,5 |
5216559 |
-35803,5 |
2004 |
0,389 |
8680,4 |
3515930,0 |
3615449,8 |
7131380 |
99519,8 |
2005 |
0,389 |
13238,7 |
4211221,8 |
4347151,2 |
8558373 |
135929,4 |
2006 |
0,377 |
20983,0 |
5266743,5 |
6372165,0 |
11638909 |
1105422 |
2007 |
0,361 |
33050,3 |
5713525,3 |
6058222,3 |
11771748 |
344697 |
2008 |
0,358 |
48852,5 |
7169980,9 |
47756040,2 |
54926021 |
40586059 |
2009 |
0,358 |
44297,0 |
6123110,5 |
14701358,8 |
20824469 |
8578248 |
2010 |
0,344 |
52909,3 |
6600611,6 |
21360210,2 |
27960822 |
14759599 |
2011 |
0,342 |
65951,6 |
9755968,7 |
26570898,3 |
36326867 |
16814930 |
2012 |
0,333 |
69683,9 |
9652870,6 |
23907983,7 |
33560854 |
14255113 |
2013 |
0,333 |
74164,4 |
10712502,5 |
23975416,8 |
34687919 |
13262914 |
2014 |
0,333 |
75234,7 |
9187697,6 |
21828608,9 |
31016307 |
12640911 |
2015 |
0,337 |
52969,5 |
9221402,8 |
11424477,3 |
20645880 |
2203075 |
2016 |
0,338 |
- |
- |
- |
- |
- |
Note: The table is compiled based on authors’ calculations with the
use of Azerbaijan National Committee of Statistics data.
The relation between foreign trade subindex performance and GDP volume, foreign trade turnover and foreign balance over the last 15 years in Azerbaijan is shown in Table 3. As it shown in the table, GDP volume increases as foreign trade conditions improve. This fact proves once again that despite foreign trade subindex is distributed in a wide range in developing countries, their economic development depends on foreign trade liberalization and reduction of government interference in foreign trade activity.
Chart 3
Interrelation between foreign trade subindex and GDP
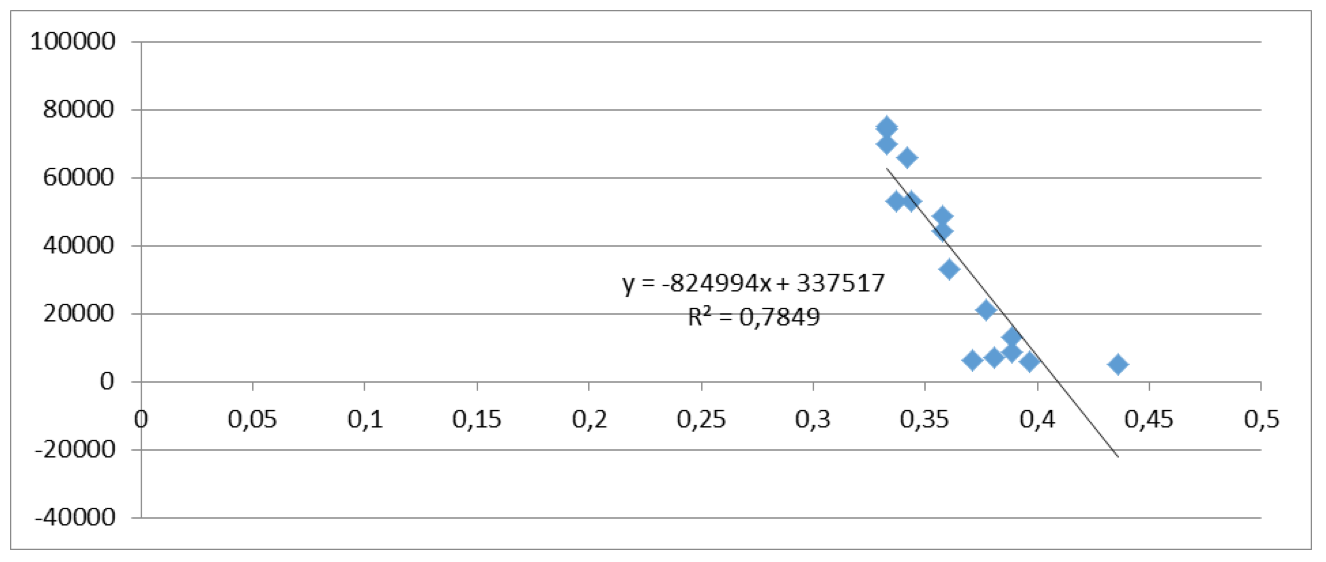
Chart 4
Statistics and tests for Interrelation between foreign trade subindex and GDP
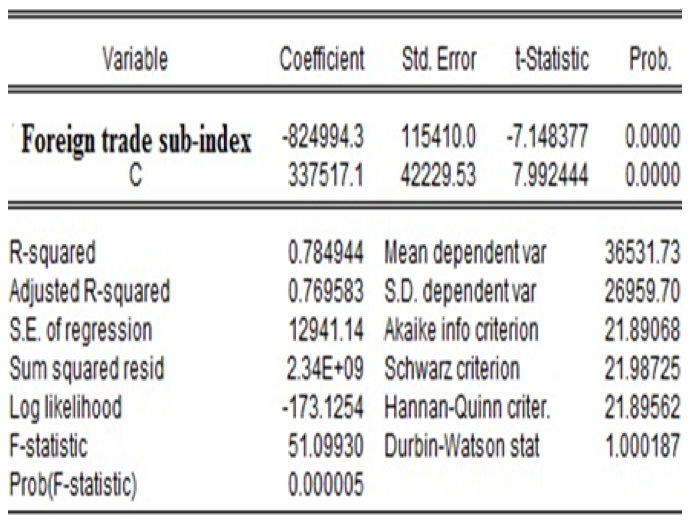
As it seen from Chart 3 and Chart 4, there’s a strong correlation relationship between foreign trade subindex and GDP of Azerbaijan (R = 0,8859). If we compare interrelation between GDP volume and foreign trade subindex in the above-named 66 states and Azerbaijan, we can conclude that liberalization of foreign trade conditions is necessary to increase GDP volume in Azerbaijan. There’s, therefore, no reason to implement protectionism policy in the country because of concerns related to national currency devaluation, and the process of liberalization should continue. There’s a probability that foreign trade liberalization will produce a negative, and protectionism policy – a positive effect, however one has to agree with the fact that sustainable economic development requires a stable trend of “rightnessism” in foreign trade.
We can compare these results with the results of Kwan and Cotsomitis (1991) on Chinese economic growth and foreign trade. According to their investigation there is positive relationship between these variables. Tong (1995) also explored the relationship between economic growth and import. He recognized that import at different times contributed to economy differently, but on the whole, there was a positive correlation between import and economic growth. According to the results of Summers’ (1997) investigation, who analysed the relationship between external trade and growth in Australia and Canada, imports and exports play different roles in economic growth of Canada and Austrialia. Import plays a significant role in Canada but no evidence was found to support the export-led growth in Australia. Aurangzeb (2006) examined the link between exports, productivity and economic growth in Pakistan. According to these his conclusion there is good relationship between these variables.
Our results on relationship between foreign trade liberalization and economic grouth corresponds with results of many researchers, including Marie Daumal and Selin Özyurt There are many investigations that have results on positive relationship between foreign trade and GDP. Yaya Keho (2017), Feder (1983), Akeem (2011), Ezike et al. (2012), Ahmed et al.; (2008) and many other researchers concluded that there is positive relationship between trade openness and economic growth. By our investigation we have concluded, that:
1. Rreducing government intervention in the area of foreign trade is necessary, but insufficient for economic growth. In other words, reducing government intervention in the area of foreign trade doesn’t always lead to economic development.
2. There’s government intervention in foreign trade in developed countries, but such intervention is limited.
3. Freedom of foreign trade in developing countries doesn’t always lead to economic development.
4. Over the last 15 years foreign trade subindex in Azerbaijan has represented a steady downward trend.
5. There’s no reason to take protectionist measures because of concerns related to devaluation of the national currency of Azerbaijan.
Ahmed, A.D., Cheng, E., Messinis, G. (2008). The Role of Exports, FDI and Imports in Development: New Evidence from Sub-Saharan African Countries. Melbourne: Center for Strategic Economic Studies, Victoria University. Working Paper No. 39.
Akeem, U.O. (2011). Performance Evaluation of Foreign Trade and Economic Growth in Nigeria. Research Journal of Finance and Accounting, vol. 2, n. 2.
Aurangzeb, A. (2006). Export, Productivity and Economic Growth in Pakistan: A Time Series Analysis. The Lahore Journal of Economics, vol. 11, n. 1, pp. 1 – 18.
Azerbaijan State Statistical Commitee- Export-ASSCE. (2015). Retrieved from: http://www.azstat.org/MESearch/details?lang=az&type=2&id=277&departament=4
Azerbaijan State Statistical Committee - Import-ASSCI. (2015). Retrieved from: http://www.azstat.org/MESearch/details?lang=az&type=2&id=276&departament=4
Azerbaijan State Statistical Commitee-ASSC. (2015). Retrieved from: http://www.stat.gov.az/source/system_nat_accounts/
Balassa, B. (1965). Tariff protection in industrialized countries: An evaluation. Journal of political economics, n.76, pp. 573-94.
Balassa, B. (1971). The structure of protection in developing countries. Baltimore: Johons Hopkins University press.
Corden, W.M. (1966). The structure of tariff system and the effective protection rate. Journal of political economics, no. 74, pp. 221-37.
Daumal, M., Özyurt, S. (2011). The Impact of International Trade Flows on Economic Growth in Brazilian States. Review of Economics and Institutions, vol. 2, n. 1, Article 1. Winter. Retrieved from: www.rei.unipg.it ISSN 2038-1379 DOI 10.5202/rei.v2i1.5
Dorosh, P.A. (2001). Trade Liberalization and National Food Security: Rice Trade between Bangladesh and India. World Development, vol. 29, n. 4, pp. 673-689.
Edwards, S. (1993). Openness, Trade Liberalisation and Growth in Developing Countries. Journal of Economic Literature, vol. 31, n. 3, pp. 1358–1393.
Ezike, J.E., Ikpesu, F., Amah, P. (2012). Macroeconomic Impact of Trade on Nigerian Growth: An Empirical Evaluation. Research Journal of Business Management and Accounting, vol. 1, n. 4, pp. 079 - 083.
Feder, G. (1982). On Export and Economic Growth. Journal of Development Economics, 12, pp. 59 – 73.
Friedmann, H. (1982). The political economy of food: the rise and fall of the postwar international food order. American Journal of Sociology, vol. 88, pp. S248–S286.
Gera, N. (2004). Food Security under Structural Adjustment in Pakistan. Asian Survey, vol. 44, n. 3, pp. 353-368.
Iskenderov, R., Gulaliyev, M., Nasirova, O. (2015), Assessment of major factors of food security. Russian Journal of Agricultural and Socio-Economic Sciences, vol. 10, n. 58, (October 2016), pp. 128-138.
Jenkins, J. Craig and SCANLAN, Stephen J. (2001). Food Security in Less Developed Countries, 1970 to 1990. American Sociological Review, vol. 66, n. 5, pp. 718-744.
Keho, Y. (2017). The impact of trade openness on economic growth: The case of Cote d’Ivoire. Cogent Economics & Finance, vol. 5, pp. 1332820. Retrieved from: https://doi.org/10.1080/23322039.2017.1332820
Kwan, A.C.C., Kwok, J.A. (1996). Economic Growth and Exogeneity: Taiwan 1953-88. The American Economist, vol. 28, n. 4, pp. 467-471(5).
Little, I., Scitovsky, T., Scott, M. (1970). Industry and Trade in Some Developing Countries. London and New York: Oxford University Press for OECD.
Summers, P.M. (1997). Trade and Growth in Settler Economies: Australian and Canadian Comparisons. Melbourne: Melbourne Institute Working Paper 9/97/.
The Fraser Institute. (2014). Retrieved from: http://www.freetheworld.com/2014/EFW2014-POST.pdf
The Heritage Foundation. (2015). Retrieved from: http://www.heritage.org/index/explore?view=by-region-country-year
The Heritage Foundation. (2015). Retrieved from: http://www.heritage.org/index/pdf/2015/book/index_2015.pdf
Tong, J. (1995). Growth and Causality in China. Journal of Development Economics, vol. 18, pp. 1 – 12.
Tweeten, L. (1999). The Economics of Global Food Security. Review of Agricultural Economics, vol. 21, n. 2, pp. 473-488.
World Economic Forum. (2014). Retrieved from: http://www3.weforum.org/docs/WEF_GlobalEnablingTrade_Report_2014.pdf
1. Ph.D. Head of Department of Methodology and Econometric Issues of State Regulation of Economy. Institute of Economics of the Azerbaijan National Academy of Sciences. Baku, Azerbaijan. gulaliyevm@yahoo.com
2. Ph.D. Candidate of Department of Globalization and Foreign Economic Relations. Institute of Economics of the Azerbaijan National Academy of Sciences. Baku, Azerbaijan. shahry2004@mail.ru
3. Ph.D. Docent of Department of Theoretical and Applied Economics. Azerbaijan State University of Economics (UNEC). Baku, Azerbaijan. h-sehla@mail.ru
4. Ph.D. Candidate. Azerbaijan State University of Economics (UNEC). Baku, Azerbaijan. reyhan_azizova@mail.ru
5. Ph.D. Candidate of Department of Globalization and Foreign Economic Relations. Institute of Economics of the Azerbaijan National Academy of Sciences. Baku, Azerbaijan. ceyranchol@rambler.ru