![]() ISSN 0798 1015
ISSN 0798 1015

![]() ISSN 0798 1015
ISSN 0798 1015
Vol. 38 (Nº 33) Año 2017. Pág. 14
Diana D. BURKALTSEVA 1; Yuriy N. VOROBYOV 2; Oleg G. BLAZHEVICH 3; Еvgenia Е. FROLOVA 4; Artem A. PUHART 5
Received: 20/05/2017 • Approved: 01/06/2017
ABSTRACT: This article outlines the basis of formation of socio-economic indicators system providing economic security of a business through application in the future of neural networks as the primary element of economic system to create investment platforms, develop and support the next generation system for regulation of production. This is done by systematizing indicators, using cognitive technologies and decomposition of the factor space, justifying the fundamental factors in real time with due account for the effect of integration, globalization and modern challenges that create a new round of risks, threats, and hazards, poorly understood to date. The main purpose of this article consists in calculating coefficients characterizing economic security of Public Joint Stock Company "Severstal" (PAO Severstal). This includes calculating integrated indicator of economic security, determining the trends in the dynamics of the integrated indicator of economic security and its components at PAO Severstal in 2014-2016, comparing the calculation of the integrated indicator of economic security with and without taking into account the weighting coefficients. The main conclusions of this work can be formulated as follows: 1. The calculation of the integrated indicator of economic security at PAO Severstal has shown that this indicator does not depend significantly on weighting coefficients. The best values of the integrated indicator of economic security were defined for III, II and IV quarters of 2015 without taking into account the weighting coefficient of cumulative indicators, and for III, IV and II quarters of 2015 – with the use of weighting coefficient. The worst level of economic security was noted in I and IV quarters without taking into account the weighting coefficient. While, if used, these quarters swap places. Comparing them with statutory values, we see that the obtained data are below statutory value of the integrated indicator of economic security, no matter whether weighting coefficients were used or not. 2. Adequate mathematical models to be used for the economic security management require a comprehensive accounting of uncertainty factors associated with the specifics of business operation in modern economy conditions. |
RESUMEN: Este artículo describe las bases de la formación del sistema de indicadores socioeconómicos proporcionando la seguridad económica de un negocio a través de la aplicación en el futuro de las redes neuronales como elemento primario del sistema económico para crear plataformas de inversión, desarrollar y apoyar el sistema de próxima generación para la regulación de la producción . Esto se hace sistematizando indicadores, utilizando tecnologías cognitivas y descomponiendo el espacio de factores, justificando los factores fundamentales en tiempo real, teniendo debidamente en cuenta el efecto de la integración, la globalización y los desafíos modernos que crean una nueva ronda de riesgos, amenazas y peligros, Poco entendido hasta la fecha. El objetivo principal de este artículo consiste en calcular los coeficientes que caracterizan la seguridad económica de la Sociedad Anónima Pública "Severstal" (PAO Severstal). Esto incluye el cálculo del indicador integrado de seguridad económica, determinando las tendencias de la dinámica del indicador integrado de seguridad económica y sus componentes en PAO Severstal en 2014-2016, comparando el cálculo del indicador integrado de seguridad económica con y sin tener en cuenta la Coeficientes de ponderación. Las principales conclusiones de este trabajo pueden formularse de la siguiente manera: 1. El cálculo del indicador integrado de seguridad económica en PAO Severstal ha mostrado que este indicador no depende significativamente de los coeficientes de ponderación. Los valores óptimos del indicador integrado de seguridad económica se definieron para los trimestres III, II y IV de 2015 sin tener en cuenta el coeficiente de ponderación de los indicadores acumulativos y para los trimestres III, IV y II de 2015 con el uso del coeficiente de ponderación. El peor nivel de seguridad económica se observó en los trimestres I y IV sin tener en cuenta el coeficiente de ponderación. Si bien, si se usan, estos lugares cambian de lugar. Comparándolos con los valores estatutarios, vemos que los datos obtenidos están por debajo del valor legal del indicador integrado de seguridad económica, independientemente de si se utilizaron coeficientes de ponderación o no. 2. Los modelos matemáticos adecuados que se utilizarán para la gestión de la seguridad económica requieren una contabilidad completa de los factores de incertidumbre asociados con los aspectos específicos de la operación del negocio en las condiciones de la economía moderna. |

Financial and economic security of the business is the primary element of the economic system, including that at the national level.
The study of the theory of economic security was significantly contributed by foreign scientists: J. Azoulay, V. Pareto, A. Esau, B. Hager, A. Brown, and many others (Kunitsyn, A.V., 1998; Mikhalkin, V.A., 1990; Romadina, L.N., 2008; Yakunin, et. al. 2008; A set of guidelines for socio-economic cost benefit analysis of transport infrastructure project appraisal, 2003; Azoulay 2010; Breidinger 2006; Brown, n. d.; Sutnata and Byrd 2007; D’Agostino 2008; Murray and Grybeste 2007; Friest 2007; Sullivaut 2007).
The evaluation of economic-financial security of business, theoretical and methodological approaches to ensure the financial security of business are studied in many works of Russian and foreign scientists: A. Baranowski, I. Blank, L. Borshch, K. Goryacheva, G. Vechkanov, V. Vorobiev, A. Gukova, E. Oleynikov, R. Papekhin, Yu. Pogosov (Baranovsky 2000; Blank 2004; Vechkanov 2007; Gukova and Anikin 2006; Oleynikov 2005; Papekhin 2007; Pogosova and Lebedev 2014), etc. Though problems on financial and economic security of business are considered fragmentary and definitely require further research.
Financial and economic security of the state was researched by famous scientists and practitioners, though it is poorly studied in terms of the consolidation of business and public administration of economic and financial security of business. The study in the framework of Financial and economic security of business as a primary link in the economic system, carried out based on (Burkaltseva, D.D., 2012; Borsch, et. al. 2016; Oleynikov, et. al. 2005; The main components and the direction to ensure the economic security of the enterprise; Burkaltseva, et. al. 2016; Dudin, et. al. 2014; . Dudin, et. al. 2016; Borsch, et. al. 2016a; Vivchenko 2013; Burkaltseva, et. al. 2016a; Goryacheva 2006; Dudin, et. al. 2015) led to the comprehension of the relevance of the security issue at the micro, meso, macro, and mega levels, and defined the purpose and subject of the present article.
In this article, when calculating the integrated indicator of economic security, determining the dynamics trends of the integrated indicator of economic security and its components at PAO Severstal in 2014-2016, comparing calculated values of integrated index of economic security with and without taking into account the weighing coefficient, we used the analysis, comparison, as well as ratio analysis, graphical, statistical and economic-mathematical methods.
Suitable mathematical models to manage economic security require a comprehensive accounting of all uncertainty factors associated with the specifics of business operation under current management conditions. The effect of these factors makes it difficult to obtain correct and reasonable solutions, determines the practical importance of fuzzy data processing and the need to use fuzzy-set approach [29].
To assess the level of business economic security, it is necessary to establish a system of socio-economic indicators with the further use of neural networks (Table 1).
Table 1. The system of socio-economic indicators characterizing the level of business economic security
Indicators |
Optimization trend |
Statutory values |
The ratios of financial status |
||
1. The share of circulating assets in the property |
increase |
0.5 |
2. The share of receivables in assets |
increase |
0.20 |
3. The mobile assets ratio |
increase |
1 |
4. The growth rate of business property |
increase |
1.025 |
5. The growth rate of current assets |
increase |
1.0125 |
The ratios of liquidity and solvency |
||
1. Absolute liquidity ratio |
the best condition 0.2 - 0.3 |
0.2-0.3 |
2. The refined (intermediate) liquidity ratio |
the best condition 0.7 - 0.8 |
0.7-0.8 |
3. The current liquidity ratio |
the best condition 1.0 - 2.0 |
1.0-2.0 |
4. The solvency ratio |
increase |
0.50 |
The ratios of financial independence |
||
1. Equity to total assets |
increase |
0.5 |
2. Financing ratio |
increase |
1 |
3. Stable funding sources concentration ratio |
increase |
0.85 |
The ratios of financial soundness |
||
1. The growth rate of invested working capital |
increase |
1.025 |
2. The collateralization ratio of current assets by invested capital |
increase |
0.2 |
3. The maneuverability of the working capital |
increase |
0.3 |
The ratios of business activity |
||
1. The asset turnover ratio |
increase |
0.25 |
2. The current assets turnover ratio |
increase |
0.5 |
3. The inventory turnover ratio |
increase |
1 |
4. The receivable turnover accounts ratio |
increase |
3 |
5. The equity capital turnover ratio |
increase |
0.5 |
6. The payable turnover ratio |
increase |
3 |
7. The duration of the production cycle |
increase |
60 |
8. The duration of the financial cycle |
increase |
45 |
Profitability performance profile (ROI) |
||
Return on equity |
||
1. Return on assets (ROA) |
increase |
0.0175 |
2. Return of equity (ROE) |
increase |
0.025 |
3. Utilization efficiency of circulating assets |
increase |
0.025 |
Profitability of sales |
||
4. Gross sales effectiveness |
increase |
0.2 |
5. Sales operating performance |
increase |
0.1 |
6. The net impact of sales |
increase |
0.05 |
It should be noted that the statutory values are determined for the coefficients calculated per quarters.
After ratios calculation they must be reduced to comparable quantities. To do this we used the following formulas (Blazhevich 2010):
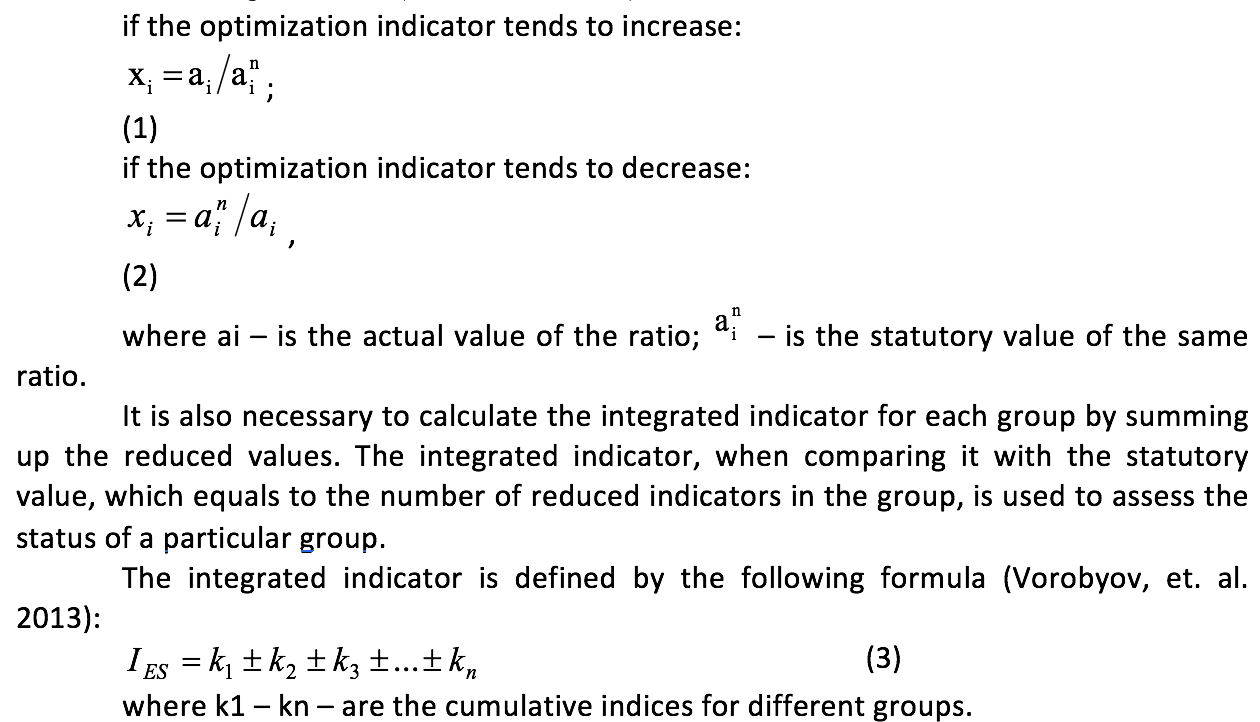
To assess economic security we will use the financial statements of PAO Severstal. We assess economic security, using data from the quarterly reports of the concerned enterprise. Table 2 presents the calculations of financial ratios, characterizing economic security of the enterprise analyzed. Calculations of reduced ratios are presented in Table 3.
Table 4 presents calculations of integrated indicator of economic security of PAO Severstal.
The statutory value for the financial status group is 5, because this group consists of 5 ratios. As we see, the integrated indicator in each of the analyzed periods exceeds the statutory value. The highest value was obtained in the III quarter of 2014. The share of receivables in assets, which is much less than the set statutory value in virtually each of the analyzed periods, provides greatest effect on this ratio.
The statutory value for the liquidity and financial responsibility group is 4. The integrated indicator exceeds the statutory value only in the first quarter of 2015, while in other periods this indicator is less than statutory value. The enterprise inefficiently uses its financial resources. This is evidenced by the absolute liquidity ratio, whose values are significantly above the statutory values for this coefficient.
The statutory value for the financial independence group is 3. The integrated indicator in this group for most of the analyzed periods is within the range of 1.5-2.2. At that, in the I quarter of 2016, the integrated indicator for this group exceeds the value obtained in the IV quarter of 2015. In our view, the situation is non-critical and is explained by the fact that the company pays dividends that reduces the amount of owners' equity.
The statutory value for the financial soundness group is also equal to 3. It should be noted that in I quarter of 2016, the cumulative index for this group is less than 0. The resulting value indicates that in this period, the portion of non-current company assets was formed at the expense of short-term borrowings. Based on this fact, all the financial soundness ratios calculated in this period, were negative. We should also pay attention to the fact that the cumulative index of financial soundness in 2014 is greater than the statutory value, while in 2015, with the exception of the first quarter, it is less than statutory value. Such dynamics of the cumulative index of financial soundness is due to the fact that PAO Severstal in 2015 started to pay its debt to the founders that led to the reduction of owner’s capital, and this in turn has reduced the financial stability of the concerned enterprise.
Table 2. Calculation of indicators characterizing economic security of PAO Severstal
Indicators |
2014 |
2015 |
2016 |
||||||
I Q |
II Q |
III Q |
IV Q |
I Q |
II Q |
III Q |
IV Q |
I Q |
|
The ratios of financial status |
|||||||||
1. The share of circulating assets in the property |
0.1762 |
0.1758 |
0.3205 |
0.3995 |
0.4183 |
0.3872 |
0.4036 |
0.4185 |
0.3745 |
2. The share of receivables in assets |
0.0559 |
0.0643 |
0.0485 |
0.0850 |
0.1049 |
0.0659 |
0.0622 |
0.0791 |
0.0589 |
3. The mobile assets ratio |
0.2139 |
0.2133 |
0.4717 |
0.6653 |
0.7190 |
0.6317 |
0.6766 |
0.7196 |
0.5986 |
4. The growth rate of business property |
0.9785 |
0.9915 |
1.2005 |
1.0039 |
1.0106 |
0.9547 |
1.0487 |
1.0198 |
1.0168 |
5. The growth rate of current assets |
0.9197 |
0.9891 |
2.1888 |
1.2514 |
1.0581 |
0.8837 |
1.0931 |
1.0575 |
0.9099 |
The ratios of liquidity and solvency |
|||||||||
1. Absolute liquidity ratio |
0.3008 |
0.3985 |
1.4636 |
1.2168 |
1.7437 |
0.8110 |
0.7248 |
0.6842 |
0.6379 |
2. The refined (intermediate) liquidity ratio |
0.5980 |
0.8716 |
1.7698 |
1.4487 |
2.1612 |
1.0039 |
0.8712 |
0.7868 |
0.7591 |
3. The current liquidity ratio |
1.0610 |
1.4176 |
2.1797 |
1.9740 |
2.9698 |
1.2794 |
1.0738 |
1.0631 |
0.9700 |
4. The solvency ratio |
0.0610 |
0.4176 |
1.1797 |
0.9740 |
1.9698 |
0.2794 |
0.0738 |
0.0631 |
-0.0300 |
The ratios of financial independence |
|||||||||
1. Equity to total assets |
0.4650 |
0.4970 |
0.4166 |
0.2678 |
0.3443 |
0.3415 |
0.2878 |
0.2529 |
0.2856 |
2. Financing ratio |
0.8693 |
0.9879 |
0.7141 |
0.3658 |
0.5251 |
0.5186 |
0.4042 |
0.3385 |
0.3998 |
3. Stable funding sources concentration ratio |
0.8339 |
0.8760 |
0.8530 |
0.7976 |
0.8592 |
0.6974 |
0.6242 |
0.6064 |
0.6140 |
The ratios of financial soundness |
|||||||||
1. The growth rate of invested working capital |
61.8877 |
5.0657 |
4.0216 |
1.1409 |
1.4224 |
0.2910 |
0.3438 |
0.9135 |
-0.4735 |
2. The collateralization ratio of current assets by invested capital |
0.0575 |
0.2946 |
0.5412 |
0.4934 |
0.6633 |
0.2184 |
0.0687 |
0.0593 |
-0.0309 |
3. The maneuverability of the working capital |
5.9367 |
1.0184 |
0.2872 |
0.3162 |
0.2164 |
0.7812 |
2.2065 |
2.5419 |
-5.3033 |
The ratios of business activity |
|||||||||
1. The asset turnover ratio |
0.1334 |
0.2855 |
0.3669 |
0.4996 |
0.1536 |
0.3083 |
0.4526 |
0.5774 |
0.1260 |
2. The current assets turnover ratio |
0.7568 |
1.6240 |
1.1447 |
1.2506 |
0.3673 |
0.7964 |
1.1214 |
1.3798 |
0.3364 |
3. The inventory turnover ratio |
1.7774 |
4.2365 |
5.5666 |
5.8739 |
1.5790 |
3.0356 |
4.8185 |
6.0796 |
1.5418 |
4. The receivable turnover accounts ratio |
2.3847 |
4.4394 |
7.5653 |
5.8754 |
1.4649 |
4.6816 |
7.2791 |
7.2975 |
2.1399 |
5. The equity capital turnover ratio |
0.2868 |
0.5744 |
0.8806 |
1.8655 |
0.4462 |
0.9029 |
1.5723 |
2.2832 |
0.4410 |
6. The payable turnover ratio |
1.5321 |
2.5713 |
3.5684 |
4.5488 |
1.3928 |
3.0195 |
3.0385 |
5.2285 |
1.4752 |
7. The duration of the production cycle |
88.4 |
41.5 |
28.1 |
30.6 |
118.4 |
48.9 |
31.0 |
27.1 |
100.4 |
8. The duration of the financial cycle |
29.6 |
6.5 |
2.8 |
10.9 |
53.8 |
19.1 |
1.4 |
9.9 |
39.4 |
Profitability performance profile (ROI) |
|||||||||
Return on equity |
|
|
|
|
|
|
|
|
|
1. Return on assets (ROA) |
-0.0282 |
0.0203 |
0.0268 |
-0.0806 |
0.0888 |
0.1347 |
0.1044 |
0.0917 |
0.0446 |
2. Return of equity (ROE) |
-0.0607 |
0.0408 |
0.0643 |
-0.3011 |
0.2578 |
0.3946 |
0.3627 |
0.3627 |
0.1561 |
3. Utilization efficiency of circulating assets |
-0.1601 |
0.1153 |
0.0835 |
-0.2019 |
0.2122 |
0.3480 |
0.2587 |
0.2192 |
0.1190 |
Profitability of sales |
|
|
|
|
|
|
|
|
|
4. Gross sales effectiveness |
0.1981 |
0.2175 |
0.2441 |
0.2673 |
0.3829 |
0.3496 |
0.3487 |
0.3354 |
0.2493 |
5. Sales operating performance |
0.0942 |
0.1460 |
0.2016 |
0.2269 |
0.2940 |
0.2169 |
0.2586 |
0.1863 |
0.1437 |
6. The net impact of sales |
-0.1729 |
0.2746 |
0.0503 |
-0.3696 |
0.5161 |
0.2160 |
-0.1146 |
-0.0486 |
0.2929 |
Source: compiled by the authors based on (Vorobyov and Blazhevich 2010; Dudin,et. al. 2016a)
------
Table 3. Recalculation of ratios into comparable values
Indicators |
2014 |
2015 |
2016 |
||||||
I Q |
II Q |
III Q |
IV Q |
I Q |
II Q |
III Q |
IV Q |
I Q |
|
The ratios of financial status |
|||||||||
1. The share of circulating assets in the property |
0.3524 |
0.3516 |
0.6410 |
0.7990 |
0.8365 |
0.7743 |
0.8071 |
0.8369 |
0.7489 |
2. The share of receivables in assets |
3.5762 |
3.1102 |
4.1241 |
2.3519 |
1.9071 |
3.0369 |
3.2169 |
2.5276 |
3.3977 |
3. The mobile assets ratio |
0.2139 |
0.2133 |
0.4717 |
0.6653 |
0.7190 |
0.6317 |
0.6766 |
0.7196 |
0.5986 |
4. The growth rate of business property |
0.9546 |
0.9673 |
1.1712 |
0.9794 |
0.9860 |
0.9314 |
1.0231 |
0.9949 |
0.9920 |
5. The growth rate of current assets |
0.9083 |
0.9769 |
2.1618 |
1.2359 |
1.0451 |
0.8728 |
1.0796 |
1.0444 |
0.8987 |
Cumulative index of the group |
6.0055 |
5.6193 |
8.5697 |
6.0315 |
5.4937 |
6.2472 |
6.8032 |
6.1235 |
6.6360 |
The ratios of liquidity and solvency |
|||||||||
1. Absolute liquidity ratio |
0.9972 |
0.7529 |
0.2050 |
0.2465 |
0.1720 |
0.3699 |
0.4139 |
0.4385 |
0.4703 |
2. The refined (intermediate) liquidity ratio |
0.8542 |
0.9178 |
0.4520 |
0.5522 |
0.3702 |
0.7969 |
0.9183 |
1.0000 |
1.0000 |
3. The current liquidity ratio |
1.0000 |
1.0000 |
0.9176 |
1.0000 |
0.6734 |
1.0000 |
1.0000 |
1.0000 |
0.9700 |
4. The solvency ratio |
0.1220 |
0.8351 |
2.3593 |
1.9480 |
3.9396 |
0.5589 |
0.1475 |
0.1262 |
-0.0599 |
Cumulative index of the group |
2.9735 |
3.5058 |
3.9339 |
3.7467 |
5.1553 |
2.7257 |
2.4797 |
2.5646 |
2.3804 |
The ratios of financial independence |
|||||||||
1. Equity to total assets |
0.9301 |
0.9939 |
0.8332 |
0.5357 |
0.6886 |
0.6830 |
0.5757 |
0.5058 |
0.5712 |
2. Financing ratio |
0.8693 |
0.9879 |
0.7141 |
0.3658 |
0.5251 |
0.5186 |
0.4042 |
0.3385 |
0.3998 |
3. Stable funding sources concentration ratio |
0.9811 |
1.0306 |
1.0035 |
0.9384 |
1.0108 |
0.8205 |
0.7343 |
0.7134 |
0.7223 |
Cumulative index of the group |
2.7805 |
3.0124 |
2.5508 |
1.8398 |
2.2245 |
2.0220 |
1.7142 |
1.5577 |
1.6933 |
The ratios of financial soundness |
|||||||||
1. The growth rate of invested working capital |
6.0000 |
4.9421 |
3.9235 |
1.1130 |
1.3877 |
0.2839 |
0.3354 |
0.8912 |
-0.4620 |
2. The collateralization ratio of current assets by invested capital |
0.2876 |
1.4728 |
2.7061 |
2.4671 |
3.3164 |
1.0921 |
0.3435 |
0.2967 |
-0.1544 |
3. The maneuverability of the working capital |
0.0505 |
0.2946 |
1.0444 |
0.9488 |
1.3863 |
0.3840 |
0.1360 |
0.1180 |
-0.0566 |
Cumulative index of the group |
6.3381 |
6.7095 |
7.6740 |
4.5289 |
6.0904 |
1.7600 |
0.8149 |
1.3059 |
-0.6730 |
The ratios of business activity |
|||||||||
1. The asset turnover ratio |
0.5334 |
1.1419 |
1.4675 |
1.9985 |
0.6145 |
1.2333 |
1.8102 |
2.3097 |
0.5038 |
2. The current assets turnover ratio |
1.5136 |
3.2480 |
2.2895 |
2.5013 |
0.7346 |
1.5927 |
2.2429 |
2.7597 |
0.6727 |
3. The inventory turnover ratio |
1.7774 |
4.2365 |
5.5666 |
5.8739 |
1.5790 |
3.0356 |
4.8185 |
6.0796 |
1.5418 |
4. The receivable turnover accounts ratio |
0.7949 |
1.4798 |
2.5218 |
1.9585 |
0.4883 |
1.5605 |
2.4264 |
2.4325 |
0.7133 |
5. The equity capital turnover ratio |
0.5735 |
1.1489 |
1.7613 |
3.7309 |
0.8924 |
1.8058 |
3.1445 |
4.5663 |
0.8820 |
6. The payable turnover ratio |
0.5107 |
0.8571 |
1.1895 |
1.5163 |
0.4643 |
1.0065 |
1.0128 |
1.7428 |
0.4917 |
7. The duration of the production cycle |
0.6789 |
1.4452 |
2.1379 |
1.9582 |
0.5066 |
1.2277 |
1.9329 |
2.2110 |
0.5974 |
8. The duration of the financial cycle |
1.5184 |
6.9064 |
15.8298 |
4.1457 |
0.8362 |
2.3602 |
31.6431 |
4.5348 |
1.1414 |
Cumulative index of the group |
7.9009 |
20.4637 |
32.7638 |
23.6832 |
6.1159 |
13.8222 |
49.0313 |
26.6364 |
6.5442 |
Profitability performance profile (ROI) |
|||||||||
Return on equity |
|
|
|
|
|
|
|
|
|
1. Return on assets (ROA) |
-1.6118 |
1.1581 |
1.5296 |
-4.6081 |
5.0728 |
7.6992 |
5.9661 |
5.2419 |
2.5472 |
2. Return of equity (ROE) |
-2.4262 |
1.6313 |
2.5701 |
-12.0437 |
10.3135 |
15.7824 |
14.5087 |
14.5085 |
6.2428 |
3. Utilization efficiency of circulating assets |
-6.4028 |
4.6118 |
3.3409 |
-8.0744 |
8.4895 |
13.9204 |
10.3487 |
8.7683 |
4.7615 |
Profitability of sales |
|
|
|
|
|
|
|
|
|
4. Gross sales effectiveness |
0.9906 |
1.0874 |
1.2203 |
1.3365 |
1.9146 |
1.7479 |
1.7436 |
1.6769 |
1.2467 |
5. Sales operating performance |
0.9422 |
1.4601 |
2.0159 |
2.2687 |
2.9395 |
2.1691 |
2.5860 |
1.8630 |
1.4375 |
6. The net impact of sales |
-3.4587 |
5.4920 |
1.0069 |
-7.3916 |
10.3216 |
4.3199 |
-2.2913 |
-0.9720 |
5.8583 |
Cumulative index of the group |
-11.9668 |
15.4409 |
11.6837 |
-28.5125 |
39.0516 |
45.6389 |
32.8618 |
31.0864 |
22.0939 |
Source: compiled by the authors
Table 4. The calculation of the integrated index of economic security of PAO Severstal
Name of indicator |
2014 |
2015 |
2016 |
Statutory value |
||||||
I Q |
II Q |
III Q |
IV Q |
I Q |
II Q |
III Q |
IV Q |
I Q |
||
Cumulative index of financial status |
6.0055 |
5.6193 |
8.5697 |
6.0315 |
5.4937 |
6.2472 |
6.8032 |
6.1235 |
6.6360 |
5 |
Cumulative index of liquidity and solvency |
2.9735 |
3.5058 |
3.9339 |
3.7467 |
5.1553 |
2.7257 |
2.4797 |
2.5646 |
2.3804 |
4 |
Cumulative index of financial soundness |
6.3381 |
6.7095 |
7.6740 |
4.5289 |
6.0904 |
1.7600 |
0.8149 |
1.3059 |
-0.6730 |
3 |
Cumulative index of financial independence |
2.7805 |
3.0124 |
2.5508 |
1.8398 |
2.2245 |
2.0220 |
1.7142 |
1.5577 |
1.6933 |
3 |
Cumulative index of business activity |
7.9009 |
20.4637 |
32.7638 |
23.6832 |
6.1159 |
13.8222 |
49.0313 |
26.6364 |
6.5442 |
8 |
Cumulative index of profitability |
-11.9668 |
15.4409 |
11.6837 |
-28.5125 |
39.0516 |
45.6389 |
32.8618 |
31.0864 |
22.0939 |
6 |
Integrated indicator of economic security |
14.0317 |
54.7517 |
67.1759 |
11.3177 |
64.1313 |
72.2159 |
93.7051 |
69.2747 |
38.6749 |
29 |
Source: calculated by the authors
The statutory value of the cumulative index of business activity is 8. This group includes the largest number of indicators. Fluctuations in cumulative index of business activity are quite significant: from 6.5442 in the I quarter of 2016 to 49.0313 in the III quarter of 2015. The cumulative indicator of business activity is influenced most largely by inventory turnover ratio and the duration of the financial cycle. A high level of the latter indicator evidences financial literacy of PAO Severstal top management.
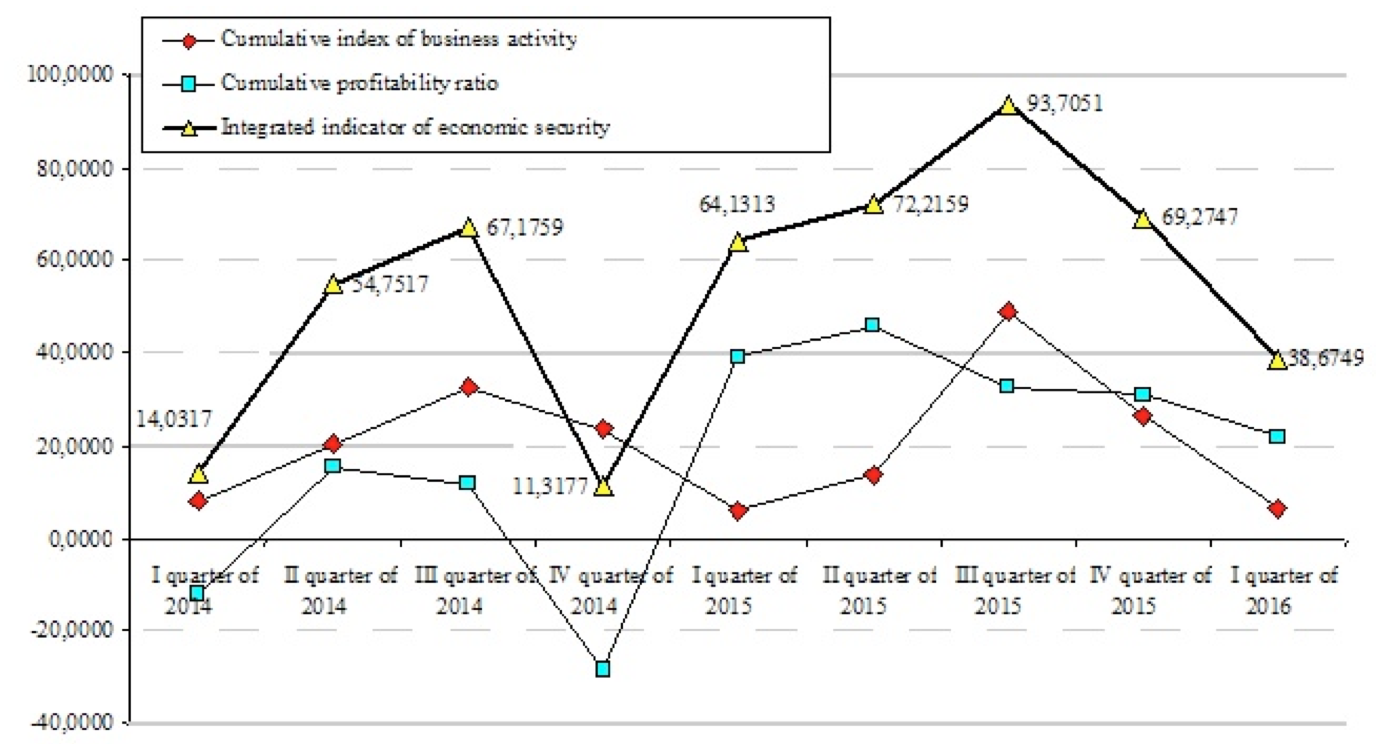
The statutory value of the cumulative profitability ratio is equal to 6. This indicator has the strongest fluctuations among all calculated ones that depend on the received financial result. It should be noted that in the I and IV quarters of 2015, the analyzed enterprise has incurred losses. This led to the fact that in the reporting periods, the cumulative profitability ratio was negative.
The statutory value of the integrated indicator of economic security is 29, based on the number of coefficients included in all groups that affect the economic security of PAO Severstal. The integrated indicator of economic security is influenced most strongly by the cumulative profitability ratio, and indicates that the level of economic security at the enterprise in general is quite satisfactory. Although, losses incurred in the I and IV quarters of 2015, have led to the fact that in these periods integrated indicator of economic security was below the permissible level.
In general we can note that the integrated indicator of economic security at PAO Severstal depends to a greater extent on the cumulative index of business activity and profitability ratio that is clearly shown in Fig. 1.
Source: compiled by the authors (The official website of the Public Joint Stock Company "Severstal)
Fig. 1. The dynamics of the integrated indicator of economic security and its components at PAO Severstal in 2014-2016.
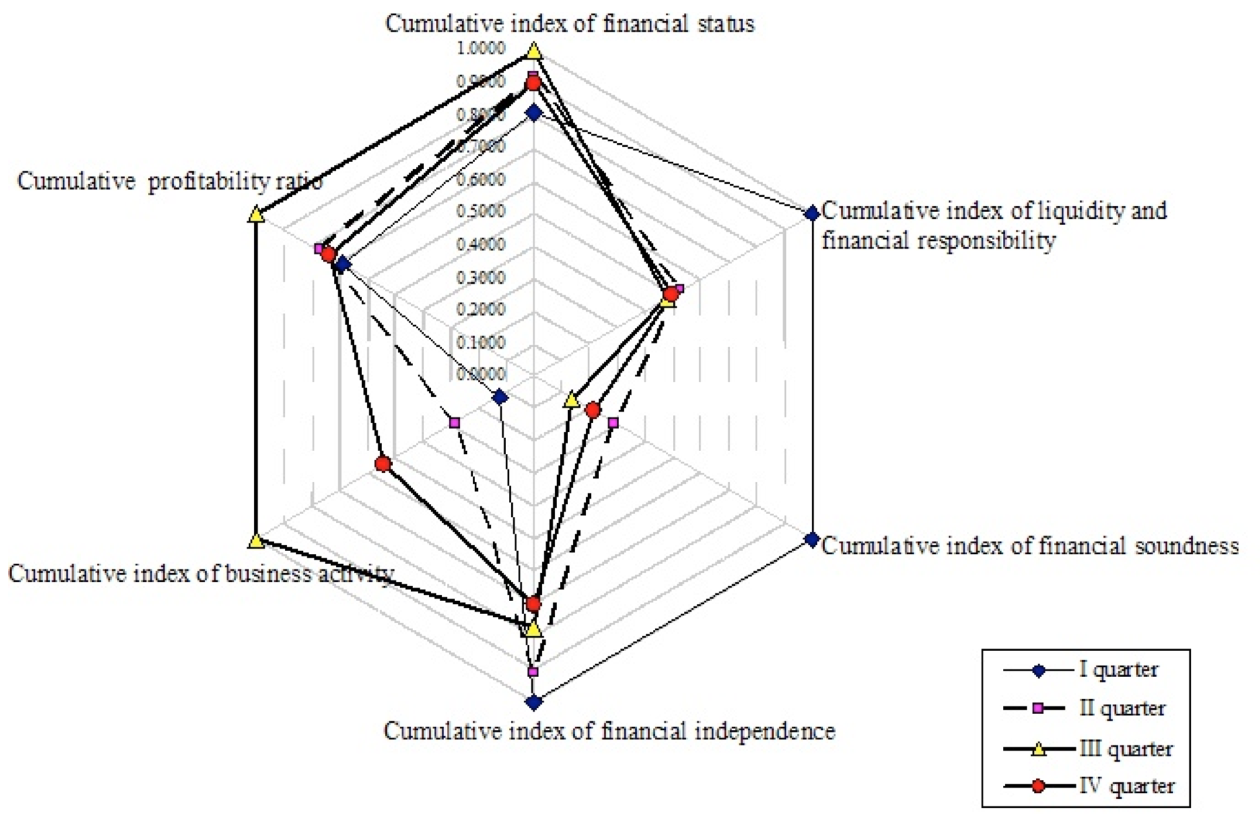
There are various methods of graphical representation of the economic security level at the enterprise. One of these methods is a polygon of economic security. Though, it is not reasonable to construct such polygon based on complete set of data since it will be unreadable. Besides, there are several conditions that must be followed: all the data must be reduced to values varying within the range of 0-1 and having the same sign.
Construct the polygon of economic security based on data of 2015. To do this, we should choose the largest value among all cumulative indicators for 2015 (for each line separately) and then each of them divide by chosen maximum value. The values obtained are given in Table 5.
Table 5. The source data for constructing the polygon of economic security
Name of cumulative indicator |
I Q 2015 |
II Q 2015 |
III Q 2015 |
IV Q 2015 |
Сumulative index of financial status |
0.8075 |
0.9183 |
1.0000 |
0.9001 |
Сumulative index of liquidity and financial responsibility |
1.0000 |
0.5287 |
0.4810 |
0.4975 |
Сumulative index of financial soundness |
1.0000 |
0.2890 |
0.1338 |
0.2144 |
Сumulative index of financial independence |
1.0000 |
0.9090 |
0.7706 |
0.7003 |
Сumulative index of business activity |
0.1247 |
0.2819 |
1.0000 |
0.5433 |
Сumulative profitability ratio |
0.6844 |
0.7707 |
1.0000 |
0.7393 |
Source: compiled by the authors
Figure 2 shows the constructed polygon of economic security.
Source: constructed by the authors
Fig. 2. Graphical representation of the economic security level at PAO Severstal in 2015.
In Fig. 2 we can determine visually that the highest level of economic security of the enterprise was observed in the first and third quarters of 2015.
To determine the accuracy of the result we calculate the area of a financial security polygon for each year according to the formula:
![]()
where S – is the area of a polygon of a particular enterprise; n – is the number of cumulative induces, k – is the cumulative induces for groups (Burkaltseva 2012).
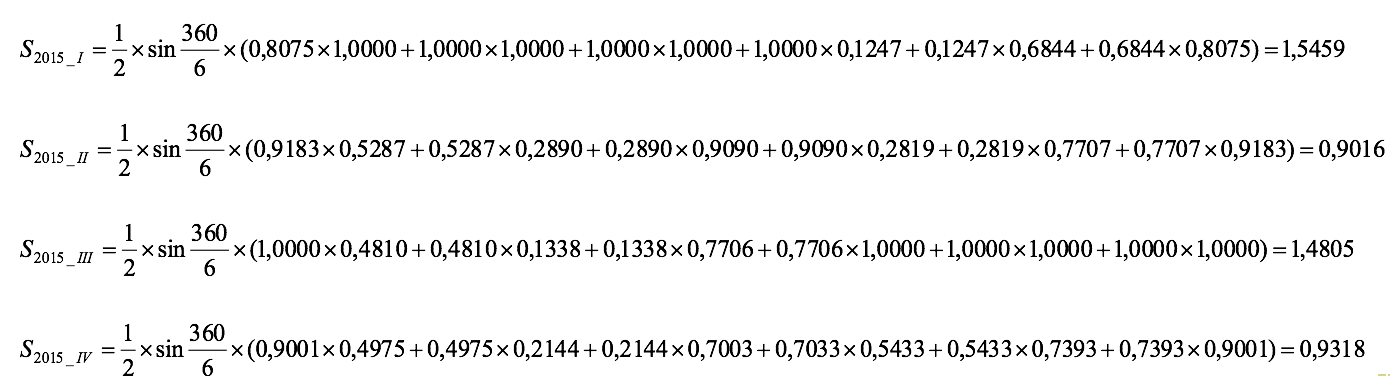
The calculated areas showed that the best level of economic security was received in the first quarter of 2015, while slightly lower value corresponds to the third quarter of 2015. The disadvantage of this method is that it does not take into account statutory values, i.e. we can identify the best and worst levels, while cannot compare them with the statutory value.
We can slightly upgrade the integrated indicator of economic security, providing each cumulative index with weighting coefficient. We get the following formula:
![]()
where p1 – pn – are the significances of cumulative indices;
k1 – kn – are the cumulative indices of the groups.
In our opinion, the following weighting coefficients should be assigned to groups of cumulative indicators characterizing the level of economic security:
The weighting coefficients depend on the quality and quantity of groups of factors involved in the calculation. In this case, the statutory value of the integral index of economic security will be 5.75 (5 ´ 0.05 + 4 ´ 0.15 + 3 ´ 0.15 + 3 ´ 0.05 + 8 ´ 0.35 + 6 ´ 0.25).
Calculate the integrated indicator of economic security taking into account the weighting coefficients of the cumulative indices:
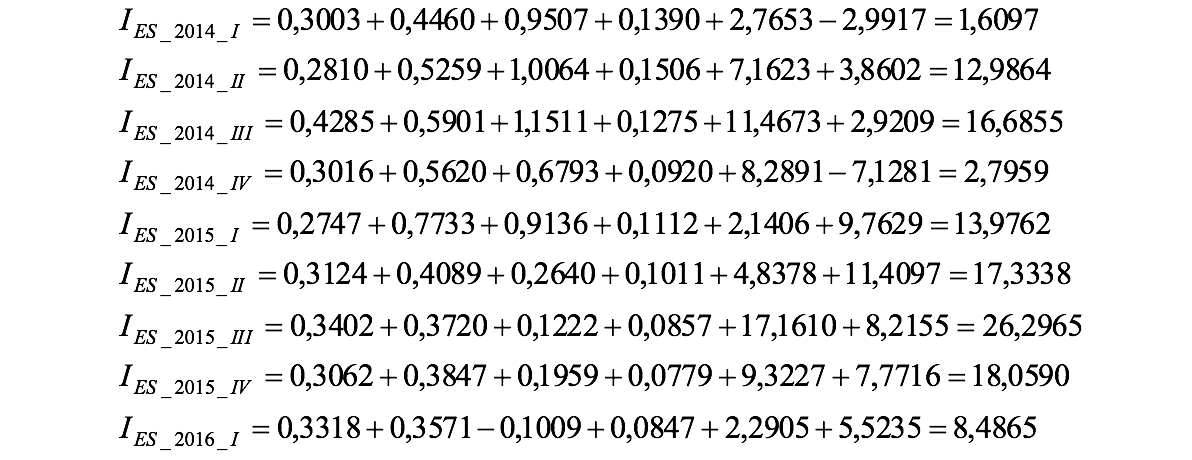
Table 6 presents a comparison of calculations of the integrated indicator of economic security with and without use of weighting coefficients.
Table 6. The comparison of the integrated indicator of economic
security calculated with and without use of weighting coefficients
Periods |
Calculation methods |
|||
Integrated indicator of economic security without the use of weighting coefficient |
Integrated indicator of economic security using weighting coefficient |
|||
points |
rank |
points |
rank |
|
IES_2014_I |
14.0317 |
8 |
1.6097 |
9 |
IES_2014_II |
54.7517 |
6 |
12.9864 |
6 |
IES_2014_III |
67.1759 |
4 |
16.6855 |
4 |
IES_2014_IV |
11.3177 |
9 |
2.7959 |
8 |
IES_2015_I |
64.1313 |
5 |
13.9762 |
5 |
IES_2015_II |
72.2159 |
2 |
17.3338 |
3 |
IES_2015_III |
93.7051 |
1 |
26.2965 |
1 |
IES_2015_IV |
69.2747 |
3 |
18.0590 |
2 |
IES_2016_I |
38.6749 |
7 |
8.4865 |
7 |
Source: compiled by the authors
Table 6 shows that the weighting coefficients do not have a significant effect on the calculation of integrated indicator of economic security. The best values indicator were defined for the III, II and IV quarters of 2015 without taking into account the weighting coefficients of cumulative indicators, and for III, IV and II quarters of 2015 – with the use of weighting coefficients. The worst level of economic security was noted in the I and IV quarters without taking into account the weighting coefficient. While, if used, these quarters swap places. Comparing them with statutory values, we see that the obtained data are below the statutory values of the integrated indicator of economic security, no matter whether weighting coefficients were used or not.
The calculation of the integrated indicator of economic security of PAO Severstal has shown that the weighting coefficients do not have significant effect on the integrated indicator of economic security. Its best values were defined for the III, II and IV quarters of 2015 without taking into account the weighting coefficients of cumulative indicators, and for III, IV and II quarters of 2015 – while using weighting coefficients. The worst level of economic security was noted in the I and IV quarters without taking into account the weighting coefficient. While, if used, these quarters swap places. Comparing them with statutory values, we see that the obtained data are below the statutory values of the integrated indicator of economic security, no matter whether weighting coefficients were used or not.
This article outlines the basis of formation of socio-economic indicators system providing economic security of a business through application in the future of neural networks as the primary element of economic system to create investment platforms, develop and support the next generation system for regulation of production. This is done by systematizing indicators, using cognitive technologies and decomposition of the factor space, justifying the fundamental factors in real time with due account for the effect of integration, globalization and modern challenges that create a new round of risks, threats, and hazards, poorly understood to date.
Further research should be directed at improving the model to identify the class of business economic security based on the hybrid fuzzy neural networks, which will allow obtaining a more precise assessments of economic security class in the current and future periods, accurately and flexibly respond to the features of the new data based on generalization techniques.
This article is prepared in the framework of the grant of the Russian State Scientific Fund, registration No. NIOKTR AAAA-A16-116040410178-5 of 04/04/2016.
We thank colleagues, who not being the authors of the present article, contributed to this research.
A set of guidelines for socio-economic cost benefit analysis of transport infrastructure project appraisal. (2003). New York, pp. 61.
Azoulay, G., 2010, Globalisation des echanges et securite alimentaire mondiale a l'horizon 2010. Rev. tiers monde. P., 39(153), 25-43
Baranovsky, O.I. (2000). Fіnansova bezpeka v Ukraїnі (metodologіya ocіnki ta mekhanіzmi zabezpechennya [Financial security in Ukraine (methodology and evaluation mechanisms pro-BAKING)]. Ph.D. thesis. Kyiv: Institute of Economics and Forecasting of NAS of Ukraine, pp. 36.
Blazhevich, O.G. (2010). Finansovaya bezopasnost' predpriyatij: opredelenie minimal'no neobhodimogo urovnya [Financial security of companies: the definition of the minimum required level]. Scientific Bulletin: Finance, Banking, Investment, 3(8), 25-31.
Blank, I.A. (2004). Upravlenie finansovoj bezopasnost'yu predpriyatiya [Financial enterprise security management]. Kyiv: Elga, Nika-Tsentr, pp. 784.
Borsch L., Burkaltseva D., Vorobyov Yu., Vorobyeva E. And Chepurko V. (2016) The dichotomy of opposites and the unity of the market and capitalism: the forecast and plan (Part 1). International Journal of Economic Research, 13(8), 3413-3425
Breidinger, C. (2006). Modeling infrastructure investments, growth and poverty impact. New York: Routledge, pp. 174.
Brown, A., (n. d). Handbook for evaluating infrastructure regulatory systems. Washington: World Bank, pp. 397.
Burkaltseva, D.D. (2012). Іnstitucіonal'ne zabezpechennya ekonomіchnoї bezpeki Ukraїni [Institutional economic security of Ukraine]. Kiev, Ukraine: Znanye, pp. 347.
Borsch L., Burkaltseva D., Vorobyov Yu., Vorobyeva E. And Chepurko V. (2016a) The dichotomy of opposites and the unity of the market and capitalism: the forecast and plan (Part 2). International Journal of Economic Research, 13(8), 3427-3339
Burkaltseva, D.D., Vorobyov, Yu.N., Borsch, L.M., Gerasimova, S.V., and Chepurko, V.V. (2016). Structural modeling the system of ensuring the economic security of the complex territorial socio-economic system of the EuraSec. IJABER, 14(9), 5683-5704.
Burkaltseva, D.D., Blazhevich, O.G., and Cherednichenko, M.S. (2016a). Ocenka finansovoj ustojchivosti biznesa: teoreticheskie aspekty [Business valuation of financial stability: the theoretical aspects]. Science Time, 5(29), 96-102.
D’Agostino, D. (2008). Defence critical infrastructure: risk analysis of critical infrastructure omits highly sensitive assets. Wash., US Gout Accountability Office. The Economist, pp. 60.
Dudin, M.N., Frolova, E.E., Artemieva, Ju.A., Ivanovskaya, N.V., and Sitkareva, E.V. (2016). Transfer of innovation technologies as a factor of the world nuclear power industry development, IJABER, 14(9), 5723-5736. Retrieved 05 September 2016 from http://serialsjournals.com/serialjournalmanager/pdf/1473070039.pdf
Dudin, M.N., Kucuri, G.N., Fedorova, I.Ju., Dzusova, S.S., and Namitulina,A.Z. (2015). The innovative business model canvas in the system of effective budgeting. Asian Social Science, 11(7), 290-296.
Dudin, M.N., Prokof'ev, M.N., Fedorova, I.J., and Frygin, A.V. (2014). The world experience of transformation of innovative approaches to assurance of financial stability of social economic systems. Life Science Journal. 11(9), 370-373.
Dudin, M.N., Voykova, N.A., Frolova E..E, Artemieva, Ye.A., Rusakova, E.P., and Abashidze, A.H. (2016a). Modern trends and challenges in development of global aluminum industry. METALURGIJA, 56(1-2), 255-258.
Friest, T. (2007). Network science, nonlinear science and infrastructure systems. New York: Springer, pp. 361.
Goryacheva, K.S., 2006, Mekhanіzm upravlіnnya fіnansovoyu bezpekoyu pіdpriєmstva [Mechanism of company financial security]. Ph.D. thesis. Kiev: Ukraine Institute of Economics and Forecasting of NAS, pp. 20.
Gukova, A.V., and Anikin I.D. (2006). Rol' finansovoj bezopasnosti predpriyatiya v sisteme ego bezopasnosti [The role of financial security of the company in its security system]. Education and Society, 3, 98-102.
Kunitsyn, A.V. (1998). Vostok-Zapad: import tekhnologii i ehkonomicheskaya bezopasnost' [East-West: technology import and economic security]. Moscow: Economy, pp. 280.
Mikhalkin, V.A. (1990). EHkonomicheskaya bezopasnost' SSSR [The economic security of the USSR]. Moscow: Knowledge, pp. 280.
Murray, A., and Grybeste, T. (2007). Critical infrastructure: reliability vulnerability. Berlin: Springer-Verlag, pp. 311.
Oleynikov, E.A. (2005). EHkonomicheskaya i nacional'naya bezopasnost' [Economic and national security]. Moscow: Exam, pp. 768.
Oleynikov, E.A., Filin, S.A. and Vidyapin, V.I., et al. (2005). EHkonomicheskaya i nacional'naya bezopasnost' [Economic and national security]. Moscow: Examination, pp. 768.
Osnovnye sostavlyayushchie i napravleniya obespecheniya ehkonomicheskoj bezopasnosti predpriyatiya [The main components and the direction to ensure the economic security of the enterprise]. Retrieved 20 May 2016 from http://www.itspecial.ru/osnovnye_sostavljyushie_i_napravlenij_obespechenij.html
Papekhin, R.S. (2007). Indikatory finansovoj bezopasnosti predpriyatiya [Indicators of financial security of the enterprise]. Volgograd, Volgograd Scientific Publishing House, pp. 16.
Pogosova, M., and Lebedev, V. (2014). Analіz metodichnogo zabezpechennya ocіnyuvannya fіnansovoї bezpeki pіdpriєmstva [Analysis of methodological support assessment of the enterprise's financial safety]. Economic Science, рр. 35.
Romadina, L.N. (2008). Ekonomicheskaya bezopasnost': razvitie nauchnyh predstavlenij [Economic security: the development of scientific concepts]. Bulletin of St. Petersburg State University, 5(4), 161-164.
Sutnata, D., and Byrd S. (2007). Computational models of risks to infrastructure. Amsterdam, pp. 329.
Sullivaut, S. (2007). Strategies for protecting national critical infrastructure assets: a focus on problem solving. Hoboken. N.S., pp. 607.
The official website of the Public Joint Stock Company "Severstal". Retrieved 20 May 2016 from www.severstal.com/rus/ir/results_reports/finreps_rsbu/
Vechkanov, G.S., 2007. EHkonomicheskaya bezopasnost' [Economic security]. St. Petersburg: "Piter" Publishing House, pp. 384.
Vivchenko, E.M. (2013). Modelirovanie ehkonomicheskoj bezopasnosti predpriyatiya na primere OAO “Rovnegaz [Simulation of economic security of the enterprise in the context of “Rovnegaz”]. Retrieved 20 May 2016 from http://naub.oa.edu.ua/2013/modelyuvannya-ekonomichnoji-bezpeky-pidpryjemstva-na-prykladi-pat-rivnehaz/
Vorobyov, Y.M., and Blazhevich, O.G. (2010). Finansovaya bezopasnost' organizacij rekreacionnoj sfery [Financial security organizations in recreational sphere]. Scientific Bulletin: Finance, Banking, Investment, 2(7), 12-19.
Vorobyov, Y.M., Vorobyov, E.I., and Blazhevich, O.G. (2013). Fіnansova bezpeka budіvel'nih pіdpriєmstv [Financial security of building enterprises]. Simferopol: VD "ARІAL", pp. 180.
Yakunin, V.I., Bagdasaryan, V.E., and Sulakshin S.S. (2008). Ideologiya ehkonomicheskoj politiki [The ideology of economic policy]. Moscow: Scientific expert, pp. 288.
1. V.I. Vernadsky Crimean Federal University, 295007, Russia, Republic of Crimea, Simferopol, Vernadsky Avenue, 4. Email:di_a@mail.ru
2. V.I. Vernadsky Crimean Federal University, 295007, Russia, Republic of Crimea, Simferopol, Vernadsky Avenue, 4
3. V.I. Vernadsky Crimean Federal University, 295007, Russia, Republic of Crimea, Simferopol, Vernadsky Avenue, 4
4. Far Eastern Federal University, 690950, Russia, Vladivostok, Suhanova Str., 8
5. Pеоples Friendship University of Russia (RUDN University), 117198, Russia, Moscow, Miklouho-Maclay Str., 6