![]() ISSN 0798 1015
ISSN 0798 1015

![]() ISSN 0798 1015
ISSN 0798 1015
Vol. 38 (Nº 27) Año 2017. Pág. 2
Bruno Cesar Silva ROCHA 1; Mônica de Aquino Galeano Massera da HORA 2; José Rodrigo de MORAES 3
Recibido: 16/12/16 • Aprobado: 23/01/2017
4. Conclusions and recommendations
ABSTRACT: The Mataruna River is the main tributary to the lagoon system and its water is used for livestock supply, crop irrigation and, especially, dilution of sewage. Since no water-quality data on the Mataruna River are available, the present study sought to fill this gap through conducting sample collection campaigns and analyzing the physical, chemical and biological properties of the samples over a six-month period. The results showed that the river water had high concentrations of organic material, nutrients and coliforms, and that discharge of domestic sewage was the main source of pollution. |
RESUMO: O rio Mataruna é o seu principal tributário contribuinte e as suas águas são utilizadas para dessedentação de animais, irrigação de lavouras e, principalmente, para diluição de despejos. Em virtude da ausência de dados sobre a qualidade da água do rio Mataruna, buscou-se preencher esta lacuna através da realização de campanhas de coletas, bem como a análise das propriedades físico-químicas e biológicas das amostras por um período de seis meses. Os resultados mostraram que a água do rio encontra-se com altas concentrações de matéria orgânica, nutrientes e coliformes, sendo o lançamento de esgotos domésticos é a principal fonte de poluição. |

Water is essential for economic development and for life on this planet. It is a target of constant concern in various segments of society because of compromised quality and shortage. As its usages have diversified, the negative impacts caused by anthropic activities have been causing great damage to hydrographic basins, thus threatening water resources, affecting water quality for human consumption through contamination, and causing shortages in certain areas (TUNDISI, 2006).
In a hydrographic basin, land use and occupation determine the surface drainage of rainwater and the production of sediments in the basin. According to MACEDO, MELLO, MARCELLINI & PEDROTTI (2012), lack of planning of the use of natural resources and poor decisions regarding soil management can damage the environment. The outcomes from these actions result in losses for populations that use water for their survival, thereby leading to public health problems.
The Araruama Lagoon, located in the so-called Lakes Region of the state of Rio de Janeiro, has been the subject of studies and actions by the state government to deal with environmental issues, because it has been experiencing degradation of its ecosystem due to the lack of a basic sanitation system and improper the land use, for more than three decades (PRIMO & BIZERRIL, 2002). The interest in studying the Mataruna River comes from the fact that it is the main tributary to the Araruama Lagoon. Its watershed is entirely located within the municipality of Araruama. Its waters are used for livestock watering, irrigation of small crops and, especially, for diluting sewage, because of the precarious infrastructure for sewage collection and treatment. Despite the history of sewage discharge in the Araruama Lagoon, no data on the water quality of its main tributaries have yet been produced.
The present study sought to fill this gap with the aim of contributing towards a more accurate understanding of the influence of anthropic occupation in the basin of the Mataruna River, in order to contribute towards better planning of water resource recovery and management actions. In order to reach this objective, field trips, sampling campaigns, laboratory analyses and water quality diagnoses were performed through comparison of the results with the limiting conditions for the water usage classes established through CONAMA Resolution No. 357/2005, of March 18, and, regarding water quality, with the standards defined through CONAMA Resolution No. 274/2000, of November 29.
According to PRIMO AND BIZERRIL (2002), the Araruama Lagoon is the largest permanent hypersaline lagoon in the world. Several waterways flow into it and, among them, the main tributary is the Mataruna River. This river is 1.5 km long, beginning at the junction of the Limão and Buraco do Pau Rivers, and its sub-basin is located entirely within the municipality of Araruama. At its mouth, the Mataruna River appears to have a higher volume of water than it really does, because in this area it is 36 m wide, although the waters found in it are from the Araruama Lagoon, which advance through the river several kilometers upstream, thus making them salty and brackish.
Regarding the basic sanitation system, in the municipality of Araruama, a portion of the water collected from the Mataruna River is destined for the Ponte dos Leites Sewage Treatment Station (STS), which is located close next to the river mouth. The water collection system consists of an underwater dam built in the riverbed for use during the dry season. The Ponte dos Leites STS uses a system of stabilization ponds, followed by a facultative pond and a maturation pond. It was inherited from the Araruama City Hall and was inaugurated in 2005. An expansion program relating to both treatment and capacity levels was completed in February 2009 (ÁGUAS DE JUTURNAÍBA, 2015).
Because knowledge of the area to be studied is a relevant factor in monitoring and evaluating the water quality of the Mataruna River, field trips for mapping and gathering information on the main characteristics and dynamics of the main waterway and its tributaries were conducted. Next, sampling points were selected and campaigns took place on December 19, 2014, January 30, 2015, March 5 and 27, 2015 and May 7 and 29, 2015. Locations that were representative of the different stretches of the Mataruna River were selected, as shown in Table 1, under the following conditions:
Table 1. Locations of the sampling stations.
Location |
Latitude |
Longitude |
Distance from the mouth (km) |
Downstream 1 |
22° 52' 37.28" S |
42° 20' 17.67" W |
0 |
Downstream 2 |
22° 52' 19.85" S |
42° 20' 20.71" W |
0.60 |
Confluence |
22° 51' 53.66" S |
42° 20' 12.94" W |
1.81 |
Upstream |
22° 50' 18.58" S |
42° 20' 45.99" W |
5.41 |
Physical-chemical and biological analyses were performed by the Bioagri Laboratory, which has certification from the State Environmental Institute (INEA). Table 2 summarizes the instruments used, along with the methodology used in the analyses.
Table 2. Methodology and instruments used in laboratorial analyses.
Parameter |
Instrument/Make/Model |
Analysis methodology |
Biochemical oxygen demand |
Digester / Hach / DRB 200 |
APHA (2012): Method 5210 B |
Spectrophotometer / Hach / DR 3900 |
||
E. coli |
Incubator / Tecnal / TE 391 |
APHA (2012): Method 9223 A and B |
Total phosphorus |
Spectrophotometer / Hach / DR 3900 |
APHA (2012): Method 4500 P E |
Ammoniacal nitrogen |
Spectrophotometer / Hach / DR 3900 |
SOP* 107 - Rev. 05 |
Dissolved oxygen |
Multiparameter probe / ISY / Professional Plus |
APHA (2012): Method 4500O G |
Potential of hydrogen |
Multiparameter probe / ISY / Professional Plus |
APHA (2012): Method 4500H+ B |
Salinity |
Multiparameter probe / ISY / Professional Plus |
APHA (2012): Method 2520 B |
Total solids |
Air recirculation stove / Visomes / MD 111-2 |
APHA (2012): Method 2540 A, B, C, D, E |
Analytical scale / Bell Mark / 202A |
*SOP: standard operating procedure of the Bioagri Laboratory.
It needs to be highlighted that that the Mataruna River did not fit into any usage class. is important to be highlighted and considering that the sampling was performed at the points Downstream 1 and Downstream 2, both near the river mouth and therefore subject to saltwater influence, the water quality variables were analyzed in accordance with to the standards and conditions defined through article 42 of CONAMA Resolution No. 357/2005, of March 18, which established class II for freshwater and class I for saltwater and brackish water. In addition, the water quality relating to bathing conditions was also evaluated through the limits established by CONAMA Resolution No. 274/2000, of November 29. Dispersion plots were elaborated according to the sampling dates.
Regarding the statistical analyses, the significance test adopted was based on Spearman’s correlation coefficient, which is a nonparametric association measurement. It was used to identify the direction and degree of association between pairs of parameters measured at each sampling point in the Mataruna River. Additionally, each parameter was compared between the sampling stations (Upstream, Confluence, Downstream 1 and Downstream 2) using the nonparametric Kruskal-Wallis test, followed by Dunn’s multiple comparison test, when the first test was significant (SIEGAL & CASTELLAN, 2006). All the statistical tests were performed using SPSS (Statistical Package for the Social Sciences), version 20.0, taking the significance level to be 5%, as suggested in the studies of ALVES et al. (2008) and MINELLA, MERTEN & CLARKE (2009).
CONAMA Resolution No. 357/2005 of March 18 defined freshwater as water with salinity less than or equal to 0.5‰; brackish water with salinity between 0.5‰ and 30‰; and saltwater with salinity greater than or equal to 30‰. Figure 1 presents the salinity results from the water of the Mataruna River for the sampling points.
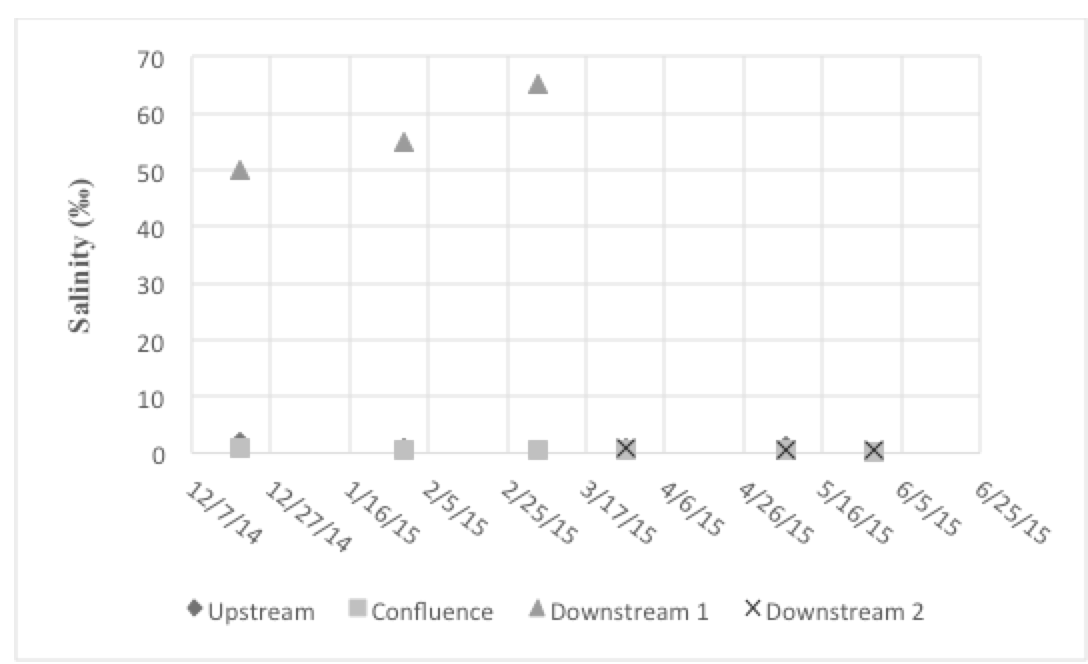
Figure 1. Evolution of salinity over time.
From the sampling results at the Upstream and Confluence points, the water was characterized as fresh and brackish. In samples characterized as freshwater, the lowest salinity value was 0.21 ppm and the highest value was 0.47 ppm. In samples classified as brackish water, the lowest value was 0.55 ppm and the highest, 1.86 ppm. In turn, the water from the Downstream 1 point, which was located close to the mouth of the Mataruna River and was therefore within the zone of saline influence, was characterized as saltwater. At the Downstream 2 point, on the days March 27, 2015, and May 29, 2015, the water was characterized as brackish. From overall analysis on the results, it can be inferred that the Araruama Lagoon has a strong influence on the mouth of the Mataruna River.
The pH value is decisive in relation to the bioavailability of certain substances, especially metals (Companhia de Tecnologia de Saneamento Ambiental [CETESB], 2009). Unless pH values are extremely high or low, they have no implications in terms of public health (Von Sperling, 2014). Figure 2 shows the results from the samples and their variation over the sampling period.
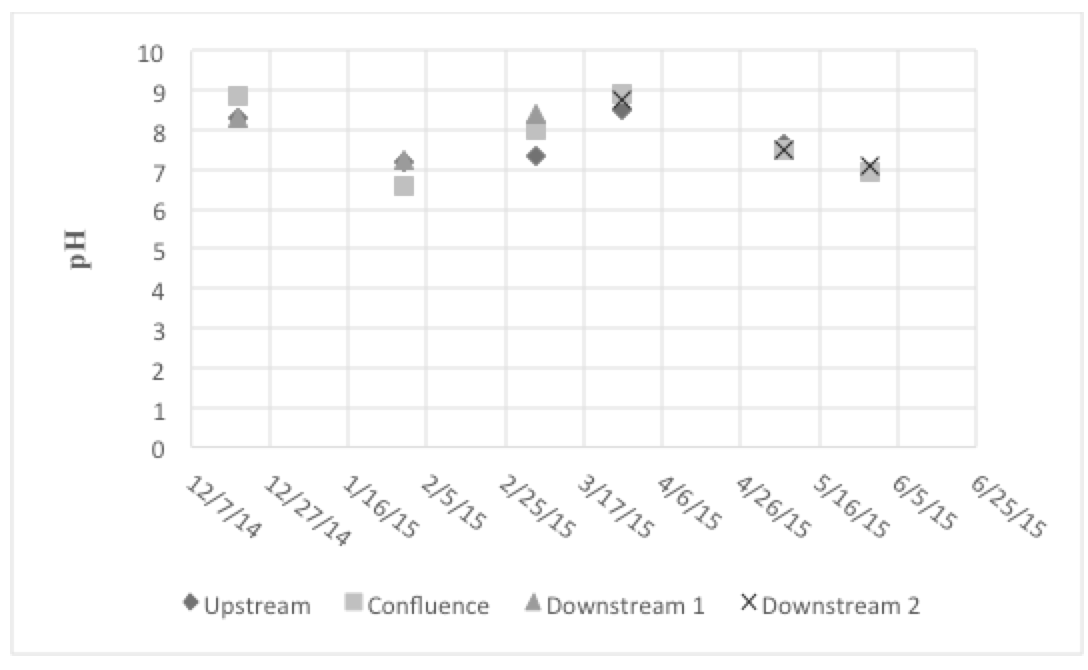
Figure 2. Evolution of pH over the course of time.
As established through CONAMA Resolution No. 357/2005, for freshwater, pH should range between 6 and 9. For brackish and saltwater, pH should range between 6.5 and 8.5. Except for the days December 19, 2014, and March 27, 2015, the results found were within the ranges established. Because these values were close to the category limits, with percentage differences below 5%, they allow the inference that pH does not present any risk in relation to public health.
Solids can retain bacteria and organic residues at the bottom of rivers, thus promoting anaerobic decomposition (CETESB, 2009). In addition, solid deposition at the bottom of water bodies can cause silting, which creates problems for navigation and operation of reservoirs and increases the risk of floods due to the reduction of the river channel depth (BUZELLI & CUNHA-SANTINO, 2013). Figure 3 illustrates the variation of the concentration of total solids over the sampling period.
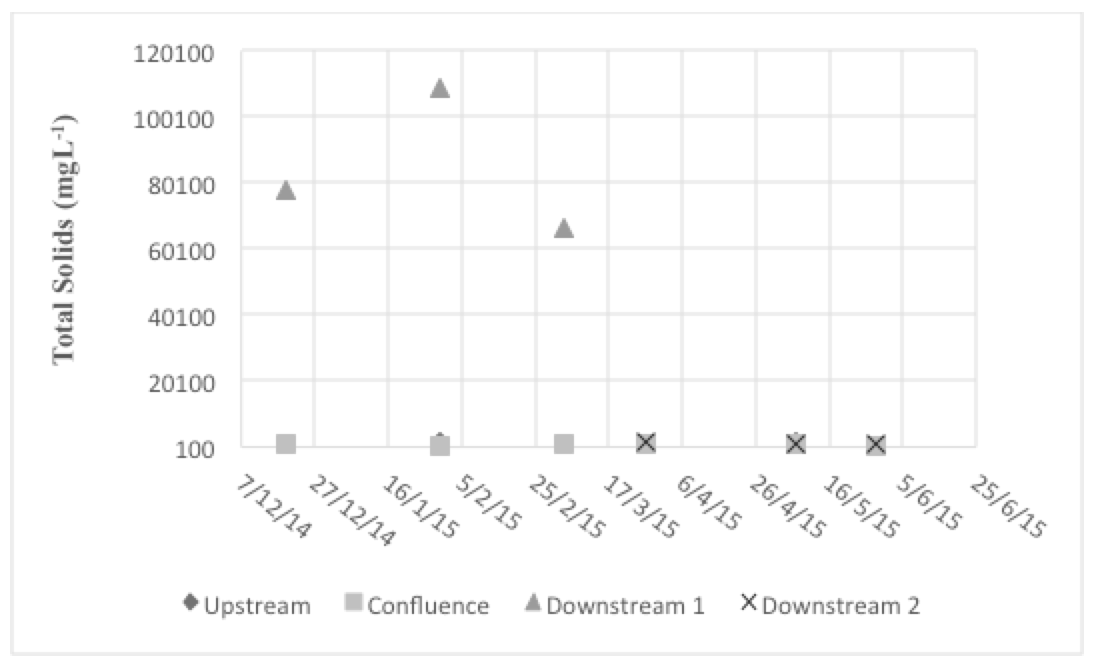
Figure 3. Evolution of the concentration of total solids over time.
The results show that, apart from the measurements at the Upstream station on May 29, 2015, all the other values exceeded the limit for the freshwater standard (class II). Regarding brackish water and saltwater, CONAMA Resolution No. 357/2005 does not determine standard values.
In accordance with the Brazilian federal law currently in force, ammoniacal nitrogen is a classification standard for natural waters and emission standard for sewage. The concentration of ammoniacal nitrogen is an important classification parameter for natural waters and is usually used in constructing water quality indexes (CETESB, 2009). Figure 4 presents the variation of ammoniacal nitrogen levels over the sampling period.
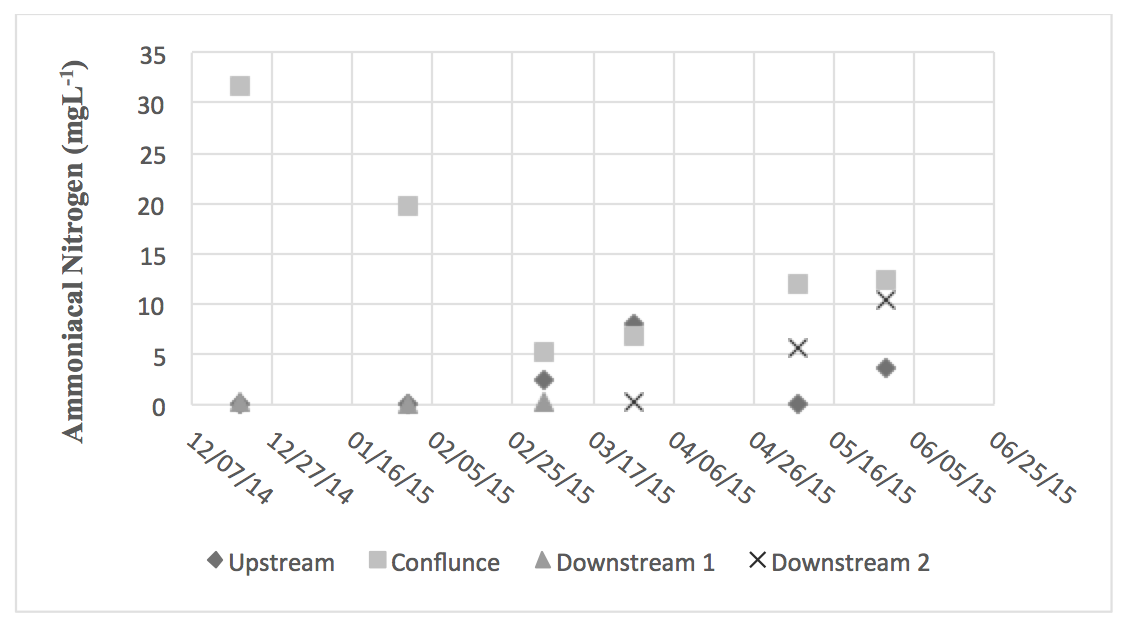
Figure 4. Evolution of ammoniacal nitrogen concentration over time.
At the point Downstream 1, the lowest value was 0.1 mgL-1 (on January 30, 2015) and the highest was 0.37 mgL-1 (on December 19, 2014). The analysis on the results showed that close to the river mouth, there was no violation of the standard limit, because all the values were below 0.4 mgL-1. For brackish water, the minimum and maximum values were, respectively, below 0.1 mgL-1 in the upstream stretch (on December 19, 2014 and on May 7, 2015) and 31.6 mgL-1 in the confluence stretch (on December 19, 2014). The results indicate that over 60% of the samples violated the standard (i.e. their concentrations were higher than 0.4 mgL-1), which makes it possible to deduce that highly significant levels of effluent are discharged into the Mataruna River, given that ammoniacal nitrogen levels form the emission standard for domestic sewage. In the freshwater stretch, the lowest value found was 2.49 mgL-1 at the upstream point (on March 5, 2015) and the highest was 19.7 mgL-1, at the confluence (on January 30, 2015). The analysis on ammoniacal nitrogen should be performed together with pH, in order to evaluate the standards established for class II freshwater, and thus, two violations of standards were observed (on January 30, 2015, and May 29, 2015), which made it possible to corroborate the suspicion that domestic sewage is being discharged into the Mataruna River.
Because phosphorus is an essential element for algal growth, when it is found at high concentrations, this can lead to excessive growth of these organisms, thereby leading to the eutrophication of natural waters (CETESB, 2009). According to VON SPERLING (2014), phosphorus does not present problems of sanitary nature in the water supply. Figure 5 shows the variation of total phosphorus over the sampling period.
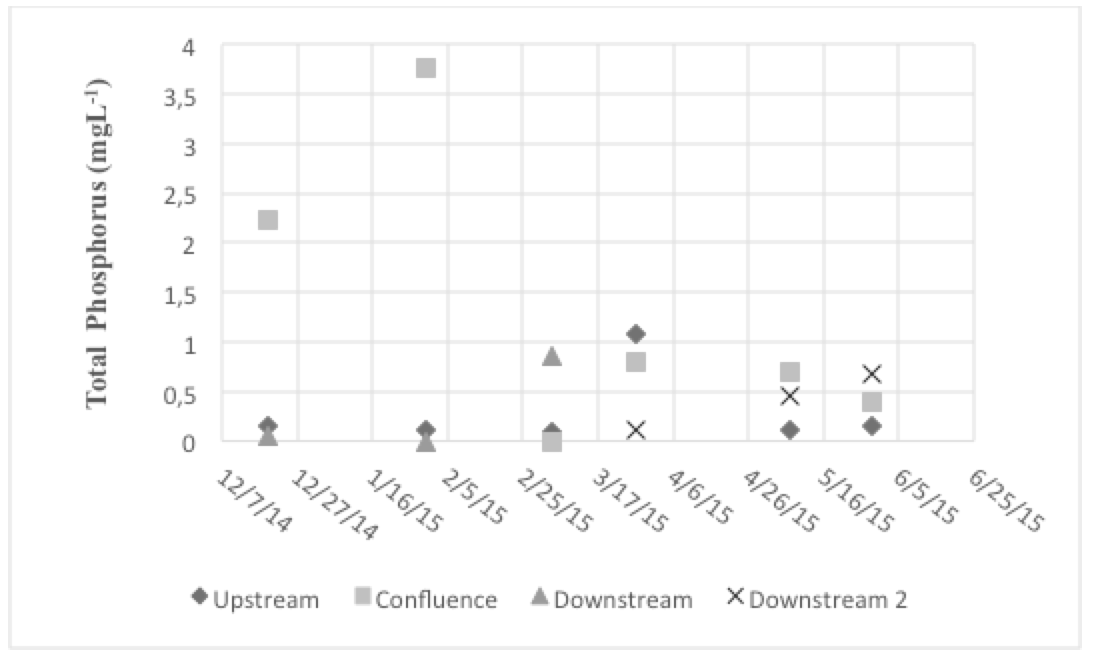
Figure 5. Evolution of total phosphorus concentration over time.
At locations where there was freshwater, the lowest value was 0.1 mgL-1 (on March 5, 2015) and the highest was 3.77 mgL-1 (on January 30, 2015), with three class violations. At location where there was brackish water, the lowest value found was below 0.01 mgL-1 and the highest was 2.23 mgL-1 (on December 19, 2014), with two class violations. For waters classified as saline, the lowest result was below 0.01 mgL-1 (on January 30, 2015) and the highest was 0.86 mgL-1, with one class violation. A significant portion of the water samples suggested that the total phosphorus concentration was consistent with a eutrophic environment, with a concentration above 0.05 mgL-1.
Dissolved oxygen is the main parameter for characterizing the effects of water pollution caused by organic waste (VON SPERLING, 2005). Figure 6 presents the variation of DO over the sampling period.
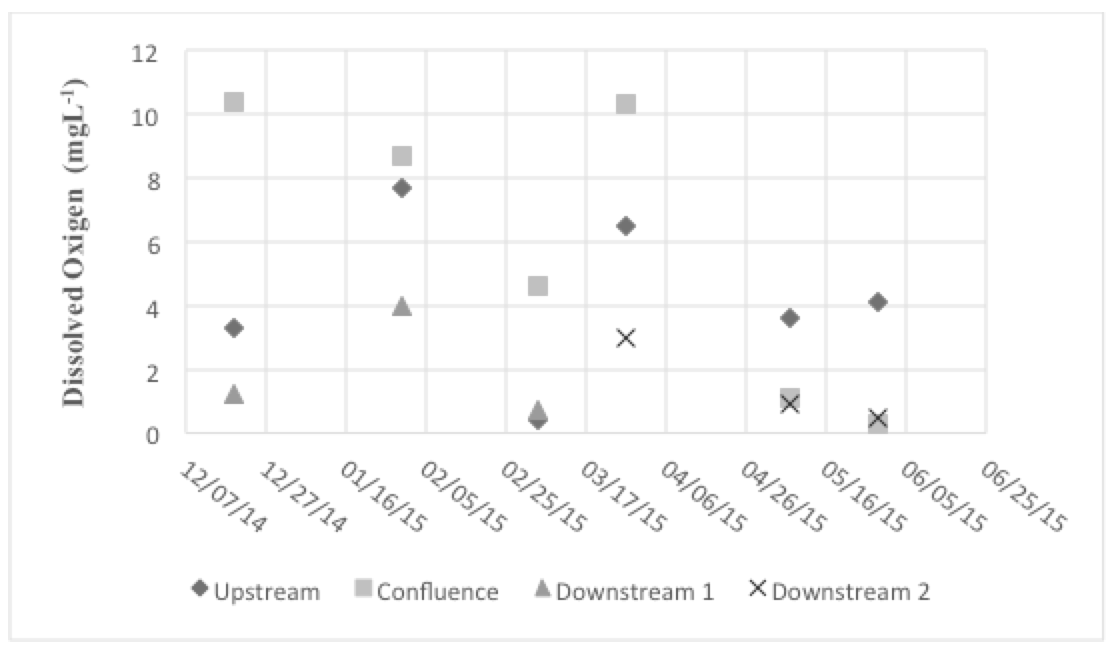
Figure 6. Evolution of dissolved oxygen over time.
In locations where the water was classified as freshwater, the lowest value was 0.3 mgL-1 (on May 29, 2015) and the highest was 10.4 mgL-1 (on December 19, 2014). Only one sample was within class II and the others violated the classification standard. In locations with brackish waters, the lowest value was 0.5 mgL-1 (on May 29, 2015) and the highest was 10.4 mgL-1 (on December 19, 2014). Over half of the results were below the limit established through CONAMA Resolution No. 357/2005. In locations with saltwater, the lowest value found was 0.7 mgL-1 (on March 5, 2015) and the highest was 4.0 mgL-1 (on January 30, 2015). In other words, all the values violated the classification standard. This can be explained by the fact that the sampling point Downstream 1 was located downstream from the effluent discharges from the Ponte dos Leites STS.
The presence of high levels of organic matter can induce full depletion of oxygen in water, thereby causing disappearance of fish and other forms of aquatic life (CETESB, 2009). According to VON SPERLING (2014), BOD reflects the organic matter content in sewage or water bodies and is a parameter of fundamental importance for characterizing the degree of pollution of a water body. Figure 7 shows the variation of BOD over the sampling period.
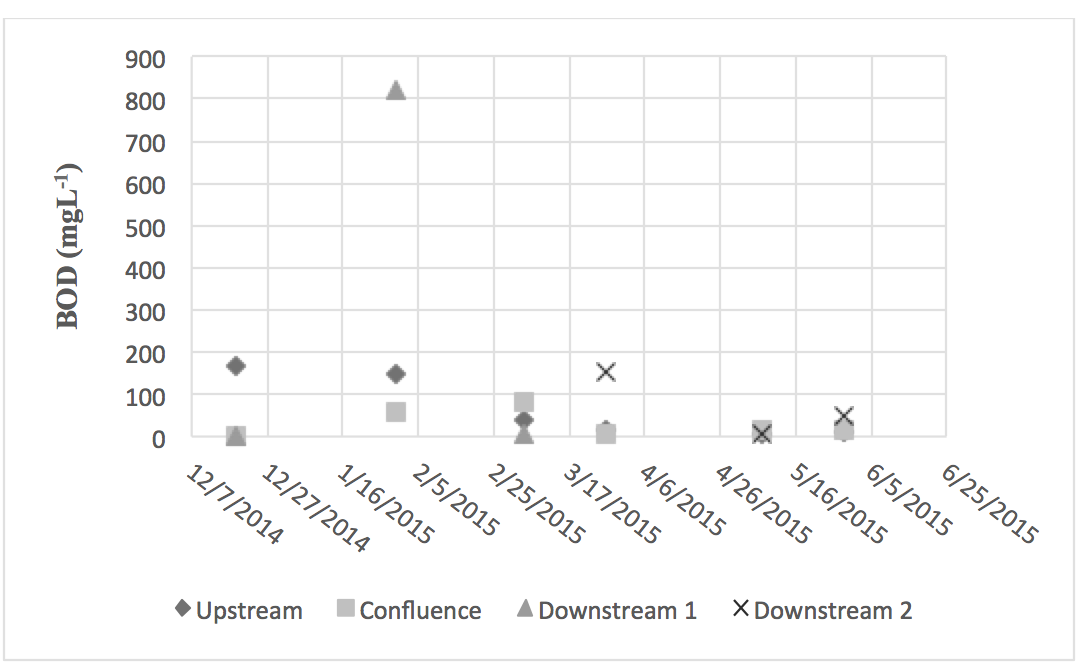
Figure 7. Evolution of BOD levels over time.
At locations where there was freshwater, the lowest value was 11.8 mgL-1 (on May 29, 2015) and the highest was 56.3 mgL-1 (on January 30, 2015). This means that the standard was violated in all samples. Although waters classified as brackish do not have limiting values, their minimum value was below 3.0 mgL-1 (on December 19, 2014) and their maximum was 166 mgL-1. Likewise, saltwater presented a minimum value of below 3.0 mgL-1 (on December 19, 2014) and a maximum value of 820 mgL-1 (on January 30, 2015), which was higher than the concentration of raw sewage, which was 300 mgL-1 (Von Sperling, 2014). This result suggests that some form of unauthorized effluent discharge from Ponte dos Leites STS, or some form of discharge operation from the bottom of the underwater dam was taking place, given that the sampling point Downstream 1 was located upstream from the underwater dam, or from any dredging operation.
Escherichia coli or E. coli has the ability to grow and ferment lactose at high temperatures, and its habitat is almost exclusively limited to the gastrointestinal tract of human beings and warm-blood animals. Other heat-tolerant bacteria that are defined as coliforms have the same habitat but are more abundant in the environment (CETESB, 2009). Figure 8 presents the variation of E. coli levels over the sampling period.
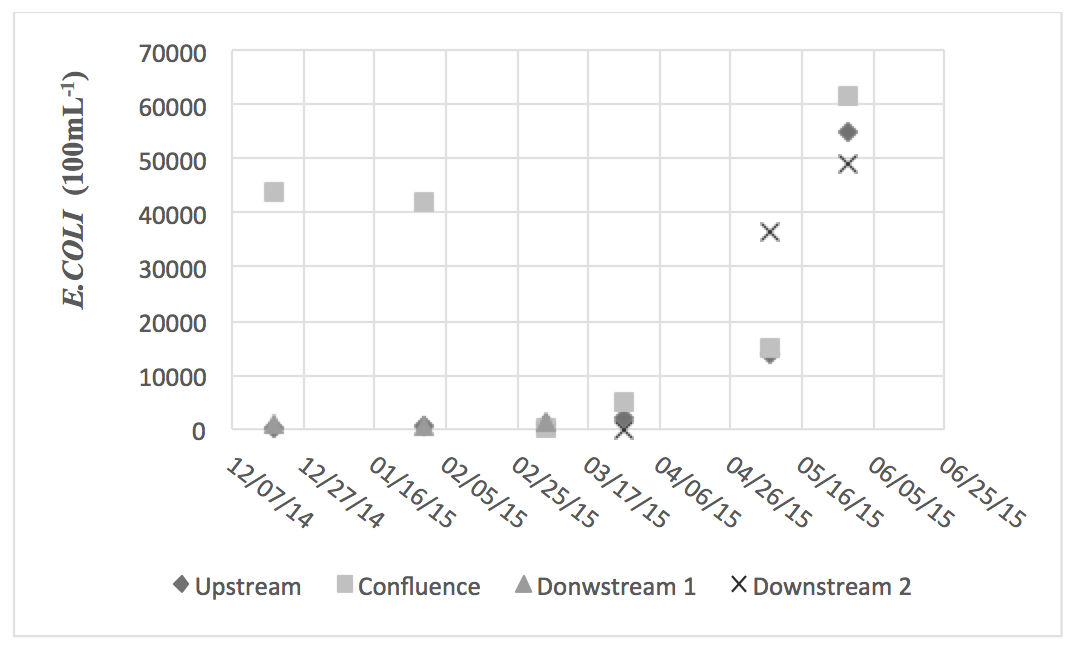
Figure 8. Evolution of E. coli levels over time.
The analyses on the freshwater samples showed that the lowest count was 1,000 per 100 mL (on March 5, 2015) and the highest count was 61,670 per 100 mL (on May 29, 2015). In the samples from brackish water, the lowest count was below 10 per 100 mL (on March 27, 2015) and the highest was 49,070 per 100 mL (on May 29, 2015). The analyses on saltwater samples presented the lowest count of 630 per 100 mL (on January 30, 2015) and the highest of 1,200 per 100 mL (on March 5, 2015).
According to CONAMA Resolution No. 274/2000, in relation to contact recreational activities, the brackish water samples presented excellent conditions on December 19, 2014, March 5, 2015, and March 27, 2015, and satisfactory conditions on January 30, 2015. Regarding the freshwater samples, all of them except one were above 2,000 per 100 mL, which made it possible to infer a classification of inadequate. On January 30, 2015, the saltwater samples presented satisfactory conditions (630 per 100 mL). The other saltwater samples were classified as unsatisfactory, although not inadequate, because the maximum limit was above 2,000 per 100 mL.
Tables 3 and 4 provide the results from Spearman’s correlation coefficient and the Kruskal-Wallis test, including multiple comparisons between sampling points.
Table 3. Spearman’s correlation coefficient, according to the sampling points.
Pairs of parameters |
Sampling points |
||
Upstream |
Confluence |
Downstream |
|
Total Solids vs. salinity |
0.657 |
0.943* |
0.771 |
Total Solids vs. pH |
0.371 |
0.829* |
0.086 |
Ammoniacal nitrogen vs. salinity |
-0.812* |
0.143 |
-0.714 |
Ammoniacal nitrogen vs. DO |
0.348 |
0.314 |
-0.829* |
Ammoniacal nitrogen vs. E. coli |
0.435 |
0.829* |
0.886* |
BOD vs. E. coli |
-0.943* |
-0.486 |
-0.371 |
DO vs. E. coli |
0.143 |
-0.143 |
-0.886* |
DO vs. phosphorus |
0.493 |
0.657 |
-0.886* |
*p-value ≤ 0.05
Table 4. Comparative analysis on each parameter between all sampling points.
Parameter |
p-value |
Salinity |
0.049* |
pH |
0.946 |
Total solids |
0.047* |
Ammoniacal nitrogen |
0.020* |
Total phosphorus |
0.411 |
DO |
0.306 |
BOD |
0.745 |
E. coli |
0.415 |
KW = Kruskal-Wallis test (*p-value ≤ 0.05)
Dunn’s multiple comparisons:
Salinity: M < D1 (p-value = 0.042); U = C (p-value = 0.387); D1 > C (p-value = 0.006); U = D2 (p-value = 0.724); D1 > D2 (p-value = 0.039) and D2 = C (p-value = 0.724)
Total Solids: U < D1 (p-value = 0.042); U = C (p-value = 0.358); D1 > C (p-value = 0.005); U = D2 (p-value = 0.791); D1 > D2 (p-value = 0.047) and D2 = C (p-value = 0.627)
Ammoniacal nitrogen: U = D1 (p-value = 0.825); U < C (p-value = 0.006); D1 < C (p-value = 0.013); U = D2 (p-value = 0.310); D1 = D2 (p-value = 0.284) and D2 = C (p-value = 0.216)
The analysis on Spearman’s correlation showed that total solids presented a significant positive correlation with salinity and pH at the Confluence point. In other words, the higher the degree of salinity and pH were, the higher the concentration of total solids also was. At the same point, a significant positive correlation was also observed between the E. coli count and ammoniacal nitrogen concentration. At the Downstream point, a significant negative correlation was observed between DO and the levels of ammoniacal nitrogen, total phosphorus and E. coli. In addition, at the same point, a positive correlation was observed between the E. coli count and ammoniacal nitrogen concentration. At the Upstream point, significant negative correlations were observed both for salinity measurements and ammoniacal nitrogen concentration, and for BOD and E. coli levels (Table 3).
Based on the Kruskal-Wallis test, significant differences between the parameters of salinity, total solids and ammoniacal nitrogen were observed (p-value < 0.05). Dunn’s multiple comparison test showed that the ammoniacal nitrogen concentration at the Confluence point was higher than at the Downstream 1 and Upstream points (p-value < 0.05). This indicates that the Polimix cement company’s effluent discharges were possibly giving rise to contamination. This corroborates the findings of the study by NYENJE, FOPPEN, UHLENBROOK, KULABAKO & MUWANGA (2010), in which the authors stated that industrial plants and urban areas are becoming the major sources of nutrients detected in waterways. In addition, the concentration of total solids was observed to be higher at the Downstream 1 point than at the Confluence, Upstream or Downstream 2 point, and also, the degree of salinity at the Downstream 1 point was higher than the degree found at the Upstream and Confluence points (Table 4). This allows the inference that the effluent discharges from the Ponte dos Leites STS and the saline nature of the Araruama Lagoon influence the mouth of the Mataruna River.
The objective of the present study was to diagnose the water quality of the Mataruna River through comparison between the results from laboratory analyses and the standards required by Brazilian law; and, whenever possible, to indicate the possible sources of pollution of its waters. In order to analyze the results, considering that the waters of the Mataruna River have not been categorized in a usage class, they were considered to be categorized as class II (freshwater) and class I (brackish and saltwater).
The results from the occurrences of violation of the class of water use and the statistical analyses indicated that the presence of sewage is drastically altering the physical-chemical characteristics of the Mataruna River and, probably, the ecosystem of the Araruama Lagoon, considering the fact that the river flows into it. The highest concentrations were found at the Downstream 1 point, located downstream from the underwater dam and from the effluent discharges from the Ponte dos Leites STS. This suggests that flaws exist within the sewage treatment process, or that the discharge point at the bottom of the underwater dam is frequently brought into operation, or even that uncontrolled dredging operations might be taking place.
The importance of the Araruama Lagoon for recreational activities, especially primary-contact recreation, also needs to be highlighted. Regarding the water quality limits established by CONAMA Resolution No. 274/2000, the results from 70% of the samples were categorized as presenting inadequate quality. Because of the importance of the Araruama Lagoon, basic sanitation actions are recommended, so as to enable environmental recovery of the Mataruna River basin and, consequently, of the lagoon system.
Lastly, conducting additional campaigns is recommended in order to enable correct evaluation of water quality variations over time and hydrological seasonality. In addition, installation of rainfall and water flow measurement stations is recommended, in order to monitor the hydrographic basin.
Águas de Juturnaiba (2005). Água e Esgoto[em linha].Grupo Águas do Brasil Web site. Acessado em 2 julho, 2015, em http://www.grupoaguasdobrasil.com.br/aguas-juturnaiba/agua-e-esgoto/ete/.
Alves, E. C. A., Silva, C. F. da, Cossich, E. S., Tavares, C. R. G., Souza Filho, E. E. de & Carniel, A. (2008). Avaliação da qualidade da água da bacia do rio Pirapó – Maringá, Estado do Paraná, por meio de parâmetros físicos, químicos e microbiológicos. Acta Sci. Technol, 30 (1), 39-48.
American Public Health Association. (2012). Standard methods for the examination of water and wastewater (22 ed.). Washington, DC: American Public Health Association.
Buzelli, G. M. & Cunha-Santino, M. B. da. (2013). Análise e diagnóstico da qualidade da água e estado trófico do reservatório de Barra Bonita, SP. Revista Ambiente Água, 8 (1), 186-205.
Cetesb. (1978). Norma Técnica - Determinação de nitrogênio orgânico e de nitrogênio total Kjeldahl em águas - Método da determinação de nitrogênio na forma de amônia: Método de ensaio. São Paulo: SP.
Cetesb. (2009). Qualidade das Águas Interiores no Estado de São Paulo. Apêndice A: Significado Ambiental e Sanitário das Variáveis de Qualidade das Águas e dos Sedimentos e Metodologias Analíticas e de Amostragem. São Paulo: SP.
Conama. (2005). Resolução nº 357, 2005 [em linha]. Conselho Nacional do Meio Ambiente Web site. Acessado em 2 julho, 2015, em: http://www.mma.gov.br/port/conama/res/res05/res35705.pdf.
Conama. (2011). Resolução nº 430, 2011 [em linha]. Conselho Nacional do Meio Ambiente Web site. Acessado em 2 julho, 2015, em: http://www.mma.gov.br/port/conama/res/res11/res43011.pdf.
Macedo, F. L.de., Mello Junior, A. V. de., Marcellini, S. S. & Pedrotti, A. (2012).Modelagem da produção de sedimentos na sub-bacia hidrográfica do rio Jacaré - SE. RA'E GA: o Espaço Geográfico em Análise, 24, 272-289.
Minella, J.P.G., Merten, G.H. & Clarke, R.T. (2009). Método fingerprinting para identificação de fontes de sedimentos em bacia rural. R. Bras. Eng. Agric. Amb., 13, 633-638.
Nyenje, P.M., Foppen, J.W., Uhlenbrook, S., Kulabako, R. & Muwanga, A. (2010). Eutrophication and nutrient release in urban areas of sub-Saharan Africa – a review. Sci. Total Environ. 408, 447–455.
Primo, P. B. da S., & Bizerril, C. R. S. F. (2002). Lagoa de Araruama. Perfil ambiental do maior ecossistema lagunar hipersalino do mundo. Rio de Janeiro, Projeto Planágua Semads / GTZ de Cooperação Técnica Brasil-Alemanha.
Siegel, S., Castellan Jr, N. J. (2006). Estatística não-paramétrica para ciências do comportamento. Porto Alegre: Artmed.
Tundisi, J. G. (2006). Novas perspectivas para a gestão de recursos hídricos. Revista USP, 70, 24-35, junho/agosto 2006.
Von Sperling, M. (2005). Princípios do tratamento biológico de águas residuárias. Belo Horizonte: Editora UFMG.
Von Sperling, M. (2014). Introdução à qualidade das águas e ao tratamento de esgotos. Belo Horizonte: Editora UFMG.
1. Instituição:UERJ.País :Brasil. Aluno de Doutorado em Engenharia Ambiental-UERJ(DEAMB). Email: brurocha@gmail.com
2. Instituição/Afiliação:Universidade Federal Fluminense. País:Brasil .Coordenadora do Mestrado em Defesa e Segurança Civil,
3. Instituição/Afiliação:Universidade Federal Fluminense .País:Brasil .Professor Adjunto do Departamento de Estatística