![]() ISSN 0798 1015
ISSN 0798 1015

![]() ISSN 0798 1015
ISSN 0798 1015
Vol. 38 (Nº 24) Año 2017. Pág. 16
Alexander Nikolaevich GUSHCHIN 1; Sergey Iosifovich SANOK 2; Natalia Viktorovna PEREVERZEVA 3; Natalia Fedorovna SHNEIDMILLER 4;
Recibido: 20/04/2017 • Aprobado: 30/04/17
ABSTRACT: This paper deals with one of the fundamental characteristics of the land use - the proportion of land use urban zones of different type with regard to the total number of land use urban zones. Sampling of cities was formed with the usage of two sources - 8 Russian cities, the features of which we studied previously, and 4 Western US cities selected on the basis that each city has one of the typical technology of urban development zoning. This sample is enough representative to exclude such factors as the difference in the traditions and approaches to zoning. For the formed sample the average of share of land use urban zones was determined, and then on the basis of mathematical and statistical tests it was showed that the residuals (deviations from the actual values for each city on average) have a normal distribution, which suggests that the calculated mean values represent the general average of all sample cities. There was made a meaningful interpretation of this fact. According to the authors, the general average is the characteristics of an "ideal urban layout planning system" that would have existed in the absence of external disturbances: political, social and economic, which display the urban planning system of the ideal state. |
RESUMEN: Este trabajo trata de una de las características fundamentales del uso de la tierra: la proporción de uso de la tierra zonas urbanas de diferente tipo con respecto al número total de zonas urbanas de uso de la tierra. El muestreo de las ciudades se formó con el uso de dos fuentes - 8 ciudades rusas, las características de las que hemos estudiado anteriormente, y 4 ciudades de los Estados Unidos occidentales seleccionados sobre la base de que cada ciudad tiene una de la tecnología típica de urbanización zonificación. Esta muestra es suficientemente representativa para excluir factores tales como la diferencia en las tradiciones y enfoques de la zonificación. Para la muestra formada se determinó el promedio de participación de las zonas urbanas de uso de la tierra, y luego sobre la base de pruebas matemáticas y estadísticas se demostró que los residuos (desviaciones de los valores reales de cada ciudad en promedio) Sugiere que los valores medios calculados representan el promedio general de todas las ciudades de la muestra. Se hizo una interpretación significativa de este hecho. Según los autores, el promedio general es las características de un "sistema de planificación urbanística ideal" que habría existido en ausencia de perturbaciones externas: políticas, sociales y económicas, que muestren el sistema de planificación urbana del estado ideal. Palabras clave Normas de uso y desarrollo del suelo, intensidad del desarrollo de la tierra, teoría del "marco-tejido", análisis matemático y estadístico. |

The traditional study of the city statistical properties can be measured from the famous Clark's work that was devoted to the study of the distribution density of urban population depending on the distance from center of a town. Clark's formula (as well as his approach) for quantitative spatial pattern change of urban population density is confirmed in the works of other supporters of the use of mathematical and statistical methods to analyze urban systems. The state of the research can be found in the reviews (McDonald, 1989). At a later date the quantitative ratios have been used in the context of applied sciences: in transport geography (Liddle, 2013) and the economy (Karathodoroua, Grahama and Noland, 2010).
As opposed to the above mentioned works, which examine the characteristics associated with the population, this article examines an average share of urban areas of different types for the generated sample of cities. That is a continuation of the tendency, based on the study of the urban development zoning (Gushchin, Gushchin and Sanok, 2015). The sample includes the cities of Russia and Canada, the development of which took place in different historical paths, which makes the sample representative.
An empirical study of the statistical properties of these samples can have a value for the construction of models of urban development, for example (Hua, 2014; Payal, 2011), for the development of normative documents of local importance, defining the general parameters of urban development, for the management of the processes occurring in the territory (Fainstein, 2015). The important point is a meaningful interpretation of the results; it allows understanding better of the general city development laws. A factful interpretation of the results concludes this article.
The initial sample of cities, which will be studied, consists of two sub-samples. The first subsample included Russian cities, the spatial characteristics of which have been studied in detail previously (Gushchin, Gushchin and Sanok, 2015). There were the principles of selection of the cities described in the work. Large enough cities were selected which are suitable for use in the method of nets, among those ones such cities were chosen the information about the functional use of which is presented exhaustively on the Internet. The sample is supplemented by cities in North America in order to take into account the differences between town planning traditions.
If the Russian urban planning tradition regards land use and development rules as a relatively new instrument, the West American tradition of urban development zoning has a long practice and it is based on quite different principles. Nowadays there are a number of recommendations for the development of land use and development, for example (Vilner, 2008) and (Vilner, 2006), but in reality, the creation of the Rules is made by the "contouring" zones with a matching type of use. Moreover, in the appointment of the zone boundaries of the same types, designers, according to the current Town Planning Code in Russia, rely both on actually existing species and land borders, as well as planned for 5 - 20 year perspective. The latter is stated in the materials of the Master Plan that is developed for each settlement. (The basis for the development of methodological approaches to Land use and development rules of Russian settlements was the experience of similar urban development zoning of European countries and the United States). There are three main approaches to the urban land use and development zoning in the West American tradition. Historically (since 1926) the first type of zoning was the Euclidean zoning with the same name of the town that was called - Euclid, Ohio. The peculiarity of this type of zoning is the grouping of similar types of uses: residential areas with residential areas, commercial with commercial ones, while limiting the scale (intensity) activity, depending on the size of the zone. Euclidean zoning allows creating a uniform density of development (the intensity of development of the territory). The following basic typology of areas is generally used for the Euclidean zoning: residential areas, commercial or industrial zone use. The more complex typology of zones is built on the basic types. For this typology of zones one can set a direct correspondence to the types of zones which are used for the sampling of Russian cities. City of Conway (Conway Old), Arkansas (City of Conway zoning, 2014) was regarded as a typical representative. With the lapse of time the limitations of the Euclidean approach was recognized and the issue of transition to the new zoning methods (Alexander, 1994) was put. The development of approach to the urban land use and development zoning in the North American tradition was zoning that is based on targeted criteria. Toronto that is one of the largest cities in Canada uses this approach. There was adopted an urban development plan in Toronto, which sets out the basic policy in the field of urban development, then on its basis there was adopted a decision on zoning (Toronto Zoning Bylaw, 2013.) - the position of the "zoning by law." From the normative point of view, the position of the "zoning by law" is an analog of Russian urban development reglaments. The next approach to zoning is a stimulating zoning. Chicago and New York (NY Zoning and Land Use, 2014) are typical followers of this approach. An incentive zoning is aimed in getting high characteristics of development by establishing the limiting constraints, followed by redistribution of rights to excess limitations within the developers’ community. And the last approach is a typical zoning area with the usage of a mixed type.
The basic idea of such an approach to zoning is established that the land use and development zones of the mixed type are emerged, which allowed a wide variety of buildings. As the area is built up, its final destination will be determined. Such type of zoning is used in Montreal (Carte 3.1. Land Use designations, 2014).
The next problem is the selection of an object of study. This article deals with the proportion of types of urban land use and development zones of different kinds in relation to the total number of urban zones. This choice is based on several reasons. Firstly it is the fact that these characteristics have an integrated (combined) character, describing the fundamental characteristics of the land use. Secondly, the study of these characteristics may be useful for the construction of various theoretical models, for example (Rossi-Hansberg, 2004), (Zhou, 2015), and others. Third, the examination of these characteristics can be used in the practice of the land use and development documents. Fourth, these characteristics have been studied neither in Russian, nor in North American urban planning school. There were used two different methods for calculating the share of urban zones. For Russian cities there was used a grid method when the city covers the area of an even rectangular grid, and then there was calculated the number of urban zones that fall in different grid cells and accordingly the proportion of urban zones. The method of direct calculation of the number of urban zones was made for the North American cities. The existence of two different methods of calculation in the sample increases the representativeness of the sample.
The authors used the under mentioned formulas, criterions and methods of calculations:
1. The criterion for rejection of big errors – misses.
2. The statistical criteria for testing the normality of distribution.
3. The criterion on the basis of the coefficient of variation.
4. The criterion of the average absolute deviation.
5. A criterion based on the scope of variation.
6. Epps-Palli Criterion.
The criterion for rejection of big errors - misses is based on the type of statistics
![]()
Where 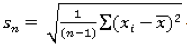 - a standard deviation (dispersion)
![]() - an average value,
- an average value,
n – the volume of the sample = 14.
For the practical application on can calculate τi a value for each sample, and compare the calculated value with the critical value τ0. For sample size n = 14 and a confidence level of 95% τ0 = 2,46 (Mikeshina, 1966). If τ <τ0, the hypothesis that the value is a miss is rejected.
Statistical calculation results are presented in Table 1.
Table 1. Results of statistical calculation of determining the misses
|
City |
Feature value |
Statistics value |
The critical value of statistics |
Social and business zones |
|
|||
Maximum value |
Conway |
0,39 |
2,16 |
2,46 |
Minimum value |
Ryazan |
0,16 |
1,38 |
2,46 |
Industrial zones |
|
|||
Maximum value |
Tyumen |
0,22 |
1,72 |
2,46 |
Minimum value |
Ney York |
0,008 |
1,66 |
2,46 |
Residential and recreational zones |
|
|||
Maximum value |
Smolensk |
0,56 |
1,53 |
2,46 |
Minimum value |
Ufa (Conway) |
0,25 |
1,12 |
2,46 |
Thus, for most cities the criterion is liberal satisfied - statistic value is about twice less than the critical value. A calculated value for Conway city statistics is closer to critical, which may explain the fact that the calculations made for Old Conway County, where there is a historical core of the city, buffer zones of monuments of architecture.
The criterion on the basis of the coefficient of variation is based on the type of statistics:
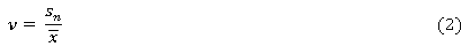
where sn - standard deviation,
¯x - the average value,
The decision of normality is accepted if ν <0.33.
In our case, the criterion values are given in Table 2.
Table 2. Values of the coefficient of variation
Architectural city zones |
The value of the coefficient of variation |
Social and business zones |
0,82*10-2 |
Industrial zones |
0,77*10-2 |
Residential and recreational zones |
0,04 |
The criterion is satisfied for all types of zones.
The criterion of the average absolute deviation – the mean absolute deviation is defined as follows
![]()
For sample that has a normal distribution, the ratio should be performed
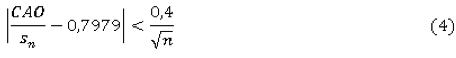
The values of the test are shown in Table 3.
Table 3. The values of the mean absolute deviation criterion
Type of architectural city zone |
The criterion value |
The value limit |
Social and business zones |
0,03 |
0,12 |
Industrial zones |
0,07 |
0,12 |
Residential and recreational zones |
0,06 |
0,12 |
Table 2 shows that the criterion of normality, based on the average absolute deviation, is performed for all types of zones.
A criterion based on the scope of variation is based on a calculation of such type of statistics
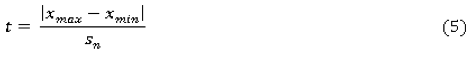
that has a normal distribution.
For the usage of this criterion it is necessary to set a given level of confidence probability p = 90% we find the value of the interval tables where should statistics be placed (5). For sample size n = 10 for statistics (5) the lower limit of the interval of 2.76, the upper limit of the interval - 3.57. The results of the usage of this test are shown in Table 4.
Table 4. Results of calculations of the criterion for the different types of urban zones
Type of architectural city zone |
The criterion value |
Lower interval |
Upper interval |
Confidence probability |
Social and business |
3,08 |
2,76 |
3,57 |
90% |
Industrial |
2,80 |
2,76 |
3,57 |
90% |
Recreational |
2,42 |
2,76 |
3,57 |
80% |
In the latter case the tables can determine the level of significance which this criterion runs with.
Epps-Palli Criterion is the most difficult to the calculation, but it also has been used as recommended for use by international standards.
The criterion is based on the calculation of statistics
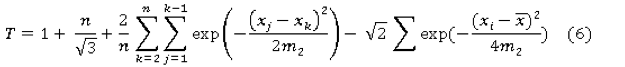
where m2 - the central point of the second order that is calculated according to the formula

The calculated value of the criterion is compared to a critical value, which is determined by the table for a given level of significance. If the calculated value of the statistic (10) is less than the critical value, the hypothesis of normal distribution is regarded. For a sample size of 10 and a confidence probability of 90% of the critical value of Epps Palli-statistics will be 0.279. The calculated values of the criteria are shown in Table 5.
Table 5. The calculated values of Ashley-Pali criterion
Type of architectural city zone |
The calculated value of statistics (10) |
The critical value of statistic |
Social and business zones |
0,04 |
0,279 |
Industrial zones |
0,13 |
0,279 |
Residential and recreational zones |
0,19 |
0,279 |
The calculated value of the criterion indicates that statistics Epps-Palli obeys a normal distribution law.
Nevertheless, questions of activization of growth of cluster structures taking into account branch specifics in the conditions of the economy of Kazakhstan are insufficiently developed.
A summary of the various types of shares for the Russian cities of urban land use and development zones are given in Table 6. The data are presented excluding certain types of urban areas: transportation, special, agricultural.
Table 6. Summary of the shares of various zone types for the Russian cities
City |
Types of architectural zones |
||
Social and business |
Industrial |
Residential and recreational |
|
Yekaterinburg |
0,29 |
0,13 |
0,51 |
Kaliningrad |
0,23 |
0,13 |
0,55 |
Omsk |
0,25 |
0,18 |
0,39 |
Perm |
0,23 |
0,15 |
0,26 |
Ryazan |
0,16 |
0,12 |
0,42 |
Saratov |
0,19 |
0,14 |
0,54 |
Smolensk |
0,16 |
0,19 |
0,56 |
Tyumen |
0,25 |
0,22 |
0,32 |
Ufa |
0,19 |
0,18 |
0,25 |
Khabarovsk |
0,2 |
0,21 |
0,26 |
Average |
0,22 |
0,17 |
0,40 |
In order to include North American cities into the sample, it is necessary to lead a unified classification of all types of urban zones. The key for the comparison of different data is Table 7 which shows what types of urban zones of the West American cities are related to the types of urban areas shown in Table 6.
Table 7. Reduction of various types of urban areas for North American cities to a single type
City |
Types of urban land use and development zone in the author's notation |
Type of urban land use and development zone in the original |
Conway |
Social and business |
Commercial; Office; Special (S-1 Institutional, S-2 Institutional) |
Industrial |
Industrial; Special (A-1 Agricultural) |
|
Residential and recreational |
Residential |
|
Not considered |
Special (PUD, TJ) |
|
Toronto |
Social and business |
Commercial; Institutional |
Industrial |
Employment Industrial; Utiliy and Transportation (в части Utility) |
|
Residential and recreational |
Residential; Residential Apartment; Open Space |
|
|
Not considered |
Utiliy and Transportation ( in Transportation part) |
Montreal |
Social and business |
Major Institutional Facility; Convert, Monastery or Place of Worship; Public Utilities |
Industrial |
Employment Area |
|
Residential and recreational |
Residential Area; Rural Area; Major Green Space or Riverside Park |
|
Not considered |
Major Transportation Corridor |
|
Not considered |
Mixed-Use Area |
|
New York |
Social and business |
Commercial Use; Public Fasilities & Institutions |
Industrial |
Industrial/Manufacturing; Transportation/Utility |
|
Residential and recreational |
1&2 family residence; Multy-Family Residence (Walkup); Multy-Family Residence (Elevator); Open Space & Recreation |
|
Not considered |
Mixed Residentianal & Commercial |
|
Not considered |
Parking
|
Next, based on our data we calculated the shares of the urban areas of different type to the total urban areas. The results of calculation are shown in Table 8.
Table 8. Summary of the shares of various types of zones for the North American cities
City |
Types of urban land use and development zones |
||
Social and business |
Industrial |
Residential and recreational |
|
Conway |
0,39 |
0,13 |
0,25 |
Toronto |
0,29 |
0,11 |
0,35 |
Montreal |
0,20 |
0,17 |
0,33 |
New York |
0,35 |
0,08 |
0,36 |
Average |
0,31 |
0,12 |
0,32 |
Comparing the data in Tables 6 and 8, we can see that the differences in average shares of urban zones are: for social and business areas 0.09, 0.05 for industrial zones, residential and recreational areas 0.08. On the other hand, they do not exceed the difference between the minimum and maximum values in Table 6. Since the differences are not big, one can combine all the cities into a single table, and consider the general characteristics of the sample. As a result, we obtain a sample that is shown in Table 9.
Table 9. Summary of sampling of all the cities
City |
Social and business |
Industrial zones |
Residential and recreational |
Yekaterinburg |
0,29 |
0,13 |
0,51 |
Kaliningrad |
0,23 |
0,13 |
0,55 |
Conway |
0,39 |
0,13 |
0,25 |
Montreal |
0,20 |
0,11 |
0,33 |
New York |
0,35 |
0,08 |
0,36 |
Omsk |
0,25 |
0,18 |
0,39 |
Perm |
0,23 |
0,15 |
0,26 |
Ryazan |
0,16 |
0,12 |
0,42 |
Saratov |
0,19 |
0,14 |
0,54 |
Smolensk |
0,16 |
0,19 |
0,56 |
Tyumen |
0,25 |
0,22 |
0,32 |
Toronto |
0,29 |
0,11 |
0,33 |
Ufa |
0,19 |
0,18 |
0,25 |
Khabarovsk |
0,2 |
0,21 |
0,26 |
Average |
0,24 |
0,15 |
0,38 |
For testing the homogeneity of the sample we will check the cities on the criterion of the misses. In the analysis of the data blunder (release) is the measurement result that stands out from the total sample. In the future misses will be a subject to the meaningful analysis to ascertain the reasons on which they are extracted from the sample. The method of test for misses was taken from the work (Mikeshina, 1966). The test results are shown in Table 10, there are all the formulas and intermediate results in Methodology.
Table 10. The audit summary of the sampling criterion misses
|
City |
Value |
Can it be a miss? |
Social and business zones |
|||
maximal value |
Conway |
0,39 |
no |
minimal value |
Ryazan |
0,16 |
no |
Industrial zones |
|||
maximal value |
Tyumen |
0,22 |
no |
minimal value |
New York |
0,008 |
no |
Residential and recreational |
|||
maximal value |
Smolensk |
0,56 |
no |
minimal value |
Ufa (Conway) |
0,25 |
no |
Thus, the test results that are shown in Table 10 make it possible to consolidate all the data into a single common sample and analyze its properties. The second conclusion infers that the combined sample is representative one; i.e. it adequately represents the properties of the entire population. The data on average shares of urban zones presented in Table 9 is a sample derived from a common general population, i.e. from the set of all the cities that could be examined. An important point is the nature of the distribution; i.e. it is the law under which the deviations from the general average (residues) are distributed. The intermediate hypothesis of this study is that the distribution of deviations from the general average (residues) is Gaussian. In order to answer the question about the normality of the sample, which is shown in Table 9, we used a set of tests for checking the normality as specially selected for low volume samples (Gribovsky, Barinov and Anisimova, 2002). We took the first three most basic criteria and the recommended standard "Statistical methods» (ISO 5479-97 international standard is authentic) (State Standard R ISO 5479-2002, 2002) we took the most difficult criterion Ashley-Pali. Table 11 provides a summary data. All the necessary formulas are given in Methodology.
Table 11. Summary data of normality distribution criteria
Title of the criterion |
Types of architectural zones |
||
Social and business zones |
Industrial |
Residential and recreational |
|
The criterion on the basis of the variation coefficient |
yes |
yes |
yes |
A criterion on the basis of mean absolute deviation |
yes |
yes |
yes |
The criterion on the basis of amplitude variation |
yes |
yes |
yes |
Criterion Ashley-Pali |
yes |
yes |
yes |
As shown in Table 11, all of the criteria for checking normality are satisfied on a confidence level of 95%, which suggests that the allocation of all the types of urban zones obeys the normal law. While the number of the surveyed cities is growing (while the volume of the sample is growing), the average of the sample mean of Table 4 will tend to the general average. The calculated average values are universal constants, which describe the general structure of the urban land use planning system. These constants (more general average) will characterize an ideal urban planning layout.
Thus, it was proved that the average shares of urban land use and development zones on a sample shown in Table 9 are a good approximation for the general medium that could happen as a result of studying the full number of objects. Further substantial discussion should answer the question, what the general average is - a mathematical quantity or general average that can be given a meaningful definition to. Mathematical statistics does not deal with the solution of the raised question, and in practice there are cases when the general totality can be a real object, for example, the population of the state in a given year or speculative object, for example, an infinite number of coin tosses. The fact that the city can have such an urban developing zoning that the shares of urban zones are exactly equal to the shares which are presented in Table 9 is not surprising at all. The question is why all the other cities deviate from the average values.
We will use the term "urban layout system" for further meaningful interpretation of the results. The term urban layout system was put in practice by the Soviet city planner A. E. Gutnov, who defined it as follows: urban layout (UL) is a relatively isolated, functionally related area of organized human spatial environment within where the set of basic forms of social activity of the population is realized. The main idea that is expressed in his book "The Evolution of Urban planning" was the need to move from a functional purpose to the territory described in the language of the intensity of use of the area (Gutnov, 1984). That is why the term "urban layout" was introduced, which carries the "center of gravity of the city study to explore the internal relationships of the essential facility to identify the most common properties of its structural - functional organization (SFO)." The "western" (not Russian) urban planning tradition also uses the term “urban planning system”, but the content of the term has an entirely different meaning.
If town planning is the problem of optimal placement of territorial zones according to each other in order to control the development of the territory, the “urban planning” is process control, occurring on the territory (Fainstein, 2015).
The authors interpret the general average as the ideal state of urban layout - a condition in which the urban layout would have stayed if it had not experienced any impact. The argument for the presented point of view is a well-known in probability theory central limit theorem, which states that the sum of a sufficiently large number of weakly dependent random variables, having approximately the same scale (or one of the terms does not dominate, does not bring in the amount determined by the contribution) has a distribution that is close to normal (Ayvazyan and Mhitaryan, 2001). Any urban system is under the influence of many factors. The source of changes in the state of urban layout systems are changing typological accessory elements of the system, which are based on changes in the population's needs, demographic, social structure, economic activity, governance, migration, etc. The manifestation of new socio-economic and social trends, new forms of action and methods of spatial organization contradicts the requirement of stability of the urban system. At the same time there is no reason to say that a particular factor is dominant, i. e. it exceeds the force exerted by all other factors. Or at least, it can be argued that none of the factors has been dominant for a long time. Everything that is put together forms the impact of a large number of disturbing factors, referred to in the central limit theorem. It can be proved that under the influence of various external factors an urban layout system over time describes the dynamic "trajectory" in the space, which is characterized by different zones shares. The status of all urban layout systems forms a sample with the general average now. Therefore, one can conclude that the normal distribution is a factor that confirms the view that the general average for the entire sample can be regarded as a characteristic of the "ideal urban layout system."
What ensures the stability of the urban planning system? What makes it go back to the ideal state? According to the authors, the stability of the system is provided by "flexibility" of the system: the ability of urban layout systems to the internal restructuring at the expense of territorial development, changes in the intensity and nature of use of the system elements (buildings, structures, and areas), change of direction and intensity of relationships between the elements. In order to obtain a complete picture of the interaction between the ideal urban layout system and the factors that perturb the ideal state of the system, it is necessary to describe the mechanism (method) that returns the urban layout in the perfect condition. The key to understanding of the stability mechanism gives the model that is referred above of the “frame” and “tissue”. A. E. Gutnov introduced the concept of "frame", "tissue", "plasma" in his book "The Evolution of Urban Planning". The "frame" is understood as "a relatively stable structure-forming part of the system, concentrating the basic processes of life of the urban population which are associated with high-intensity spatial development and investment activity". In contrast, "tissue" is understood as a relatively uniform construction that fills the space between the elements of the urban frame. Frame and tissue are in a state of stable equilibrium between each other, which is constantly violated. The framework in order to ensure the effective functioning of the whole system, designed for a specific structural and functional potential of tissue, requires building, strengthening and increasing complexity of the operation. If the urban tissue becomes more than frame can withstand, then it starts a completion of frame - the city's infrastructure is being created, which it is necessary to make the necessary changes in the land-use regulations. If the frame strengthens so that it can "bear" larger volume of city tissue, then the process of building pre-emptive urban fabric begins, which also requires changes in land-use regulations. Thus, the interaction of frame and tissue creates a "feedback loop" – it is a mechanism by which an ideal urban layout returns to its original stable state.
Thus, the following work was performed. First, a representative sample of cities was set up, reflecting different approaches to the urban land use and development zoning. The average values of urban areas were calculated on the basis of established sample. Meaningful interpretation of the average values, according to the authors, is that the general average is the characteristics of an "ideal urban layout system" that would have existed in the absence of external disturbances: political, social and economic, which displays the urban layout system out of the ideal state. With the usage of the model of "frame" - "tissue" it is shown that the interaction between "frame and tissue" creates a feedback mechanism that returns an ideal urban layout system to its "ideal" - a stable state. These results may have a theoretical value, serving as a basis for building different models of urban layout developing and practical application value, serving as recommended values in the development of land-use regulations.
The authors thank D. Y. Maximova, who made the work on the calculation of urban areas share for North American cities. Besides, the authors thank the pro-rector for scientific work M. V. Puchkov and the Rector of the Ural State Academy of Architecture and Arts S. P. Postnikov for their financial support and interest in the publication of this article.
Alexander, E.R. (1994). The Non-Euclidean Mode of Planning What Is It To Be? Journal of the American Planning Association, 60(3), 372-376.
Ayvazyan, A. & Mhitaryan, V.S. (2001). Probability theory and applied statistics. Vol. 1. Moscow: Unity-Dana.
City of Conway Zoning. (2014). Retrieved from: http://www.conwayplanning.org/GIS/CityWide_Maps/CurrentZoning.pdf
Fainstein, S. (2005). Planning Theory and the City. Journal of Planning Education and Research, 25(2), 121-130.
GOST R ISO 5479-2002. (2002) Statistical methods. Checking the deviation of probability distribution from the normal distribution. State Standard of Russia. Moscow.
Gribovsky, S.V., Barinov, N.P. & Anisimova, I.N. (2002). On improving the reliability of the market value assessment by a comparative analysis. Questions of Assessment, 1, 3-11.
Gushchin, A.N., Gushchin, F.A. & Sanok, S.I. (2015). Analysis of the Urban Fabric Using Land Use and Development Rules. Modern Applied Science, 9(5), 50-62.
Gutnov, A.E. (1984). Evolution of urban planning. Moscow: Stroyizdat..
Hua, H. (2014). Planning meets self-organization: Integrating interactive evolutionary computation with cellular automata for urban planning. Frontiers of Architectural Research, 1(4), 400-404.
Karathodoroua, N., Grahama, D. & Noland, R. (2010). Estimating the effect of urban density on fuel demand. Energy Economics, 32(1), 86–92.
Liddle, B. (2013). Urban density and climate change: a STIRPAT analysis using city-level data. Journal of Transport Geography, 28, 22–29.
McDonald, J. (1989). Econometric Studies of Urban Population Density: Survey. Journal of Urban Economics, 26, 361-385
Mikeshina, N.G. (1966). Identification and elimination of outliers (review). Factory Laboratory, 3, 310.
Montreal. Master Plan. Carte 3.1. Land Use designations (2014). Retrieved from: http://ville.montreal.qc.ca/portal/page?_pageid=2762,3099501&_dad=portal&_schema=PORTAL
NY Zoning and Land Use (2014). Retrieved from: http://maps.nyc.gov/doitt/nycitymap/template?applicationName=ZOLA
Payal, K. (2011). A Review Study On Urban Planning & Artificial Intelligence. International Journal of Soft Computing and Engineering (IJSCE), 1(5), 101-104.
Rossi-Hansberg, E. (2004). Optimal urban land use and zoning. Review of Economic Dynamics, 7, 69–106.
Rossi-Hansberg, E. (2004). Optimal Urban Land Use and Zoning. Review of Economic Dynamics, 7, 69-106.
Toronto. Zoning Bylaw 569-2013 (2013). Retrieved from: http://www1.toronto.ca/wps/portal/contentonly?vgnextoid=2a8a036318061410VgnVCM10000071d60f89RCRD
Vilner, M.Y. (2006). Methodological bases for the development of territorial planning documents. Urban management, 9, 31-43.
Vilner, M.Y. (2008). Organizational bases for the development of territorial planning schemes. Urban planning policy in the light of the territory management problems. Moscow: Publishing house ‘Zodchiy’.
Zhou, M. (2015). An interval fuzzy chance-constrained programming model for sustainable urban land-use planning and land use policy analysis. Land Use Policy, 42, 479–491.
1. Ural State University of Architecture and Arts (USUAA), Department of Economics and urban management, Ekaterinburg, Russian Federation. Associate Professor. Researcher ID: C-6509-2014. E-mail: alexanderNG@yandex.ru
2. Ural State University of Architecture and Arts (USUAA), Department of Economics and urban management, Ekaterinburg, Russian Federation. Professor
3. Ural State University of Architecture and Arts (USUAA), Department of Economics and urban management, Ekaterinburg, Russian Federation
4. Ural State University of Architecture and Arts (USUAA), Department of Economics and urban management, Ekaterinburg, Russian Federation