![]() ISSN 0798 1015
ISSN 0798 1015

![]() ISSN 0798 1015
ISSN 0798 1015
Vol. 38 (Nº 08) Año 2017. Pág. 14
Jonathan FABREGAS Villegas 1; Guillermo VALENCIA Ochoa 2; Marley VANEGAS Chamorro 3
Recibido: 01/09/16 • Aprobado: 28/09/2016
2. Methodology for Eolic analysis
ABSTRACT: Implementation of efficient energy management and its rational use, for the use of clean energy sources as wind resource present in the Caribbean Region of Colombia is a relevant fact in a new energy model based on renewable energies. A statistical study of the behavior of wind is conducted in order to encourage the construction of future wind farms, able to supply energy to the national grid system. Studies are developed by characterization of the wind resource through the application of the autocorrelation functions for surveys of wind persistence, and studies carried out in a period time since 2003 until 2013. |
RESUMEN: La implementación de la gestión eficiente de la energía y su uso racional, para el uso del recurso eólico presente en la región caribe de Colombia es un hecho relevante en un nuevo modelo energético basado en las energías renovables. Un estudio estadístico del comportamiento del viento con datos recolectados en estaciones meteorológicas suministrados por el IDEAM se lleva a cabo con el fin de fomentar la construcción de futuros parques eólicos, capaces de suministrar energía al sistema interconectado nacional. Se estudia la caracterización del recurso eólico a través de la aplicación de las funciones de auto correlación para los estudios de persistencia del viento y estudios llevados a cabo en un periodo de tiempo desde el 2003 hasta 2013. |

The utilization and implementation of clean energy sources conversion methods, have been a high priority for Colombia, a country that is going through critical moments of pollution and environmental disasters caused by climate change and harmful emissions from burning fossil fuels, furthermore there are present communities within their regions with limited access to vital resource for electric power of agricultural machinery for seeding and harvesting. Therefore, the evaluation of wind potential in the Colombian Caribbean region is required so that the implementation of future wind farms that supply energy to the national grid can be promoted.
The national electricity demand in Colombia, as evidences in the records since 2012, has been supplied by different sources of energy as follows, a 64 % by hydroelectric generation plants, a 30.8 % by thermoelectric plants, and a 4.8 % from lower generation plants; for the 2015 the net installed electrical capacity is 16,500 MW, supplying an increasing demand of 65,000 GWh [1]. As a measure to meet energy demand in Colombia, studies to determine the favorability of the implementation of wind farms have been conducted, for instance the wind farm Jepirachi in the department of La Guajira, with a capacity up to 20 MW in 2002, is today the only wind power generation plant [2]. In 2010, the license for construction and operation of the wind farm project Jouktai- Cabo de la Vela was granted, with a total capacity of 31.5 MW [3]. In 2014 law 1715 which regulates the integration of non-conventional renewable energy to the national energy system was enacted [4], which opened the study and promotion of new wind farms in Colombia, requiring the identification of meteorological stations for the characterization of wind potential so that can be possible the implementation of future Eolic parks in the northern region of the country.
The characterization of the wind potential is carried out from a statistical product analysis of data collected by agencies responsible of wind behavior measurement as IDEAM (Instituto de Hidrología, Meteorológia y Estudios Ambientales de Colombia), implementing numerical analysis models, such as Navier – Stokes, which consider the conservation of momentum, and the models proposed by Wind Atlas Analysis and Application Program (WASP), to correct the influence of local effects induced by the roughness of the surface, topography and so forth, which establish a logarithmic profile of wind speed with respect to the height [5], as well as methods that estimate the adjustment to theoretical Weibull’s curves by the duration curves and wind speed, as the studies conducted by Cancino Yoreley et al [6]. In areas where the wind’s properties were evaluated with ACP and Wind duration curves through the analysis of persistence and evaluation of properties for wind farms, the results of which were obtained indicating that the five areas of study are optimal for Wind Power Generation. In others studies, Cancino Yoreley et al [7] developed a study using historical data of electricity demand from Mexico, in areas where the effect between the different methods of power generation were compared, thus analyzing the wind behavior with the data collected for five meteorological and two anemometric stations in the state of Veracruz-México. Kasra M. et al [8], studied the efficiency of six numerical methods for determining the shape and scale parameters related to the Weibull distribution in order to calculate the wind power density, for different methods such as the Justus’ graphical method, Justus’ empirical method, Lysen’s empirical method, energy pattern factor method, maximum reliability method, and the maximum reliability modified method, through the studies of four meteorological stations located in the province of Alberta in Canada, which results revealed that, due to the fact of different meteorological and wind conditions, each station present a maximum efficiency using a different method with respect to the other stations.
As mentioned above, due to the wind behavior depends on specific factors such as the latitude and topography of the region, the study was carried out in four meteorological stations located in the departments of La Guajira and San Andres & Providencia, belonging to the Colombian Caribbean Region, in which the statistical analysis of data and analysis is developed through persistence models for wind.
Colombian Caribbean Region represents the 11, 6% of the total Colombian surface with a territorial extension of 132,288km2, in terms of coordinates, its location is 12°60′N - 7°80′N of latitude and 75°W - 71°W of longitude. It is integrated by seven departments: La Guajira, Atlántico, Bolívar, Cesar, Córdoba, Magdalena, Sucre and San Andrés & Providencia Islands. Each of them has a distinctive location suitable for harnessing the wind resource [9].
Studies conducted by the IDEAM in La Guajira and San Andres & Providencia indicate records about the behavior of the wind energy since 2003 until 2013, made in three stations with different geographic locations such as Aeropuerto Almirante Padilla, Aeropuerto El Embrujo, Aeropuerto Sesquicentena, and finally Puerto Bolívar, the location in terms of coordinates of the four stations is shown in Table 1 and Fig. 1.
STATION |
DEPARTMENT |
LATITUDE |
LONGITUDE |
Apto. Almirante Padilla |
La Guajira |
11°31′34″N |
72°55′33″W |
Puerto Bolívar |
La Guajira |
12°30'00"N |
71°28'00"W |
Apto. El Embrujo |
San Andrés y Providencia |
13°21′25″N |
81°21′30″W |
Apto. Sesquicentena |
San Andrés y Providencia |
12°35′01″N |
81°42′40″W |
Table 1. Location of the meteorological stations.
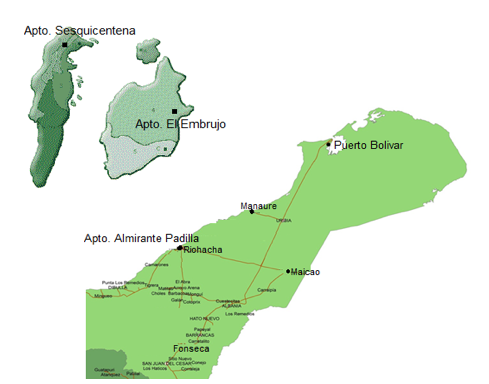
Fig. 1. Geographical location of meteorological stations.
Studies conducted for obtaining the wind behavior, present a susceptibility with respect to the current flows that have either height or difficulty of the wind flow by the surface roughness and obstacles. Therefore, a simplified method named Hellmann’s law, for estimating wind velocity using the height and topography as variables is used as in the equation 1:

Where is the wind velocity at the height h. the unknown v0 and h0 ccorrespond to the values of wind speed at a reference height which has been set at 10 meters to extrapolations, α refers to the effect of the roughness on the wind displacement [10, 11].
Historical readings of the wind of the meteorological stations are important for the measurement of wind potential. However, the large amount of data collected daily, monthly and annual, require a method of analysis that indicates which stations have a higher efficiency so that can be selected a place for the implementation of a wind farm. Therefore, the method of autocorrelation function (ACF) that allows the estimation of the persistence of the wind used in the equation (2, 3, 4), identify repetitive patterns within series of readings [12, 13, 14].
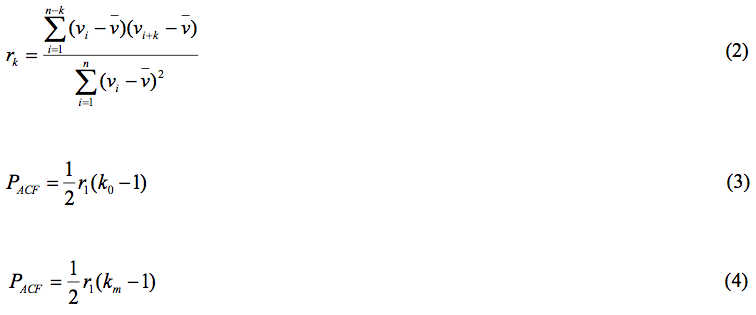
Where, rk is the autocorrelation coefficient, n is the numbers of data, k is the delay value, is the average wind velocity, PACF is the wind persistence with respect to the autocorrelation function. The values of k0 and km for the delay value, are calculated through the first minimum or decline as shown in the Fig. 2.
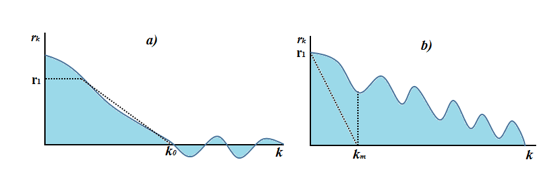
Fig. 2. Autocorrelation function for: a) the short function in rk=0 for ko, b) first minimum for km.
Collection of the data for the four stations was performed regarding to the wind velocity for monthly and annual periods of time as shown in Fig. 3 and Fig. 4. In addition, the behavior of the wind since 2003 until 2013, was recorded for each station. They are represented in such a manner of annual blocked graphics.
Fig. 3. Monthly average wind velocity.
Fig. 4. Annual wind velocity since 2003 until 2013.
Starting from the results of the annual average wind velocity since 2003 to 2013, an analysis was performed obtaining a variation of the wind velocity directly related to the variation of the height through the utilization of Helmann’s Equation, as shown in the Fig. 5.
Fig. 5. Average wind velocity at different heights.
The collected data obtained from the study of the meteorological stations, the hourly wind velocity and its mean value were grouped in graphics, for a period since 2003 until 2013, as shown in the Fig. 6:
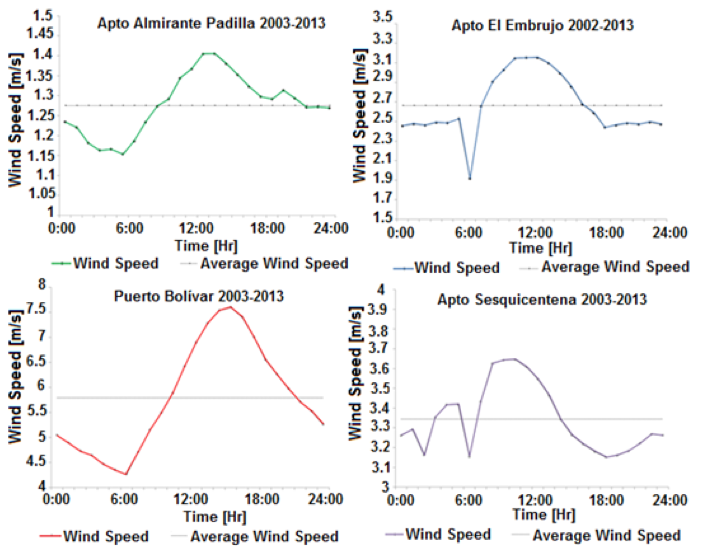
Fig. 6. Hourly average wind velocity.
Since the behavior of the wind has direction and sense, it is necessary to plot this behavior against time in order to get a successful location and harvesting of wind potential existent in the station. Thus, the wind roses were obtained for each meteorological station from the 2003 and 2013. The wind roses for February in the four meteorological stations are shown in Fig. 7.
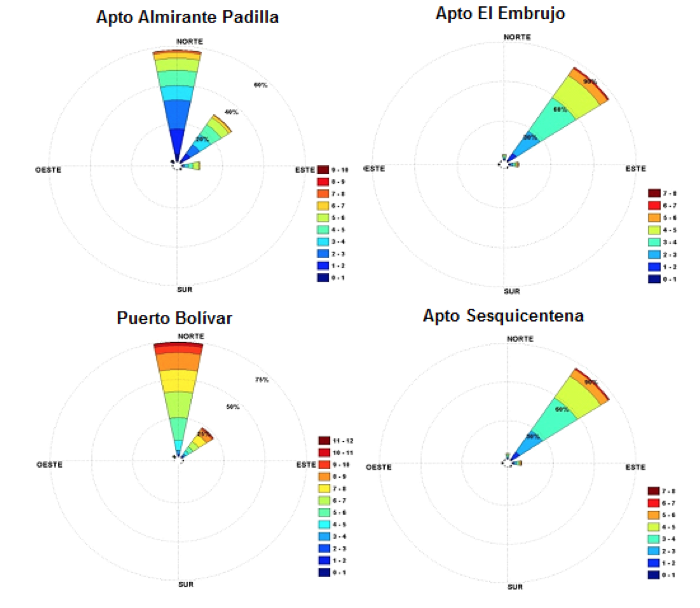
Fig. 7. Wind Roses for February.
Values for autocorrelation coefficients rk and delay coefficient k were obtained after an analysis of wind persistence through the application of the ACF, which allowed to calculate the area as a representation of the wind persistence values as shown in Fig. 8 and Table 2.
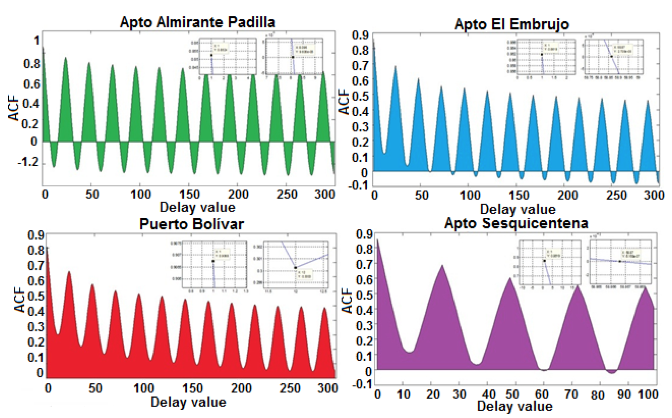
Fig. 8. Autocorrelation function.
STATION |
r1 (Y) |
K0 (X) |
PACF |
Apto. Almirante Padilla |
0,8524 |
8,096 |
3,02 |
Puerto Bolívar |
0,9068 |
12 |
4,99 |
Apto. El Embrujo |
0,8619 |
58,87 |
24,94 |
Apto. Sesquicentena |
0,8619 |
58,87 |
24,94 |
Table 2. Wind persistence.
The results suggest that the departments of La Guajira and San Andres & Providencia, possess a huge potential for the implementation of wind farms as sources of clean energy conversion.
The autocorrelation function has been applied to hourly data of wind speed corresponding to four weather stations located in the Caribbean region of Colombia during the years 2003-2013.
According to the results obtained from statistical analysis, Puerto Bolivar is the most suitable location for wind-generated electricity, which is an expected result because of the strongest winds presented in the peninsula in northern Colombia and northwestern Venezuela in the Caribbean.
Furthermore, the stations located in Aeropuerto Sesquicentena and Aeropuerto El Embrujo can be highlighted due to the fact that indicate the highest values of wind persistence after the analysis.
Finally, the resultant readings from the wind roses indicate a constant behavior in the wind direction enabling a more significant use of wind energy potential in each station.
The authors want to thank the IDEAM (Instituto de Hidrología, Meteorológia y Estudios Ambientales de Colombia) for the data provided to developed this work and the Engineering Division of Universidad del Atlántico for the financial support of this research respectly.
[1] M. de minnas y Energía, “Memorias al congreso de la república,” p. 250, 2013.
[2] Portafolio, “El viento ganaría terreno como fuente de energía en el país,” Bogotá. 2015.
[3] ISAGEN, “PARQUE EÓLICO JOUKTAI,” vol. 1, no. 03357, 2015.
[4] Congreso de Colombia, “Ley N° 1715 Del 13 de mayo de 2014,” no. May, p. 26, 2014.
[5] N. G. Mortensen, L. Landberg, I. Troen, E. L. Petersen, O. Rathmann, M. Nielsen, and L. Erik, “WAsP Utility Programs,” vol. 2261, no. September, p. 52, 2004.
[6] Y. Cancino-Solórzano, A. J. Gutiérrez-Trashorras, and J. Xiberta-Bernat, “Analytical methods for wind persistence: Their application in assessing the best site for a wind farm in the State of Veracruz, Mexico,” Renew. Energy, vol. 35, no. 12, pp. 2844–2852, 2010.
[7] Y. Cancino-Solórzano and J. Xiberta-Bernat, “Statistical analysis of wind power in the region of Veracruz (Mexico),” Renew. Energy, vol. 34, no. 6, pp. 1628–1634, 2009.
[8] K. Mohammadi, O. Alavi, A. Mostafaeipour, N. Goudarzi, and M. Jalilvand, “Assessing different parameters estimation methods of Weibull distribution to compute wind power density,” Energy Convers. Manag., vol. 108, no. April, pp. 322–335, 2016.
[9] A. M. Morales, “Colombia : Ordenamiento Territorial.”
[10] M. Hussain, “Dependence of power law index on surface wind speed,” Energy Convers. Manag., vol. 43, no. 4, pp. 467–472, 2002.
[11] K. KoÇak, “Examination of persistence properties of wind speed records using detrended fluctuation analysis,” Energy, vol. 34, no. 11, pp. 1980–1985, 2009.
[12] K. Koçak, “Practical ways of evaluating wind speed persistence,” Energy, vol. 33, no. 1, pp. 65–70, 2008.
[13] T. Arslan, F. Gül, and S. Birdal, “An alternative distribution to Weibull for modeling the wind speed data : Inverse Weibull distribution,” vol. 114, pp. 234–240, 2016.
[14] J. Zhou, E. Erdem, G. Li, and J. Shi, “Comprehensive evaluation of wind speed distribution models: A case study for North Dakota sites,” Energy Convers. Manag., vol. 51, no. 7, pp. 1449–1458, 2010.
1. MSc. Ing. Mecánico, Grupo Interdisciplinario de Investigación en Energía y Medio Ambiente, GIIMA, Facultad de Ingeniería, Universidad Autónoma del Caribe. E-mail: jonathanfabregas@hotmail.com
2. MSc. Ing. Mecánico, Grupo de Investigación Gestión eficiente de energía, Kaí, Facultad de Ingeniería, Universidad del Atlántico. E-mail: guillermoevalencia@mail.uniatlantico.edu.co
3. PhD. Ing. Químico, Grupo de Investigación Gestión eficiente de energía, Kaí, Facultad de Ingeniería, Universidad del Atlántico. E-mail: marleyvanegas@mail.uniatlantico.edu.co