
 HOME | ÍNDICE POR TÍTULO | NORMAS PUBLICACIÓN
 Espacios. Vol. 37 (Nº 32) Año 2016. Pág. 18
Tatyana Aleksandrovna SHINDINA 1; Mikhail Kuzmich VETROV; Oksana Andreevna GALIGUZOVA; Svetlana Igorevna MARYSHEVA; Anna Dmitrieevna CHUVASHOVA
Recibido: 14/06/16 • Aprobado: 18/07/2016
ABSTRACT: The analysis of J. Forrester’s and V.I. Shiryaev’s works shows that the simulation results of work of a production-commercial system have nothing to do with the actual enterprise. Besides, there is no explanation why the amount of orders and stocks in the system changes. The authors with the use of the sequence theory have showed that the main reason for variety of changes and their duration is not the mechanism that attaches the rate of orders to demands of consumers and delays, which is hidden in a management system, but the tendency of the system towards restoring stocks or increasing amount of stocks. It is possible to attach the results of simulation to performance indicators of the actual enterprise. Moreover, a model can be developed that simulates the activity of an enterprise which develops its sales network. |
RESUMEN: El análisis de las obras de J. Forrester y de V.I. Shiryaev muestran que los resultados de la simulación de trabajo de un sistema de producción comercial no tienen nada que ver con la empresa real. Además, no hay ninguna explicación de por qué cambia la cantidad de pedidos y existencias en el sistema. Los autores con el uso de la teoría de la secuencia han demostrado que la principal razón para la variedad de cambios y su duración no es el mecanismo que fija la tasa de pedidos a las demandas de los consumidores y los retrasos, que se oculta en un sistema de gestión, pero la tendencia del sistema a restaurar las reservas o aumentar la cantidad de las existencias. Es posible fijar los resultados de la simulación a indicadores de desempeño de la empresa real. Además, puede desarrollarse un modelo que simula la actividad de una empresa que desarrolla su red de ventas. |
Today modeling (development of models) and subsequent simulation performance of entities are among the most common methods of studying the environment. The widest range of objects is simulated: from mechanical systems to social and historical processes. A huge number of works is devoted to the modeling of activities in organizations, which increasingly optimizing their activity try to bring it closer to the streaming process. The company starts to be considered a certain system of material, informational, financial and other flows. Therefore, modeling must include representation of logistics subsystems of an enterprise.
At the stage of simulation, and then while simulating the work of a subject of research there always are questions concerning development of a conceptual model and accurate representation of a real object, i.e. whether it is possible to use the results in order to change, modify or develop the object.
In order to resolve these issues in exact and technical sciences an experimental research is conducted and test cases are developed. We can assume that J. Forrester in his works has published test cases that were results of simulation at manufacture and commercial enterprise. V.I. Shiryaev has equaled the results achieved by J. Forrester.
However, J. Forrester has limited possibilities of simulation; he has announced that it allowed only representing a conceptual object of a study. Thus, he has set the task to develop a method for the purpose of models obtaining which describe real economic objects accurately.
Besides, it is necessary to study not only the reasons for unstable behavior of an enterprise but also the conditions that ensure its stable work if the environment itself is stable.
1.1. Problem setting
For economic objects modeling, Leontev’s [5] dynamic model, J. F. Neumann’s trunk model [4]; Loona’s model [7]; Forester’s dynamic model [1, 2] and others are used. [10]. The analysis of advantages and disadvantages of these models is beyond the scope of this article, so we have chosen J. Forrester’s dynamic model. The suggested simulation method seems to be appealing for us:
- the same approach is used for simulation of production processes, promotion of goods, information and financial flows, global dynamics;
- when developing models well-known terms of flow and stock adopted in logistics are used.
- simulation includes the development of common networks for the flow of materials, information, finance, etc. which are familiar to managers, economists and logistics experts;
- solution to equations are found quite simply.
1.2. Latest research and publications analysis
Before turning to today's publications let us refer to the work of J. Forrester [1]. We would like to highlight some incomprehensible theses for us.
First, it is unclear why he repeatedly emphasizes that the amounts of stock and flow are the same, although stock always exists for some period of time, and the flow is determined by a period of time. And although this point is made by the translation editor D. M. Gvishiani, its affirmation is repeated by V. I. Shiryaev [3]. Apparently, in the dependency suggested by J. Forrester stocks and flows are sometimes equal.
Second, quite often the flow or the stock can be considered constant, but it is not clear what constant values flows or stocks have. We can assume, for example, that for stocks it is the maximum or minimum allowable value, but it is difficult to understand what rate the flow has.
Third, there are some dependencies on which information and material flows are made. It is clear that they generate each other, but it is not right to just add and subtract them.
Fourthly, it is argued that the flow is determined by the stock level. Perhaps this corresponds to hydraulic analogies, but in trade (commerce) a volume of sales is determined by the demand for the goods but not by the stock of goods at warehouse.
Fifth, there is no such term as "backlog of orders at firm", or "backlog of demand". In the context of the research under these terms we understand that something is on order. The list of incomprehensible claims can be continued, but we will highlight only one - economic systems are not sustainable. As we understand they are quite stable, as they continue to operate during a crisis. Of course, this is due to management of these systems, which people are responsible for, and the management is aimed at keeping the systems structure and the modes of their activity.
It is necessary to emphasize that the model includes only one retail segment, one wholesale segment and one manufacture segment.
Let us analyze the results achieved by J. Forrester [1, 2] for manufacture and retail company supplies with 10% growth in orders. For example, it is unclear why production orders grow (the maximum value) to 51%, and finished products output grows up to 45%. The diagram shows that within two months (approximately) production capacity will increase by 30 – 35 %, which will require a corresponding increase in direct costs. Even if we assume that 10% growth of the labor intensity can be compensated by the growth of labour productivity [6], then further 20% of the growth could be possible only by hiring additional work staff and only in case of production capacity. Also 30-35% will increase the need for materials and energy. These efforts, however, will be extremely inefficient, since stocks of finished goods will increase by 7 - 10% at all levels.
It is interesting to compare the growth in a number of orders at production- commercial firm from one segment to another, which is a consequence of growth of orders in the commercial sector:
- from the commercial segment to the wholesale segment up to 18%;
-from the wholesale segment to the manufacture segment up to 34%;
-production orders are up to 51%.
The question arises whether this effect is a consequence of only the lag of information flows of the system, or is the result of this representation system. In reality, production systems (e.g. TPS (Toyota production systems)) aim at minimization or even exclusion of this effect in the planned production of only the ordered cars [6]. The work at metallurgical enterprises is planned the same way.
Having considered the influence of sinusoidal and abrupt changes in demand for products on the dynamics of a firm and the volume of production J. Forrester gives only one recommendation and it is to exclude the wholesale segment. The instability (amount and duration) of work will decrease significantly. However, warehouses apart from the delay of processing and redistribution perform a function that levels assortment and time; this requires a separate study.
The effect of the delay factors on the dynamics of the organization is very important. If we consider the results presented by J. Forrester as a test case then the value of delay must be kept. Nowadays the formation and transmission of an application may be calculated by minutes, and time of loading and unloading operations and transportation has decreased significantly. Even the planning of production, change of the production program can be carried out during working months [6]. Thus, the model is supposed to allow simulation of systems with any delay.
1.3. The research objective is to find a different equivalent of a system that is more understandable and vivid; and to understand the dynamics of the model.
Having examined the nature of the oscillations of orders we need to understand how to improve the model according to activities at an actual enterprise.
We need to develop a model of a manufacture-commercial firm based on the approach suggested by Forrester, which is close to a real enterprise.
We need to develop a business model that enables simulating its development.
In order to understand the reason for the increase in number of orders, and why they grow from segment to segment we use the sequence theory [8, 9], which is used to describe the flow of cars. Assuming that the driver can evaluate speed of a vehicle traveling ahead, the equation of motion in finite differences is following:
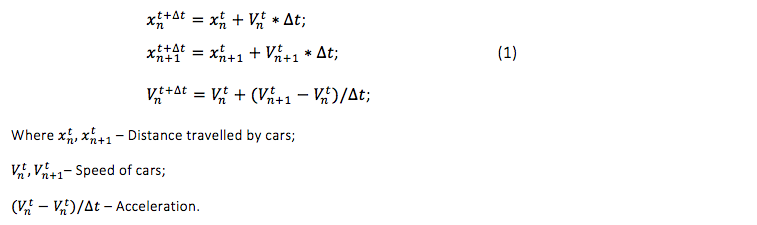
Thus, according to the theory if the driver realizes that a car going behind increases the speed, the he will try to align the car speed. If this equation is being integrated in finite differences, we will get that when the car traveling ahead changes its speed abruptly, the speed of the first car and the distance between them will increase (Figure 1). In order to record the time of driver’s reaction the acceleration is defined only from the moment when the acceleration of the first car exceeds the time of driver's reaction.
Let us transform the sequence theory, assuming that the driver can estimate the speed of the car coming behind him. If the car that follows him increases the speed, then in order to avoid collision the driver should increase the speed. Then the speed of a vehicle travelling ahead of the one that accelerates will be determined by:

As in the previous example, if the driver evaluates the speed, we will get that speed is going to equalize, and the distance between vehicles is reducing.
To maintain the distance between vehicles the driver is required not only to align the speed, he should increase the speed of his car over the speed of the following vehicle at time which is enough to restore the distance. Therefore, to maintain the stability of the traffic the driver should control the speed and the distance between vehicles:
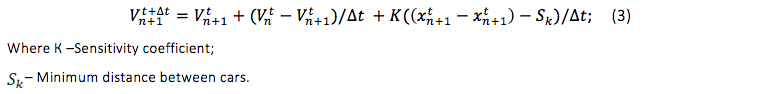
Having constructed the system of equations for four moving cars and having used it for 10% increase in the speed of the latter, we have had the following dependence (Fig 1, 2).
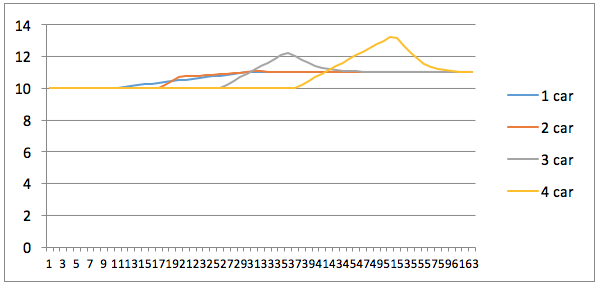
Figure 1 – change in the speed of cars during acceleration of the first car
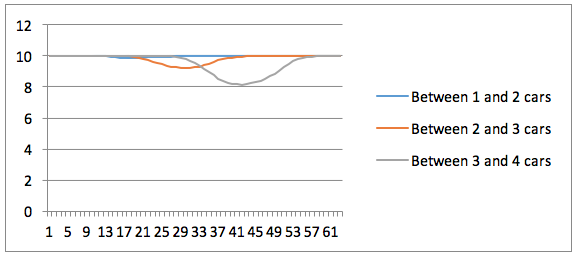
Figure 2 – change of the distance between the cars when the first car is accelerating
Thus, in order to stabilize the speed of the flow and the distance the second car has to increase speed by 13-%, third – by 22.4-%, fourth – by 32.3 - %. In fact, we have got the results that are similar to J. Forrester’s results; the speed of cars grows and it is easily explained.
The sequence theory can be interpreted for simulation of work at manufacture- commercial firm, if we think that the speed is the equivalent to the tempo (sales, orders, delivery), and the distance between cars is the equivalent to stocks.
Solving the system of three sequence equations for different values of sensitivity coefficients, we have realized that the main source of instability of the system is the orientation of the system to recovering not only the rate (speed), but stocks as well. In our model the recovery rate can be adjusted with the help of sensitivity coefficients making it closer to a real enterprise.
In order to conduct a further research, a model of a manufacture-commercial enterprise according to J. Forrester is presented (figure 3). In order to describe a manufacture-commercial firm there will be required: three elements simulating stocks of goods (commercial element Zc , wholesale element Zw and production warehouse Zp); three control elements between parts of the system Yc, Yw, Yp; and six delay elements that simulate the applications formation in commercial element Dс and in wholesale element Dw, the formation of the production plan Dpl and manufacture Dp, as well as transportation of goods from wholesale element to commercial element Dtc, from manufacture element to wholesale element Dtw.
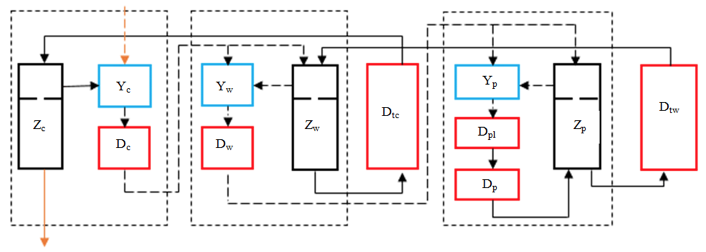
Figure 3 –simple model of a manufacture-commercial firm
To order goods from a commercial element, wholesale element uses: production orders from customers; sales rate; stock at warehouse; minimum stock level at warehouse:
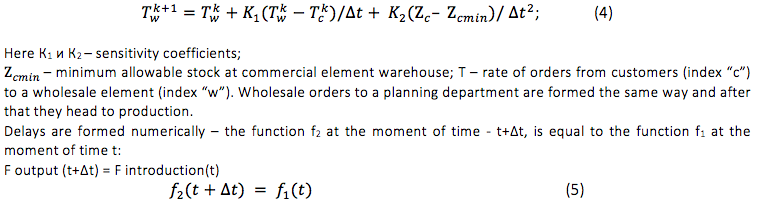
Graphically it is shown in figure 4.
First, we consider an example of a system response to 10% increase in the rate of requests for production in a case when the rate of orders to wholesalers depends on the tempo of buyer’s requests, so stock reduction in a commercial element is not accounted (K2 = 0); the rate of orders from a wholesale element to a production element and
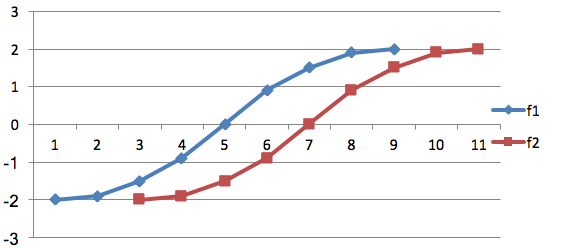
Figure 4 –delay formation
to production itself does not depend on stocks at wholesale element and at production warehouse. Goods are being sold when there is a demand for them. Delays in retail and wholesale are accepted being equal to one week. There are 2 weeks for planning and production. Transportation from production element to wholesale one and from wholesale element to commercial one takes correspondingly two weeks and one. The simulation results are presented in figures 5 and 6.
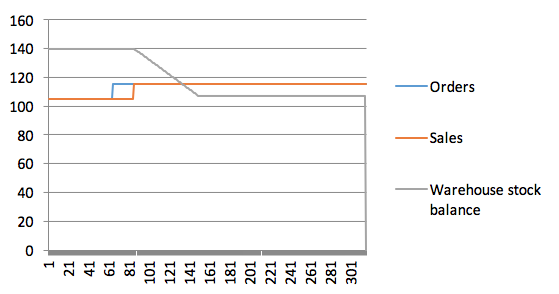
Figure 5 – Change in stocks at commercial element
As a result, we have come to the conclusion that with sufficient stocks at all elements the system will provide customers with goods according to the demand. Orders increase by 10% and so does production. Stocks decrease at all levels.
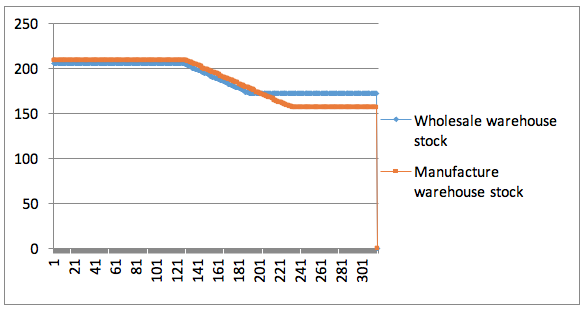
Figure 6 – Changes in stock at wholesale element and at manufacture warehouse
If a customer (buyer) agrees to wait until production starts delivering from a wholesale element, then stocks will not change in a retail element. If a time period is longer stocks will be standing at wholesale element and at production warehouse. These results can be confirmed by logical reasoning.

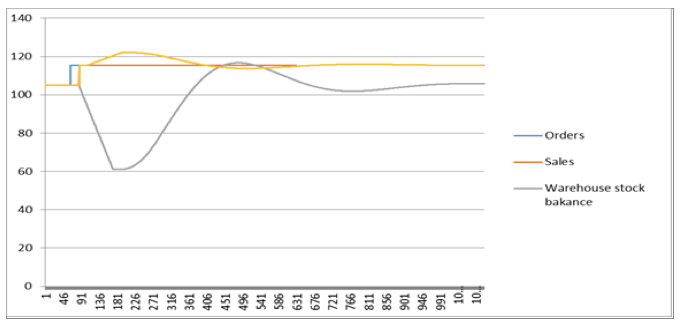
Figure 7 – Dynamics of indicators change in a retail element
------
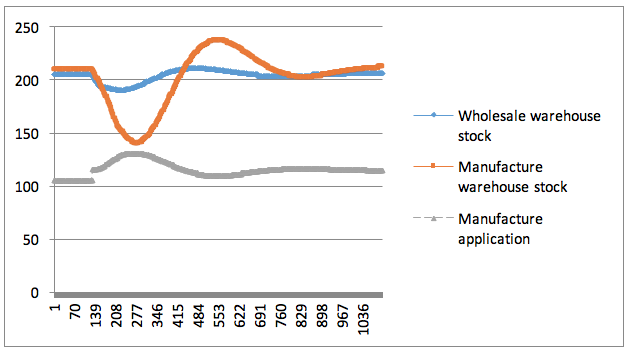
Figure 8 – Dynamics of indicators change in wholesale element and at manufacture
The results show that approximately in seven months after the increase in orders selected indicators will stabilize: stocks remain at the same level; production will increase by 10%.
On figure 9 there is a comparison of the changes in stocks at production warehouse within one year for different values of sensitivity coefficients. The calculations have showed a significant influence of the sensitivity coefficients on the amplitude of changes in the indices and on duration of unstable work of the organization. Therefore, in further studies it will be necessary to understand the economic (management) essence of the sensitivity coefficients.
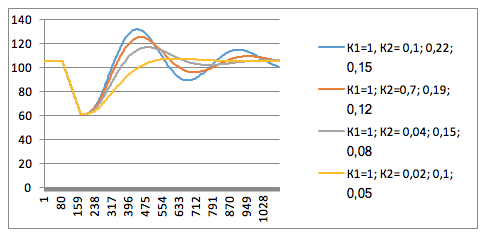
Figure 9 – Stocks dynamics at commercial element warehouse depending on the sensitivity coefficients
In the analysis of J. Forrester’s works we have observed that delays are very long especially at wholesale and retail levels of the organization. Today orders from retail level to wholesale level are delivered at the end of the working day, and a delivery from wholesale element to retail element takes a few days or hours. Is it possible to overcome the growth of orders in 2.5 times without any losses?
As the simulation shows (figures 10, 11), in this situation where there are enough stocks the organization will satisfy demand growth for products in 2.5 times within a period of 3-4 weeks - wholesale warehouse will perform its leveling function.
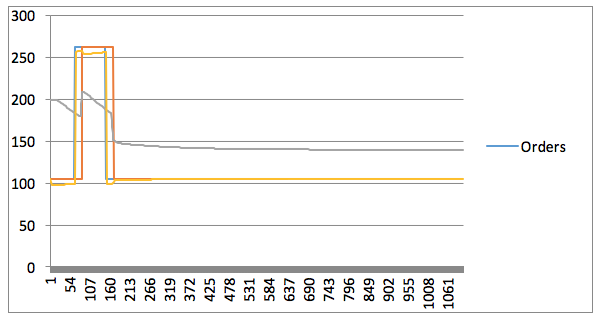
Figure 10 – Changes in stocks, orders, sales at commercial element with 2.5 times growth in orders
---
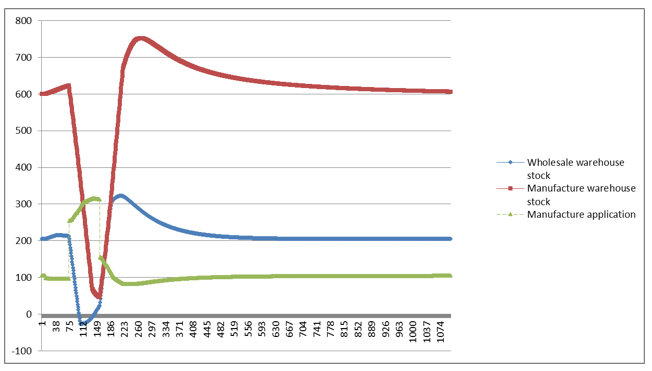
Figure 11 – Dynamics of indices in a wholesale element and a manufacture element with orders increasing in 2.5 times
We can come to the conclusion that the suggested model allows simulating the work of the organization dealing with goods with a significant (3-4 times) seasonal increase in demand, such as tires or oil. The further development of the approach can be about:
- development of models for organizations that develop own sales network;
- taking into account the type and the kind of vehicles that are used to deliver goods;
- taking into account a wide range of goods;
- taking into account behavior of the buyer.
One of such models is presented in figure 12, where all symbols are similar to those presented in figure 2. It is unique because it aims at simulating the work of the organization, which has several commercial elements. The model of every commercial element is similar to those models that are shown in figure 2. Thus, increasing the number of commercial elements it is possible to simulate development (growth) of the organization. The main difference lays in that part of the model, which reflects the functioning of wholesale element of the organization and the delivery of goods at retail. In this example, the delivery of a certain amount of goods is carried out with a help of one vehicle, along with a delay that is typical of this element. This scheme can be easily modified to the conditions of goods delivery by one kind or type of a vehicle according to one schedule. Thus, the suggested model allows simulating the work of transport at organization.
As the research shows, the approach to the simulation of systems suggested by J. Forrester can be adopted and applied to the study of developing economic entities. The evolution of models can be used to solve problems of transport logistics.
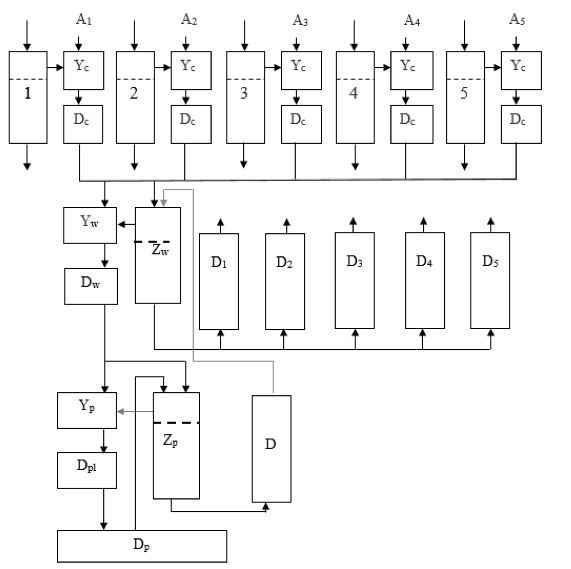
Figure 12 – The model which allows simulating development of an enterprise
In the article the analysis of methods of dynamic economic systems simulation has been carried out. On the basis of the simulation approach suggested by J. Forrester the model of a manufacture-commercial enterprise that develops its sales network has been presented.
It is necessary to understand that besides the demand, other destabilizing effects can influence the activity of a firm, these effects can be increased or decreased (be compensated), thus, another way of model improvement is the expansion of a list of factors that affect the work of the organization.
Forrester J., (1971), Basic of cybernetics at enterprise: industrial cybernetics: Translated from English. Moscow: Progress, 340 p.
Forrester J., (2003), World dynamics: Translated from English. Moscow: Izdatelstvo АSТ. 379 p.
Shiryaev V.I., Shiryaev E.V., Rogova E.F., (2002), Dynamic theory of a firm: Tutorial. Chelyabinsk: Publishing house SUSU, 188 p.
Von Neumann J. (1970), Theory of games and economic behavior. Moscow: Nauka.
Leontev V.V. (1997), Inter-industry economics: academic revision and introduction by A.G. Granberg. Moscow: Economics, 477 p.
Layker J . and . Mayer D. (2009), The practice of Tao Toyota. The implementation guide principles of Toyota management. Moscow: Alpina Pablisher, 584 p.
Loon P. (1983), A Dynamic Theory of the firm: Production, Finance and Investment. Lecture Notes in Economics and Mathematical Systems, Volume 218.
Zhang, Gens; Sun, D.-Hua; Liu, Hui; Zhoo, Min (2014), Analysis of drivers’ characteristics in car-following theory. Modern Phys. Lett., 28(24), 1450191, 11 pp.
Zhang, Gens; Zhoo, Min; Sun, D.-Hua; Wei-Ning: Li, Hua-Min (2016), Stabilization effect of multiple drivers’ desired velocities in car-following theory. Phus., A442: 532-540.
Blok, Mark W.J. (1996), Dynamic Models of the firm: determining optimal investment, financing and production policies by computer. Berlin; Heidelberg; Springer.1. South Ural State University (National Research University), Russia, Chelyabinsk. Email: 216449@gmail.com