
 HOME | ÍNDICE POR TÍTULO | NORMAS PUBLICACIÓN
 Espacios. Vol. 37 (Nº 32) Año 2016. Pág. 4
Juliana Januzi ROQUETTE 1; Quintiliano Siqueira Schroden NOMELINI 2; Bruno Cabral PIRES 3; Anna Monteiro Correia LIMA 4
Recibido: 10/06/16 • Aprobado: 12/07/2016
ABSTRACT: The aim of the present study was to analyze the use of statistical process control (SPC) and the capability index (Cpk) for assessing quality indices such as total bacterial count (TBC) and somatic cell count (SCC) of milk. Monthly data of milk were analyzed from 142 dairy farms. Results were compared via the analysis of means. Control charts were a more versatile evaluation compared to other methods applied. Cpk should not be used for assessing TBC and SCC. Our results show that it is not correct to use a single analysis for assessing indicators such as TBC and SCC. |
RESUMEN: El objetivo del presente estudio fue analizar el uso de control estadístico de procesos (SPC) y el índice de capacidad (Cpk) para la evaluación de índices de calidad como el recuento total de bacteria (TBC) y recuento de células somáticas (SCC) de la leche. Datos mensuales de leche fueron analizados de 142 explotaciones lecheras. Resultados se compararon mediante el análisis de los medios. Gráficos de control fueron una evaluación más versátil en comparación con otros métodos. CPK no debería utilizarse para la evaluación de la TBC y SCC. Nuestros resultados muestran que no es correcto utilizar un único análisis para evaluar indicadores tales como TBC y SCC. |
The demand for an increase in efficiency and the competitiveness of agribusiness led to the creation of more modern mechanisms of milk pricing, involving differentiated payments for the quality of the raw material, for the expected volume and even for the seasonality of the output. Most dairy plants separate producers monthly into groups according to quality indicators (total bacterial count (TBC) and somatic cells count (SCC)), assessing whether the milk has met the desired parameters. No dairy producers can constantly achieve these standard values, and this prevents the optimal separation of these producers and impedes planning for target quality improvement measures. There are several data analysis systems that dairy plants can use (Niza-Ribeiro et al., 2004; Reneau and Lukas, 2006; De Vries and Reneau, 2010; Takahashi et al., 2011; Takahashi et al., 2012), and the time has come for the dairy industry to use more complex statistical methods to improve producers’ ratings and efficiency in field actions. Thus, the present study aimed to use statistical process control (SPC) and the capability index (Cpk) for monitoring and evaluating TBC and SCC results from 142 dairy farms during one year.
The results of SCC and TBC from 142 dairy farms that constantly provided milk for the same dairy plant were monitored during one year. The dairy plant usually performs at least two monthly milk quality analyses of all dairy producers; all samples were collected according the company’s routine (IDF, 1995). TBC was determined by flow cytometry using a BactoCount IBC (Bentley Instruments Incorporated®, Chaska, USA) (Bentley, 2002). SCC was also determined by flow cytometry (IDF, 1995) using a CombiScope FTIR 400® (Delta Instruments, Drachten, Netherlands, 2008). First, the arithmetic mean was calculated for the TBC and SCC results during one year. Then, the arithmetic mean of the results along with its standard deviation were calculated, and values were presented as control charts (Montgomery, 2012). Additionally, the Cpk index for the results of TBC and SCC samples were calculated (Niza-Ribeiro et al., 2004).
Before choosing to use control charts, other methods, such as analysis of variance (ANOVA) of the database, were assessed. The residual assumptions were not met for ANOVA, even with transformations. The application of SPC using control charts for the means and standard deviations was performed using original data without concerns for its normality because according to the central limit theorem, the means follow a normal distribution (Montgomery, 2012).
As for Cpk, some tests and evaluations were used; TBC and SCC data went through the Kolmogorov-Smirnov test, confirming they were normally distributed. Additionally, histograms for Cpk evaluations were created, confirming that the SCC data also showed a normal distribution. Box-Cox transformation was used (Wheeler and Chambers, 1992; Wheeler, 1995), allowing the transformation of TBC data into symmetric data.
Initially, farms were separated according to the average of the results of TBC and SCC analyses and were then compared according to the mean and the mean and standard deviation. Dairy producers with good results and low variability, indicating quality and stability, were identified. Variability between the results of monthly quality indices was calculated; therefore, the smaller the limit set for the analysis of variability values, the more rigorous was the process of evaluating milk quality.
Producers identified through control charts were separated in groups using the SCC and TBC indexes of each farm. Producers were divided by TBC value as follows: Group A: TBC ≤ 100,000 CFU/mL; Group B: 100,000 CFU/mL < TBC ≤ 300,000 CFU /mL; and Group C: TBC > 300,000 CFU/mL. Producers were divided by SCC value as follows: Group A: SCC ≤ 250,000 cells/mL; Group B: 250,000 cells/mL < SCC ≤ 400,000 cells/mL; Group C: 400,000 cells/mL < SCC ≤ 600,000 cells/mL; and Group D: SCC ≥ 600,000 cells/mL. The analysis of TBC and SCC values over the year and the separation of groups allowed us to address actions according to the group the farm belonged to and to the milk quality indicators values these farms showed. Control charts of the present study were calculated and developed using Minitab® Release 14 (2004) software.
A control group was created from the assessment of the individual data of each producer belonging to the group with TBC values ≤ 100,000 CFU/mL on average per year and with SCC values ≤ 400,000 cells/mL on average per year. The same producers were assessed by analysis of the mean, mean and standard deviation, and Cpk. Control group producers were analyzed and classified as follows: good producer – had good values but no constancy; optimal producer – had a sequence of good analysis values, which were sporadically interspersed with a few bad results; and excellent producer – only good results.
Next, we more finely separated the two groups of producers with SCC ≤ 400,000 cells/mL (Groups A and B) to conduct Cpk analysis. Producers were divided according to SCC ≤ 150,000 cells/mL, between 150,000 cells/mL and 250,000 cells/mL, between 250,000 cells/mL and 350,000 cells/mL, and between 350,000 cells/mL and 400,000 cells/mL. This classification aimed to reduce the normal variation of SCC results.
The data set analyzed for TBC and SCC showed an arithmetic mean of 375.000 CFU/mL and 566.000 cells/mL, respectively. Some dairy plants separated their producers by production range and assessed the quality results per group, but this evaluation is not efficient because it makes it harder to measure the variation of results for each farm.
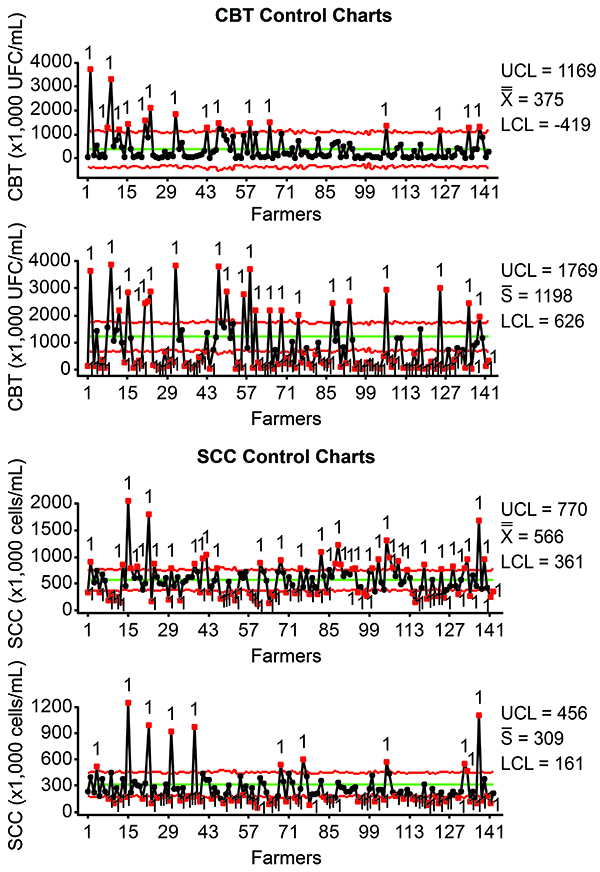
The means and standard deviations of both TBC and SCC samples of all producers are shown in control charts (Figure 1). The TBC results showed an average standard deviation of 1,198,000 CFU/mL, with an upper limit of 1,769,000 CFU/mL and a lower limit of 626,000 CFU/mL. These results show that TBC had a non-randomness pattern indicated by many points outside the control limits, which implies an out-of-control process due to uncontrolled variability.
There can be several causes for this lack of pattern and the instability of results, such as a lack of standardization during hygienic procedures performed on the farm; incorrect sampling of milk; incorrect sample preservation until arrival at the laboratory for analysis; and a lack of standardization of the method of analysis. It is important to verify, eliminate and monitor each one of these possibilities. After discarding the causes of high variation in the process, the points of non-randomness of the average charts should be inspected.
The average standard deviation of the SCC results was of 309,000 cells/mL; the upper limit was 456,000 cells/mL, and the lower limit was 161,000 cells/mL. Similar to TBC, SCC showed variability in the standard deviation values, as seen in the control charts (Figure 1).
Figure 1
Charts for mean and standard deviation of the total bacterial count (TBC) and somatic cell count (SCC)
during one year. In the figure, UCL refers to the upper limit, X to the mean and LCL to the lower limit.
Control charts can demonstrate the results of milk quality produced in a particular farm and can be used as a warning to managers who could act before the results get worse. Providing this tool can help in the interpretation of data by producers, thus helping in decision-making. Lukas et al. (2008b) found that when standards adopted by milk and dairy product-exporting countries (European Union countries and New Zealand) were considered, only 405 (27.5%) of the 1,501 herds were able to show SCC results consistently below the standard set for these countries (≤ 400,000 cells/mL) for 24 months. In the present study, 30 (21%) of the 142 herds monitored during one year showed SCC < 400,000 cells/mL, a result close to that presented by Lukas et al. (2008b).
Regarding TBC, when control charts were used for mean values and standard deviations, 91 (64%) of the 142 farms assessed showed values ≤ 300,000 CFU/mL (Brasil, 2011); however, only 59 (41.5%) showed constancy in the results. This evaluation could not be performed using Cpk because of high variability and uncontrolled statistical processes found for TBC and SCC values.
Both Takahashi et al. (2011) and Lukas et al. (2008a) showed that the use of the mean and variance of quality indicators are useful both for the producer and for the industry because they may warn about flaws in the quality standards, allowing proper corrective actions. With this information, the industry can also know which producers have a greater potential to violate quality standards.
Table 1
Percentage of producers divided according to the annual Total Bacterial Count
(TBC) and Somatic Cell Count (SCC) means and the type of evaluation
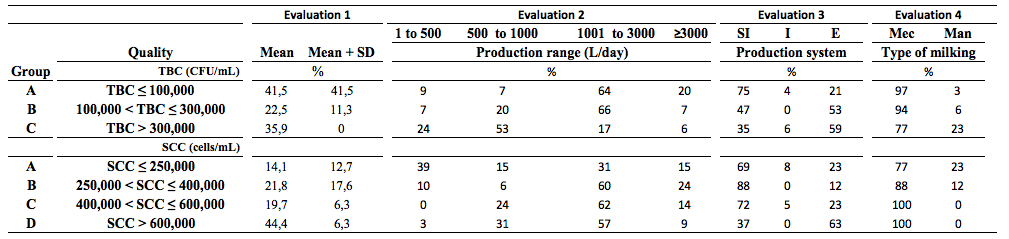
Evaluation 1: Comparison between types of analysis: only mean (Mean) or mean and standard deviation (Mean + SD).
Evaluation 2: according production range (liters/day);
Evaluation 3: according to production system (SI: semi-intensive; I: intensive, E: extensive);
Evaluation 4: according type of milking (Mec: mechanical milking; Man: manual milking).
Table 1 (Evaluation 1) shows the percentage of producers belonging to each TBC and SCC range during the analyzed year, along with the consistency of the results and a comparison between the two methods of evaluation, that is, only the mean or the mean and variance. Thus, low-variability deviations were those with < 300,000 CFU/mL (IN62) and < 400,000 cells/mL (limit set by European Union countries and New Zealand, milk and dairy product-exporting countries). Takahashi et al. (2012) and Lukas et al. (2008a, b) found that the highest SCC mean was related to greater variation of values. The same was also found in the present study, in which 121 (85.7%) farms that had an annual SCC average > 600,000 cells/mL also showed high variability of results. Low variability was found in 20 (14.3%) farms, but those had worse problems than instability because they were always outside of the standard range. Regarding TBC, all farms that had an annual mean above 300,000 CFU/mL showed high variability during the year.
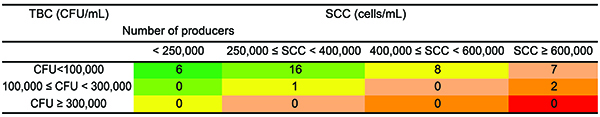
Under the TCB and SCC grouping scheme, we compared the data of both control charts to generate a more accurate set of data. These data were used to rate a farm as stable in relation to the quality of the milk produced; therefore, the TBC and SCC data of each producer belonging to each group were analyzed simultaneously (Figure 2). Only 22 (15.5%) producers showed good milk quality and stability, which can be translated as good monitoring of the herd and professionalism. Mertens (2009) warned that some evaluations gain strength when performed together, for example, two quality indicators that together define the product as belonging to a suitable standard or not. Thus, the type of product characterization, when assessed using the indicators separately, may give a false sense of meeting standards.
Figure 2
Scheme representing the number of producers belonging to the same TBC and SCC group. Uberlandia, Brazil, 2014.
Groups of quality results become camouflaged when analyses of variability are not performed. In the group of producers with TBC results between 100,000 CFU/mL and 300,000 CFU/mL, not all farms showed stability and belonged to this group throughout the year. For example, some could have high variability and therefore show an average result > 300,000 CFU/mL in a given month. Thus, they would be moved from this group to the group that had TBC results > 300,000 CFU/mL for that month. This situation may occur frequently and provide a false impression of stability. Using only the annual average result does not allow us to identify or even to realize that this variation of producers occurred between groups of results. This type of identification and characterization of producers is important because besides refining the data, it also directs the type of intervention and approach. The intervention should be directed towards increasing to maximum the number of producers meeting the desired standards, mainly < 100,000 CFU/mL, so that all producers can maintain the quality standards and so that good producers reach even better TBC standards.
It would be interesting to perform a specific approach or an action plan for stable producers – those with greater than 100,000 CFU/mL and less than 300,000 CFU/mL – because these are potential participants in the group of stable producers below 100,000 CFU/mL; furthermore, it would be interesting to perform a different action plan for producers > 300,000 CFU/mL, in which all are unstable.
According to our data, only eight producers showed a mean SCC < 400,000 cells/mL and high variability, so they would also benefit from an action plan. Another possibility is to act with the producers with a mean SCC between 400,000 cells/mL and 600,000 cells/mL. This group represents a good challenge but not as great a challenge as the group of producers with a mean SCC > 600,000 cells/mL and low variability, a group that always had bad results.
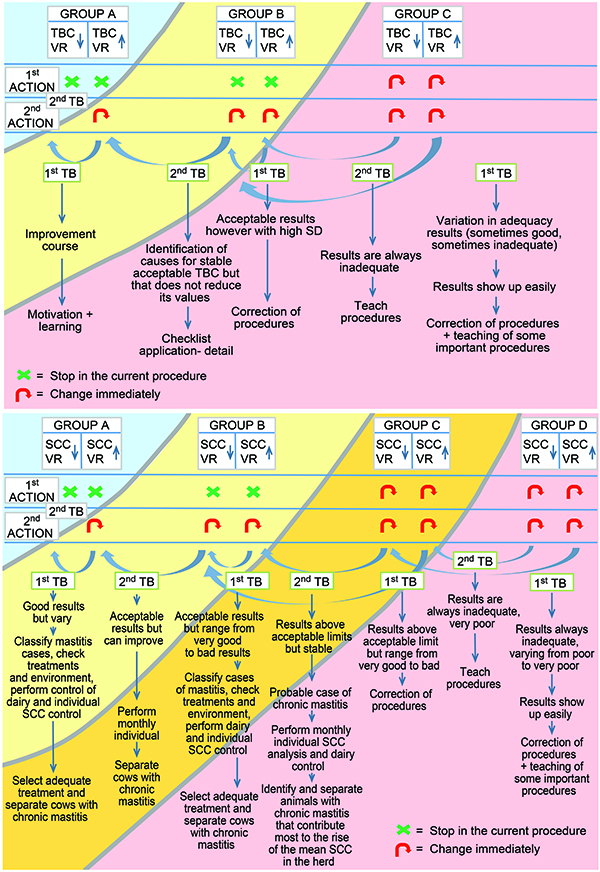
The identification and separation of farms that have difficulties achieving or maintaining the required quality standards help choose which actions should be performed on these farms. It also allows one to demonstrate, in detail, what the behavior was of each non-standard farm during the observed period, enabling an action to be performed together with the producer to identify sources of non-compliance. Dairy plants must act quickly upon non-compliance of established standards to ensure their milk quality. To do so, they must be accurate in identifying producers who are really outside of the limits. The analysis must become more refined, and the present study offers some possible methods for that. It would be impossible, due to the high number of producers per region, to analyze each producer separately on a monthly basis. Groups of producers separated by the range of results of milk quality, according to 2013 data, can form the foundation for studies on improving milk quality in 2014. From this group separation, it is possible to visualize milk quality in detail and plan what should be done in the short and long term for each group (Figure 3).
Figure 3
Flow chart of actions that can be performed after the separation and
characterization of TBC and SCC groups. Uberlândia, Brazil, 2014.
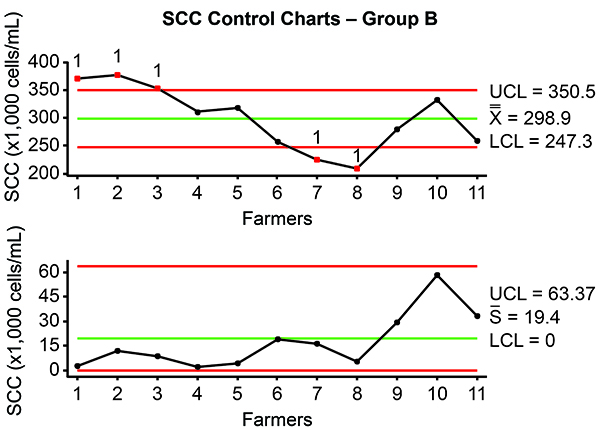
A control chart was created each month for each TBC and SCC group to extract data that would assist in creating strategies for the improvement of quality indicators. These control charts allowed us to see, for example, that the group of producers with milk analysis between 250,000 cells/mL and 400,000 cells/mL (Figure 4) showed a progressive improvement in the values during the year of the present study. They also showed low variability. Nevertheless, from the ninth month on, the results got progressively worse, suggesting that the group does not have a large number of animals with severe cases of chronic mastitis and most likely shares the same environmental insults. Dairy plants could improve in quality indicators and reduce the variability through visits that focus on the management and planning of rural properties. Dairy plants should inform livestock owners of critical issues that facilitate animal contamination by environmental agents.
Figure 4
Analysis of the mean and standard deviation of milk quality results from January to December 2013 (except March)
of a group of producers with an SCC greater than 250,000 cells/mL and less than or equal to 400,000 cells/mL.
Uberlândia, Brazil, 2014.
By analyzing the control charts, it was not possible to demonstrate clear evidence of a relationship between the behavior of quality indicator results and the month of the year. However, the provided data can be added to other data, which may provide a more accurate conclusion; these data include the average volume of milk produced by the farm, the production model used and even the type of milking (Table 1 – Evaluations 2, 3 and 4).
The group of farms with a TBC > 300,000 CFU/mL had a high number of farms that performed hand milking – 12 farms (23.5%). Furthermore, in the group of producers with a TBC < 100,000 CFU/mL, 47 farms (79%) had an intensive and semi-intensive production system. Among all farms monitored during the present study, 131 farms (92%) used mechanical milking.
Niza-Ribeiro et al. (2004) conducted a study of 414 farms during 13 months and found that the Cpk index was more efficient in the evaluation of farms than the average usually calculated by the dairy plants. These authors also found that the Cpk index can be used for estimating the rate of subclinical mastitis in the herd. Takahashi et al. (2011) found results similar to Niza-Ribeiro et al. (2004), where the mean values and Cpk of SCC described the farms differently. Takahashi et al. (2011) also found the same pattern for TBC: the measures of central tendency (mean and median) demonstrated that all 422 farms were within the ideal specification, while the Cpk index showed values lower than 1, indicating a non-suitable process, and that only 159 farms were classified as able to comply with established standards.
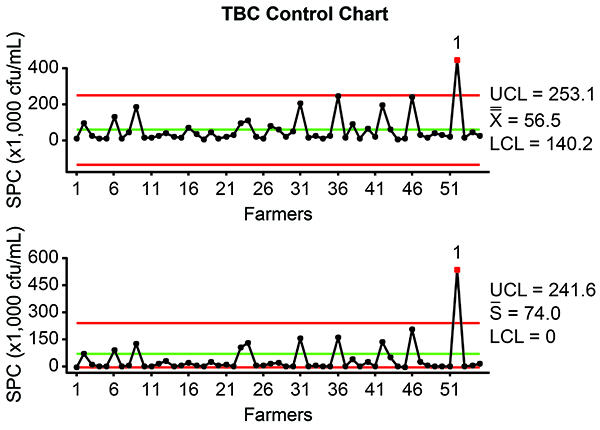
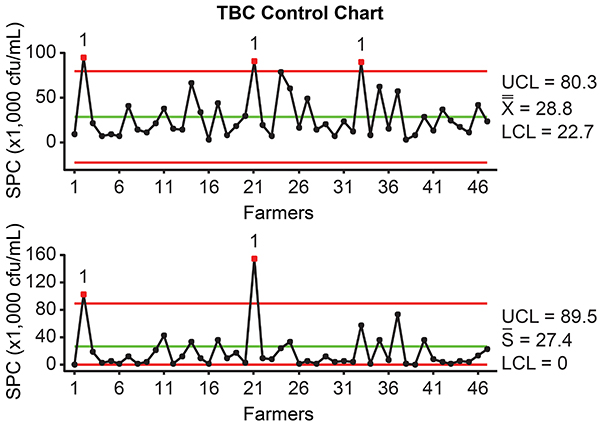
Figure 5 shows the control chart of TBC results from December 2013 of the group of producers below 100,000 CFU/mL. It shows that the process was without statistical control, so the Cpk index was 0.31, which is considered an unstable process. Seven producers were withdrawn from the sample to stabilize the group and improve milk quality (Figure 6); these producers should undergo intervention to improve their quality results. Nevertheless, this removal only raised the Cpk index to 0.79, lower than the desired value of 1.
Usually, studies try to apply different analyses and calculations to agribusiness, seeking more complex and accurate methods that assist in the evaluation of data and thus increase the efficiency of the business. The Cpk index and control charts are examples of this search. The evaluation that best illustrated the quality results was the mean and standard deviation because this result included the variability usually present in the TBC and SCC results. The Cpk index did not allow for a real evaluation in 100% of the cases, for example, producers 98 and 99. According to Cpk, producer 99 had better results than producer 98, but compared to the control group, producer 98 was better. The same situation occurred in other comparisons.
Figure 5
Analysis of the mean and standard deviation of quality results of milk from December
2013 of a group of producers with a TBC ≤ 100,000 CFU/mL. Uberlândia, Brazil, 2014.
----------
Figure 6
Analysis of the mean and standard deviation of quality results of milk from December 2013 of the group of producers with TBC
values ≤ 100,000 CFU/mL, except seven producers that were withdrawn from the sample for interventions to improve their quality.
Uberlândia, Brazil, 2014.
When statistical methods are used to reduce the variability between results and to allow for certain analyses, data are lost. If the Cpk index is used to assess the variation between the values of (1, 2 and 3) and (97, 98 and 99) in an interval with a lower limit of 0 and upper limit of 100, no significant difference is detected between these two groups because both of them have the same interval between consecutive vales and the same range. In addition, the Cpk index did not indicate that the TBC results of producers 97, 98 and 99 were the worst. It interprets that values are evenly distributed within the allowable interval.
Although different studies (Niza-Ribeiro et al., 2004; Takahashi et al., 2012) have stated that the use of the Cpk index is useful for evaluating TBC and SCC, Montgomery (2012) warned that Cpk analysis should only be used on samples under statistical control. Thus, as the TBC and SCC values are not under control due to variables inherent in milk production, this index should not be used for these indicators. This was clear when the following evaluation methods were compared: Cpk, control charts of the mean and standard deviation and control charts of the mean alone. The present study shows that Cpk is not suitable because of the normal variability of the results of TBC and SCC quality indicators.
Of the assessment methods evaluated, mean and standard deviation was the one that best represented the reality of each farm. As it is a good tool, control charts should be incorporated into a software program (which should be created specifically for this purpose) that could quickly process several datasets and provide a summary of problematic cows within a large herd or of producers that should receive intervention for quality improvement in an agribusiness.
The annual TBC or SCC average when analyzed separately is not enough for evaluating results of milk quality in dairy plants. Variability analysis is a necessary complement to the analysis of means. SPC was able to identify which producers had good quality during a given month and which producers were able to reproduce their results over the course of a year. Statistical tools such as control charts should be used by companies that receive milk to more efficiently judge the indicators of milk quality.
Bentley Instruments Inc. (2002). Bactocount 150 Operator´s Manual. Bentley Instruments Inc., Chaska.
BRASIL. (2011). Ministério da Agricultura, Pecuária e Abastecimento. Instrução Normativa nº 62 (IN62), de 29 de dezembro de 2011, section 1:6-11. Diário Oficial da União, Brasília.
De Vries, A., and J. K. Reneau. (2010). Application of statistical process control charts to monitor changes in animal production systems. Journal of Animal Science. 88: E11–E2. doi:10.2527/jas.2009-2622.
IDF – International Dairy Federation. (1995). Milk – Enumeration of Somatic Cell. Bulletin of International Dairy Federation, Brussels. IDF Standard 148 A).
Lukas, J. M., J. K. Reneau, and M. L. Kinsel. (2008a). Predicting somatic cell count standard violations based on herd’s bulk tank somatic cell count. part I analyzing variation. Journal of Dairy Science. 91:427-432.
Lukas, J. M., J. K. Reneau, C. Munoz-Zanzi, and M. L. Kinsel. (2008b). Predicting somatic cell count standard violations based on herd’s bulk tank somatic cell count. part II. consistency index. Journal of Dairy Science. 91:433-441.
Mertens, K.. (2009). [An Intelligent System for Optimizing the Production and Quality of Consumption Eggs Based on Synergistic Control]. PhD Dissertation. Kaholieke Universiteit Leuven, Leuven, Belgium.
Montgomery, D. C. (2012). Introduction to Statistical Quality Control. 7th ed. Wiley, Arizona.
Niza-Ribeiro, J., J. P. Noordhuizen, and J. C. Menezes. 2004. Capability index – a statistical process control tool to aid in udder health control in dairy herds. Journal of Dairy Science. 87:2459-2467. doi:10.3168/jds.S0022-0302(04)73370-6.
Reneau, J. K., and J. Lukas. (2006). Using statistical process control methods to improve herd performance. Veterinary Clinics North America: Food Animal Practice 22:171-193. doi:10.1016/j.cvfa.2005.11.006.
Takahashi, F. H., L. D. Cassoli, A. Zampar, and P. F. Machado. (2012). Variação e controle da qualidade do leite através do controle estatístico de processos [Variation and milk quality control through statistical process control]. Ciência Animal Brasileira, Goiânia. 13:99-107.
Takahashi, F. H., L. D. Cassoli, and P. F. Machado. (2011). Utilização do controle estatístico de processos (CEP) Como indicador de violação em programas de pagamento do leite pela qualidade [Use of statistical process control (SPC) as indicator of violation of the quality based milk payment program]. Ciência animal Brasileira 12:661-669.
Wheeler, D. J. (1995). Advanced Topics in Statistical Process Control: the Power of Shewhart’s Chart. SPC Press, Inc., Knoxville, TN.
Wheeler, D. J., and D. S. Chambers. (1992). Understanding Statistical Process Control. 2nd ed. SPC Press, Knoxville, TN.
1. Laboratório de Doenças Infecto-Contagiosas, Universidade Federal de Uberlândia (UFU), Uberlândia, MG, Brasil [Laboratory of Infectious and Contagious Diseases, Federal University of Uberlândia (UFU), MG, Brazil]. Corresponding author. Email jujanuzi@hotmail.com
2. Faculdade de Matemática, Universidade Federal de Uberlândia (UFU), Uberlândia, MG, Brasil [School of Mathematics, Federal University of Uberlandia, MG, Brazil].
3. Laboratório de Doenças Infecto-Contagiosas, Universidade Federal de Uberlândia (UFU), Uberlândia, MG, Brasil [Laboratory of Infectious and Contagious Diseases, Federal University of Uberlândia (UFU), MG, Brazil].
4. Laboratório de Doenças Infecto-Contagiosas, Universidade Federal de Uberlândia (UFU), Uberlândia, MG, Brasil [Laboratory of Infectious and Contagious Diseases, Federal University of Uberlândia (UFU), MG, Brazil].