
 HOME | ÍNDICE POR TÍTULO | NORMAS PUBLICACIÓN
 Espacios. Vol. 37 (Nº 30) Año 2016. Pág. 14
Filipe Pohlmann GONZAGA 1; Natan CHINI 2; Claudio Luis Cruz de OLIVEIRA 3; Gustavo MIRAPALHETA 4
Recibido: 30/0516 • Aprobado: 02/07/2016
ABSTRACT: Social networks, in particular Facebook, changed the way brands broadcast their messages and interact with their followers. In this new dynamic environment, it is crucial to understand how this interaction takes place. If this interaction takes place in some non-random fashion it would be possible to fine-tune the advertising messages to optimize their results or to minimize the effects of algorithmic changes in the hosting website. This paper aims in identifying neuroscience variables that have a high correlation with the way Facebook’s communication is designed, using neuroscience based statistical analysis to optimize the organic reach of a big Brazilian retail bank’s publications. This analysis is based on the research results of tests on selected individuals who performed a series of operations on the afore mentioned bank Facebook’s page and had their responses monitored by electroencephalography and eye-tracking. Besides that, each individual answered a survey, designed to collect data on the individuals. |
RESUMEN: Las redes sociales, en particular Facebook, cambiaron la forma de como las marcas transmiten sus mensajes e interactúan con sus seguidores. En este nuevo entorno dinámico, es fundamental entender cómo ocurre esta interacción. Si esta interacción ocurre en una manera no aleatoria sería posible afinar los mensajes publicitarios para optimizar sus resultados o para minimizar los efectos de cambios algorítmicos en el alojamiento de web. Este trabajo tiene como objetivo identificar las variables de la neurociencia que tienen una alta correlación con la forma como está diseñada la comunicación de Facebook, utilizando Neurociencia basada en análisis estadístico para optimizar el alcance orgánico de publicaciones de un gran banco minorista brasileño. Este análisis se basa en los resultados de la investigación de pruebas en individuos seleccionados que se realizó en una serie de operaciones en la página de Facebook del Banco y tenían sus respuestas vigiladas por electroencefalografía y eye-tracking. Además, cada individuo respondió a una encuesta, diseñada para recopilar datos sobre estos individuos. |
The Internet, in 2014, had around three billion users (SANOU, 2014), of which a large proportion are social media users. In this arena, Facebook is the leader in overall market-share with 1.44 billion users (NEWSROOM, 2015). If Facebook were a country, it would have the fifth largest population.
This trend is also present in Brazil, where more than 50% of its population has internet access (aprox.107.7 million), of which approximately 89 million are Facebook users, 66% of them accessing the site on a daily basis (FACEBOOK, 2014). This amount of users if translated into a physical population would make Facebook Brazil the thirteenth most populated country in the world, surpassing countries like Germany, Vietnam and Colombia. (ATLAS, 2014).
Facebook business model is based on pages designed by those who want to share information in its host site either on a paid or on a free of charge basis. In the first case (denominated Paid Reach), the content is charged on the users accounts whereas in the second case (denominated Organic Reach), content providers broadcast their messages to a broad audience, trying to make them fans of their page. When a user became fan of a page, its content is shared on the user´s page, increasing the brand reach.
Due to its large user base, the Organic Reach in Facebook can be a tremendous marketing communication tool, and any condition that can increase it, most certainly will have a positive impact not only in the company´s image but also in its bottom line results. This study presents the results of a research designed to identify several neuroscientific variables influence on Facebook Organic Reach of a big Brazilian retail bank publications.
In it, the activities of several volunteers were monitored by electroencephalography and eye tracking while they were surfing the bank’s Facebook page. To classify the behavioral (conscious) and physiological (non-conscious) patterns of the users, the activities were divided in two groups:
With these groups of variables, a statistical analysis was conducted to determine in which way the publications of the Bank on Facebook could improve in getting more user attention to them.
Marketers define digital presence as a set of channels and specific conversations about brands and companies taking place on the internet between users (PAUWELS et al., 2012). There are both paid and earned (organic) online media, being the paid media communication efforts to leverage the enterprise channels (e.g., display ads, paid search) and the earned media occurs when consumers become the channel (e.g., social networks, blogs) (CORCORAN, 2009). In Brazil, 98% of the companies have a digital presence (EUROMONITOR, 2013).
Toffler (1980) defines the prosumer as the consumer who is close to the company, sharing information about the products, considering that the internet is the second most used mean of communication in Brazil (BRASIL, 2014), the internet is a tool that enables greater proximity between companies and their consumers, leveraging the prosumer reach.
The Social Relationship Management (SRM) is the analysis of the relation between consumers and brands across different channels (ABREU et al. 2011), Facebook, with 89 million users in Brazil (FACEBOOK, 2014) is an important tool to build this relationship.
The internet generic layout is visually oriented, with Internet pages and social medias fully loaded with images and texts. In this context, the vision is the fundamental sense to understand the messages being broadcasted. The eye-tracking is one tool that enables one to, monitor the points where the eye is gazing (Zurawicki, 2010). There are four basic types of eye movements: saccades, smooth pursuit movements, vergence movements, vestibulo-ocular movements (Purves, D.. Augustine, G & Fitzpatrick, D 2001) and also fixation, being saccades when the eye moves from a fixed position (movement) and fixation when the eyes pause in a certain position (LAUBROCK et al. 2007).
The internet differs from other forms of media because the user has to freely choose paying attention to some content, while at the same time being exposed to different kinds of informations being presented to their visual field. (SIMOLA, et al. 2014), these informations might include advertising, other posts, etc. Since attention must be directed to each stimulus (TREISMAN and GELADE, 1980) it’s not possible to pay attention to multiple visual stimulus at the same time.
Being attention a mental faculty, brain research could provide a series of valuable measurements. In healthy humans, some possibilities of exploring mental states, according to Montagu and Coles (1966) are Functional Magnetic Resonance Imaging (fMRI), electroencephalography (EEG) or the measurement of physiological states, such as the galvanic skin response (GSR) that changes depending on the individual emotional state.
The fMRI monitor the blood flow in different areas of the brain (HICKOK, 2014), and by doing so it provides a dynamic and clear picture of brain activity. This occurs because the hemoglobin (responsible for oxygen and glycose flow) carries iron (MARZZOCO e TORRES, 2007), producing a magnetic field around it (ZURAWICKI, 2010). In cognitive processing, when there is an activation of a brain region, there’s a surge in blood flow in the area (MCCLURE et al, 2004), which can therefore be measure by a surge in the magnetic field in the surrounding are. This makes possible the observation of the area directly affected by the stimulus.
The EEG is a non-invasive technique to measure the cortex electrical activity (TIMO-IARIA and PEREIRA, 1971), which is a measure of frequency bands (Delta, Theta, Alpha, Beta and Gamma), being alpha the frequency comprehended between 8 and 13 cycles per second, considered normal for an adult in attention state (PINTO, 2015)
Facebook publications from a big Brazilian retail bank were analyzed, with the goal of creating statistical analysis for the posts organic reach. The correlation between the posts location in the bank’s Facebook page and the reaction (behavioral and physiological) that the person exhibits while surfing the page is essential to optimize the organic reach. In its turn this is essential for the bank to determine which kind of add and which budgetary amount it should invest in its page to either maximize the organic reach within a certain budget or to minimize the budget needed to achieve a pre-determined organic reach level.
The study was conducted along four interrelated areas. First, there was a data analysis of the bank Facebook page, to determine the posts metrics and if there were any correlation between them and the organic reach. After the analysis there was a research with EEG – to measure attention (which in an exploratory research was shown to be alpha activity in the bi-parieto-occipital lobes) – together with an eye-tracking test – to measure where the subjects were looking. Subsequently to it was made a survey, that collected personal data about the Facebook metrics. The results were statistically analyzed and checked for correlations with the publications organic reach.
Research Type |
Objective |
EEG e Eye-tracking |
Measure the attention time in each post and eye-gaze patterns |
Survey |
Analyze the subject perspective |
Figure 1: Research types and objectives (Produced by the authors)
This study was conducted by a partnership between ESPM Media Lab , and the afore mentioned bank, which granted access to their Facebook page data. This study was made easier by a desire from the bank’s top managers to understand the difference in performance between different publications in other words why some performed better in terms of higher organic reach.
The page organic reach analysis was done entirely in a single month to avoid the influence of changes in the Facebook algorithm. To gauge the effect of behavioral and physiological responses on organic reach it was developed a Shewhart chart, based on the formula (OLIVEIRA et al, 2013):
p + 3* √ (p*(1-p))/n for upper control limit ;
p - 3* √ (p*(1-p))/n for lower control limit.
In the above formula, p is the sample average and n the sample size. This way the publications could be classified as either above, within or below the expected organic reach range. Those on the upper or lower echelons (above or below the expected organic reach range) were analyzed in depth to understand what was going on with the users mind while they were surfing the page.
The survey variables were the ones Facebook uses as default for data extraction, regarding user generated content: Like, Share and Comment. Also, it was analyzed the user perception for which post he thought was the best and worst, publication grading and perception on the nature of the message. Before the survey subjects were analyzed regarding their attention and eye gaze.
For user generated data:
For user perception:
The brain electrical activity and eye gaze data were measured by EEG and eye-tracking devices.
Those two first groups of variables were than further explored with a survey, made after the subject had the EEG and eye-gaze tests.
The volunteers were gathered out of the Facebook users population, regardless of their previous perceptions of the bank page (both followers and non-followers). This study could be made with non-followers without interference because in the Facebook model all pages are similar changing the posts content produced by the page administrator, so only the content would be the novelty. The sample profile had a high diversification degree, which is something in agreement with the diversification level found on average among all Facebook pages. The research had 30 individuals, being 63% men and 37% women, with an average age of 26 years old and the sample having between 20 and 56 years old. The number of EEGs and eye-track experiments were limited to 30 due to budgetary and time constraints.
The study comprehended three evaluation tools: EEG, Eye-tracking and Survey. The results from those evaluations were than compared with the data extracted and analyzed from the bank Facebook page and publications data.
The EEG and the eye-tracking studies were made at the same time so it could provide data of the brain wave function and the looking direction of the person undergoing the test. After this experiment, each person had to answer a questionnaire to gauge its own perceptions.
The specificities of each tool are described below.
The study was conducted in a neurological clinic the EEG electrodes were set in position by a physician and after that, she left the room to avoid unwanted interferences in the results and a technician stayed during the process.
The equipment used for the electroencephalography was an electroencephalograph Brain Wave Digital, with 23 electrodes made of a mixture of silver. Its placement followed the international standard (10-20) with a specific conducting paste. The time constant, the low-frequency filter of 0,3 seconds and the high-frequency filter of 70Hz, the record speed is 3.0 cm / sec and the amplitude is 5uV/0.5mm.
The eye-tracking study was made with an Eye-Tribe hardware and the EyeProof software. The software stores and analyzes images giving a heat map result from the eye gaze. This software, when opened, starts with a quick data collection of the user (name, sex and age) following a calibration in order to adjust different eye physiognomies.
The individuals arrived at the clinic, had their electrodes set, with the conducting paste on their scalps by the physician and had their basal electrical activity measured for about 40 minutes, seated, with half of the time with eyes closed and the other half with eyes opened, in order to check if there was any pathology (such as ADHD, epilepsy, etc.).
After the basal measurement was done, it was followed by the eye-tracking procedure with the Facebook posts selected, this was done with the electrodes still on their scalps.
The posts were selected by the statistical analysis of reference publications for the month of September 2014, that were either above the upper control limit or below the lower control limit for their organic reach data.
The publications are stored as images (from print-screens) at the EyeProof server, so the individuals did not have to login into their respective accounts and still have a similar experience. The first image that appeared was a blank one, so it could have one more basal measurement, now with not just eyes opened, but a computer screen with lights on, in front.
After that the first post would appear (always in a random order of publications, to prevent bias) and the pace the subject wanted to see the images was on his command (by clicking the mouse or the right arrow on the keyboard) in order to have a natural environment for seeing Facebook posts.
When finished the publications selection the subject had the electrodes removed and was conducted to another room to perform the survey.
During the period when the subjects remained with the electrodes positioned on their scalps (basal+test measurements) it was kept track of time and any significant change on the EEG (closed and open eye periods and tracking positions for each post). The total study time for each subject was very different since every individual was responsible for post changing when in contact with the Facebook publications, so the full time was a sum of basal (around 40 minutes) and test.
Subsequently to the EEG and eye-tracking study, the individuals participated in an individual survey, conducted at another room.
The objective of this survey was to recreate, offline, the behavior user would have on Facebook, with all print screens reproduced in the paper, side by side, in an enumerated order. The individual was required to see again the images and respond to questions made by an interviewer regarding:
Due to the fact that the individuals came from a wide range of educational backgrounds the images were always at the individuals disposal. In case an individual did not understand a question, it was than explained in detail by the interviewer.
The bank Facebook page is growing the number of likes (followers), growing 66% between January 2013 and October 2014 (Figure 2).
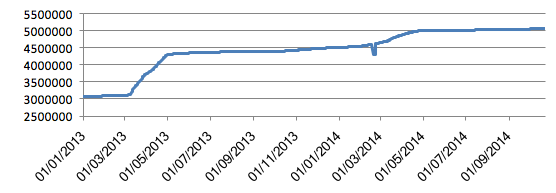
Figure 2 – Total Likes: Bank’s Facebook Page (Produced by the authors)
In contradiction to expectations, that a bigger number of likes would bring a higher organic reach because more people following the page would mean more people in contact with the page publications, we found that despite the growth in page likes, there is a plunge in the organic reach for the same period. In figure 3, it’s shown that the page organic daily reach felt 70% if we compare September 2013 and 2014. This decrease happened because of a strategy from Facebook to make companies pay to have higher reach. It was deployed by Facebook through an algorithm change, that limited the brands publication organic reach in order to make corporations pay to reach a bigger audience (MCQUILKEN, 2014).
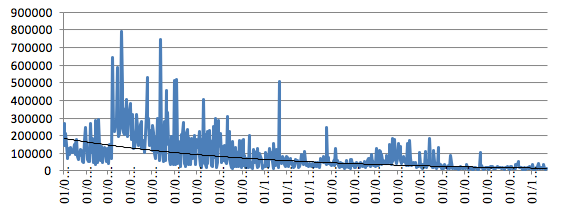
Figure 3: Page Organic Daily Reach (Produced by the authors)
In order to elaborate the Shewhart chart for the publication selection, because of the posts organic reach large amplitude, it was selected an specific time frame. It would be impossible to have a Shewhart chart with all the data collected since all recent posts would be below the lower control limit. So, for the analysis, was selected the month of September 2014, the last full month before the beginning of the research. The selected posts were the ones above the upper control limit (UCL) and below the lower control limit (LCL).
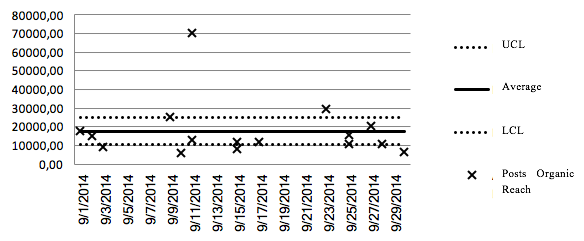
Figure 4: Shewhart Chart: Posts Organic Reach (Produced by the authors)
Considering dependent variables the input from Facebook (data from the page), the most important one is the reach. Because, in order to a publication be commented, shared or liked it’s fundamental to have views, the user cannot interact with not seen posts.
With 0,17% significance, given that significance a significance below 5% is the expected for a reliable analysis (REIS, 2003) and a 0,91 correlation between shares and posts organic reach (being this share the input from Facebook data, not the survey result from user consideration of sharing), meaning that users sharing posts have a high implication on the publication organic reach.
The average attention time, or, the average time in seconds of mixed alpha/beta brain waves with suspected and grouped aspect in the bi-parieto-occipital region, measured with an EEG, has a 1,44% significance and 0,81 correlation with the posts organic reach. Also, the attention time has a 0,25% significance and 0,90 correlation with the shares from the input Facebook data, meaning that users tend to share images that they pay more attention.
Other variables studied do not have significance or correlation relevant in order to be analyzed as important influencers on posts organic reach.
The immediate gift variable is also an important factor, that impact the two significant variables (shares and attention), with, respectively for shares and attention, 0,89% and 1,29% significance with 0,84 and 0,82 correlation.
Eye-tracking results are measured by a heatmap at the publications print screens, looking at figure 5, being red the focal points subjects spent more time looking going through orange, yellow, green and blue scales, being the last one the least time points.
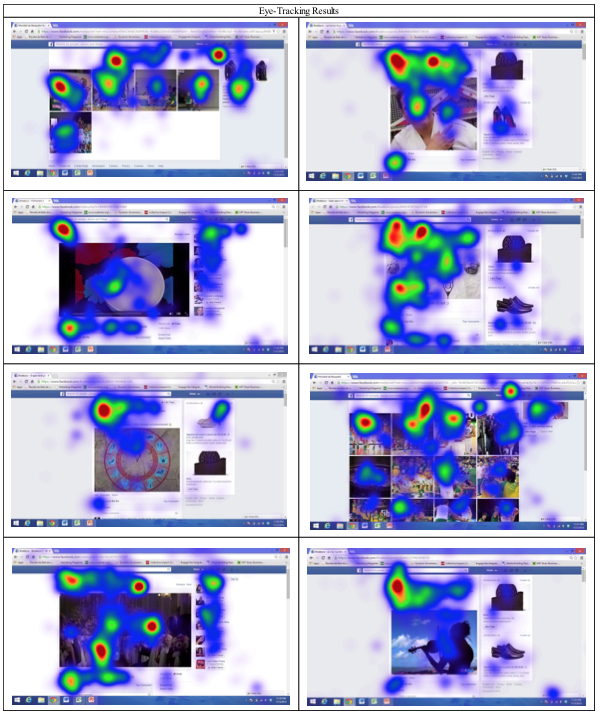
Figure 5: Eye-tracking Results (Produced by the authors)
With recent changes in the Facebook algorithm, to minimize the posts organic reach from commercial pages (HEINE, 2015), maintain the Facebook as an effective communication tool became a hard challenge. This research aims to collaborate to this issue identifying neuroscience variables that influence on the Facebook organic reach.
The chosen research method explored both user perception and attention. The methodology had a few limitations like the sample size, budget and study timing.
Even with all those difficulties, it’s possible to show neuroscience variables that correlate with Facebook communications, specifically regarding the growth of the posts organic reach since there are differences between publication reach the ideal is to invest resources in a publication with a higher probability of being above the upper control limit.
Statistical predictive analysis cannot count on the input data from Facebook shares and organic reach, therefore, to optimize Facebook communication it’s crucial keep in mind that posts with high attention (measured with an EEG) has a high probability of reaching, organically, a higher audience. Also noted that with indirect influence to attention there’s the immediate gift.
Hence, after the post content being created (from imagery to text) should be done an electroencephalographic study to measure attention. Content with higher attention time must have higher efforts to publish because they tend to grow more organically, maximizing reach results, or could lower the paid reach, reducing the budget for the publication. Furthermore, those posts (with high measured attention) will look more natural at the users homepage (when it’s from paid reach) because they are more likely to be shared with friends.
ABREU, Diego Andrade de e NAZIOZENO, Kaio Henrique F. - Marketing Digital: As mudanças no mercado e no comportamento do consumidor com o advento da internet. Universidade Federal Fluminense, 2011.
ATLAS, População por País, 2014. Available at: <http://www.worldatlas.com/aatlas/populations/ctypopls.htm>. Accessed in: Oct 11, 2014.
BRASIL. Presidência da República. Secretaria de Comunicação Social. Pesquisa brasileira de mídia 2014 : hábitos de consumo de mídia pela população brasileira. – Brasília : Secom, 2014.
CORCORAN, S. Defining Earned, Owned and Paid Media, 2009. Forrester Blog. Available at http://blogs.forrester.com/interactive_marketing/2009/ 12/defining-earned-owned-and-paid-media.html, accessed in: Jan, 13, 2015.
FACEBOOK. Oito em cada dez brasileiros com acesso a internet usam o Facebook, 2014. Available at: <https://www.facebook.com/business/news/BR-Oito-em-cada-dez-brasileiros-com-acesso-a-Internet-usam-o-Facebook>. Accessed in: Aug 11, 2014.
FORBES, The World’s Biggest Public Companies, 2015. Available at: <http://www.forbes.com/global2000/list/#page:1_sort:2_direction:asc_search:_filter:All%20industries_filter:All%20countries_filter:All%20states>. Accessed in: Jun 17, 2015.
HEINE, Christopher. Facebook Tweaks Cause Concern Among Marketers, but Not Necessarily Panic, 2015. Available at:
< http://www.adweek.com/news/technology/facebook-tweaks-cause-concern-among-publishers-not-necessarily-panic-164213?utm_source=sailthru&utm_medium=email&utm_term=AWK_TodayTech&utm_campaica=Adweek_Newsletter_2015152208>. Accessed in: Apr 22, 2015.
HICKOK, Gregory. The Mith of Mirror Neurons. Nova Iorque: W.W. Norton & Company, inc., 2014.
INTERBRANDS, Marcas Brasileiras mais Valiosas, 2015. Available at: <http://www.rankingmarcas.com.br/>. Accessed in: Apr 14, 2015.
LAUBROCK, J.; ENGBERT, R.; ROLFS, M.; KLIEGL, R. Microsaccades are an index of covert attention: Commentary on Horowitz, Fine, Fencsik, Yurgenson and Wolfe. Psychological Science, v.18, p.364-366, 2007.
MARZZOCO, Anita; TORRES, Bayardo. Bioquímica Básica. Rio de Janeiro: Guanabara, 2007.
MCCLURE, S.M.; YORK, M.K; MONTAGUE, P.R. The Neural Substrates of reward processing in humans: The modern role of fMRI. The neuroscientist, 2004.
MCQUILKEN, Toni. Facebook Brands No More Free Rides, 2014. Available at: <http://www.adweek.com/news/advertising-branding/facebook-brands-no-more-free-rides-161587?utm_source=sailthru&utm_medium=email&utm_term=AWK_AdBrand&utm_campaign=Adweek_Newsletter_2014342115>. Accessed in: Nov 24, 2014
MONTAGU, J.D.; COLES, E.M. Mechanism and measurement of the galvanic skin response. Psychological Bulletin, 1966.
NEWSROOM. Company info. 2015. Available at: <http://newsroom.fb.com/company-info/> Accessed in: Apr 8, 2015.
OLIVEIRA, Camila Cardoso de et al. Manual para elaboração de cartas de controle para monitoramento de processos de medição quantitativos em laboratórios de ensaio, 2013. Available at: <http://redsang.ial.sp.gov.br/site/docs_leis/pd/pd11.pdf>. Accessed in: Oct 14, 2014.
PAUWELS, K.; SRINIVASAN, S.; RUTZ, O.; BUCKLIN, R. The Hierarchy of Effects HOE Meets Paid, Earned, and Owned POE: How Do Internet Media Work to Drive Brand Sales?, Working Paper, Boston University, 2012. Available at http://pages.stern.nyu.edu/~atakos/MMP2P/presentatio ns/ssrinivasan.pdf in Jan, 1th, 2015.
PINTO, Luciano Ribeiro. O Eletrencefalograma. Available at: <http://www.psiquiatriageral.com.br/laboratorio/eletrencefalograma.htm>. Accessed in: Mar 11, 2015
Purves, D.. Augustine, G & Fitzpatrick, D. Types of eye movements and their functions, Neuroscience 2nd edition. Sunderland, MA: Sinauer Associates, 2001
REIS, Marcelo Menezes. Conceitos Elementares de Estatística, 2003. Available at: <http://www.inf.ufsc.br/~marcelo/intro.html> Accessed in: May 11, 2015.
SANOU, Brahima. Telecommunication Development Bureau (BDT). 2014. Available at: <http://www.itu.int/en/ITUD/Statistics/Documents/publications/mis2014/MIS2014_without_Annex_4.pdf> Accessed in: Apr 08, 2015.
TIMO-IARIA, César e PEREIRA, Walter Carlos. Mecanismos das ondas elétricas cerebrais, 1971. Available at: <http://www.scielo.br/scielo.php?script=sci_arttext&pid=S0004-282X1971000200001>. Accessed in: Mar 23, 2015.
TOFFLER, Alvin. The Third Wave. Nova Iorque: Morrow, 1980.
TREISMAN, Anne M., GELADE, Garry. A feature-integration theory of attention. Cognitive Psychology, Volume 12, Issue 1, p. 97-136, 1980
ZURAWICKI, Leon. Neuromarketing Exploring the Brain of the Consumer. New York: Springer Heidelberg Dordrecht London New York, 2010.
1. Escola Superior de Propaganda e Marketing, Email: filipepgonzaga@gmail.com
2. Escola Superior de Propaganda e Marketing, Email: natan_chini@hotmail.com
3. Escola Superior de Propaganda e Marketing, Email: coliveira@espm.br
4. Escola Superior de Propaganda e Marketing, Email: gmirapalheta@espm.br
5. The media laboratory of ESPM, a University based in São Paulo, Brazil focused on communication, business administration and related areas