HOME | ÍNDICE POR TÍTULO | NORMAS PUBLICACIÓN
 Espacios. Vol. 37 (Nº 30) Año 2016. Pág. 3
Mariane Cásseres de SOUZA 1; Thiago Antonio SOUZA 2; Guilherme L. R. VACCARO 3
Recibido: 28/05/16 • Aprobado: 24/06/2016
ABSTRACT: The number of hospital beds is a significant constraint on the operation of healthcare services because it receives demands from various areas and requires larger volumes to implement and maintain. The theory of constraints (TOC) seeks to map and act on constraints, thereby contributing to the mitigation of waste and the root causes of undesirable effects (UEs). This paper presents a study of a large Brazilian hospital that aims to improve the management of the number of hospital beds using the TOC. The method was exploratory and descriptive; it focused on applying the current reality tree (CRT) to alleviate the UEs related to the low availability of hospital beds. The primary results promote a greater understanding of the present problems in the management of hospital beds and serve as a basis for future work to improve healthcare services. |
RESUMEN: El número de camas de hospital es una limitación significativa en el funcionamiento de los servicios sanitarios ya que recibe las demandas de diferentes áreas y requiere grandes volúmenes para implementar y mantener. La teoría de restricciones (TOC) busca mapa y actuar sobre las limitaciones, contribuyendo a la mitigación de los residuos y las causas de efectos indeseables (UEs). Este papel presenta un estudio de un gran hospital brasileño que pretende mejorar la gestión del número de camas de hospital con el TOC. El método fue exploratorio y descriptivo; centrado en la aplicación del árbol de realidad actual (CRT) para aliviar las UEs relacionados con la baja disponibilidad de camas de hospital. Los resultados primarios de promoción una mayor comprensión de los problemas presentes en la gestión de camas de hospital y servirán de base para el trabajo futuro mejorar servicios de salud. |
Healthcare is one of the most important economic sectors in Brazil and throughout the world. Healthcare investments represent approximately 9% of the Brazilian gross domestic product (GDP) and 17% of the US GDP according to the World Health Organization (WHO) in 2011 (ANAHP, 2014). Given its relevance and the amount of money invested, healthcare system managers have faced the challenge of reforming their organisations since the 1980s, given the fewer available resources for this sector, the rising costs of hospital/medical care, and demographic changes among the population (VIACAVA et al., 2004). Globally, the predominant healthcare systems are failing because they are not addressing the trend of declining acute problems and rising chronic conditions (ORGANIZAÇÃO MUNDIAL DA SAÚDE, 2003).
Despite a growing awareness of the importance of healthcare quality in Brazil, it must be advanced significantly to ensure consistently high standards (PAIM et al., 2012). Therefore, it is necessary to understand every part of the system; monitor processes and results; and have reliable, up-to-date, and relevant information, which are essential elements to manage healthcare systems and services (SCHOUT, 2007).
Contextually, the Brazilian healthcare system is composed of a complex network of service providers and purchasers who compete with each other, thereby creating a public-private system primarily funded by private resources (PAIM et al., 2012). Health policies stimulated the Brazilian private sector to privatise healthcare through medical offices, compensation, and the creation of specialised diagnostic clinics, hospitals, and healthcare plan and insurance incentives (PAIM et al., 2012), especially after the Brazilian federal constitution of 1988, which established the National Regulatory Agency for Private Health Insurance and Plans (Agência Nacional de Saúde Suplementar; ANS), and the current bases of the unified health system (GAMA, 2002). The representativeness of the private sector within the Brazilian healthcare system can be demonstrated by illustrating that amongst more than 450,000 of the country's hospital beds, 64% are in private institutions, and 57% of this infrastructure is available to the public sector (ANAHP, 2014).
Criticism centred on the provision of healthcare services emphasises the importance of directing healthcare systems to meet "consumer demand"; thus, performance assessment becomes an important instrument of this restructuring. However, the critical question is how to measure such performance in terms of quality, efficiency, and equality, thereby establishing performance management systems to promote changes that achieve better results (HURST, 2002; VIACAVA et al., 2004). These issues are encountered globally (from the viewpoint of the healthcare system) and locally (from the perspective of how service providers, public or private, are structured; e.g., hospitals and clinics).
The complexity of hospitals makes measure productivity difficult with a single index; therefore, a set of indicators is necessary (BITTAR, 1996). The duality that generates trade-offs between the scale of care and the sustainability of hospital operations is inserted into this context. Typically, high quality and fast service requires idleness or high efficiency, which increases costs, reduces margins, and might compromise the operation on the medium term. In addition, multiple specialities and functionalities of a hospital are generally organised into specialised centres or institutes. Because of this complexity, hospitals traditionally measure their performance using only quantitative indicators with production data from each sector, namely, the number of outpatient visits, surgeries, hospitalisations, and other types of care that can engender an artificial notion of efficiency with regard to certain medical services (SABBADINI et al., 2006).
The complexity of the healthcare sector requires that service providers use a management model that fosters continuous improvement, quality, safety, and process efficiency and that is auditable and transparent (ANAHP, 2014). Alternatively, the theory of constraints (TOC) offers a method of identifying, analysing, and solving problems (ANTUNES et al., 2004). One of its fundamental principles is the search for improvements associated with restrictions (i.e., elements or factors that limit the capacity to generate value) within a system. One important difference between the industrial and health environments is that the value-added object in a hospital is a human being; therefore, the application of TOC principles involves new connotations concerning the goal to be achieved (e.g., the importance of patient satisfaction and their perceptions of service quality; SABBADINI et al., 2006).
Moreover, the performance of healthcare services is always criticised and questioned given its social function. Urgent care and emergency services (BITTENCOURT; HORTALE, 2009), followed by the lack of hospital beds because of overcrowded emergency rooms and the misuse of existing resources, are especially criticised (BRADLEY, 2005; ARAUJO, 2013). Previous studies have concluded that the primary marker that contributes to hospital overcrowding is the increase in the length of stay at hospital emergency services, and the lack of inpatient beds is the major cause of this overcrowding (BITTENCOURT; HORTALE, 2009). According to the Commitment to Hospital Quality (Compromisso com a Qualidade Hospitalar; CQH) Newsletter, the average patient stay requiring hospital beds was 3.8 days from July to September 1993 (BITTAR, 1996). According to latest data (AMARAL III, 2014), the average length of stay at Cancer Hospital (Hospital do Câncer; HC) was 20.4 days without discounting the mean delay.
In the current study, hospital bed management is analysed from the perspective of the TOC. The focus of the study is a large, private, non-profit hospital in operation for approximately 35 years, consisting of 9 units distributed between the capital and rural cities of Rio Grande do Sul. This hospital has the following medical departments: emergency, intensive care unit (ICU), dialysis centre, maternity ward, neonatal ICU, obstetric centre, surgical ward, and blood bank. This hospital also has more than 370 beds. Therefore, this study is qualitative and descriptive, evaluating the low availability of beds in the hospital, especially with regard to constraints and their undesirable effects (UEs) by applying the TOC tool, the current reality tree (CRT). The remainder of this article presents an initial bibliographic framework related to healthcare systems, hospital beds, and TOC concepts; furthermore, it provides examples of its application to the healthcare sector. Then, the primary hospital study is presented, demonstrating the steps used and their results. Finally, a discussion is presented including the final considerations related to the application.
A healthcare system is defined as a system that
"... encompasses all of the activities whose primary purpose is to promote, restore, or maintain health... and it include(s) patients and their families, the healthcare workers and caregivers within organisations and the community, and the health policy environment in which all health-related activities occur” (KOTLER, 2010, p. 35).
The Brazilian healthcare system is divided into three subsectors (PAIM et al., 2012): (i) the public subsector in which services are funded and provided by the government; (ii) the private subsector in which services are funded by governmental or private funds; and (iii) the supplementary health subsector, which includes different types of health insurance plans and policies as well as tax incentives.
Hospitals can be defined as healthcare establishments with differentiated services, including an inpatient capacity; outpatient care with regular consultations; and emergency, diagnostic, and therapeutic services that aim to provide the population with medical care and rehabilitation. According to the Ministry of Health (2014), Rio Grande do Sul currently has 377 hospitals spread across 274 of its 496 municipalities. These organisations are mostly concentrated in the metropolitan area of Porto Alegre because of its high population density, with approximately 37% of the total state population distributed across its 32 municipalities.
Healthcare system organisations have faced problems related to hospitalisations and, specifically, to guaranteed access for the users who need them. Approximately 7% to 9% of the population requires hospitalisation each year. According to Coleman, Irons, and Nicholl (2001), the occupancy rates of hospital beds exceed 100% in some cases. The unpredictable demand of this resource combined with the variety of patient health conditions cause service peaks, thereby resulting in the need to use extra beds and stretchers in the corridors of the emergency department and have bedridden patients stay for periods longer than their pathological care requires.
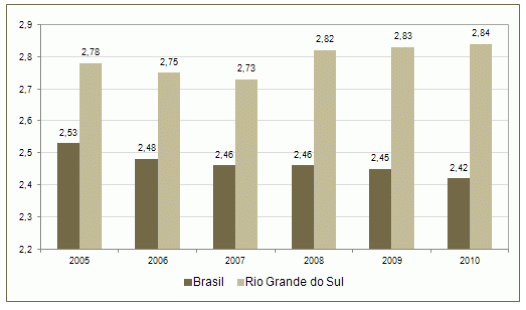
Rio Grande do Sul has higher hospitalisation rates than the Brazilian average, and it is currently the state with the third highest number of beds (2.84 beds per 1,000 inhabitants), following only Rio de Janeiro and Goiás with 3.09 and 2.94 beds per 1,000 inhabitants, respectively.
Hospital organisations and the services they provide to the population must be managed based on the number of available beds. The overcrowding of emergency services and the restriction of beds affects the healthcare of the population (BRADLEY, 2005). Historical HC data indicate an increase in the number of employees per bed: in 1977, there were 3.2 employees per bed; in 1988, there were 5.8 employees per bed; currently, there are 7.1 employees per bed (BITTAR, 1996).
When the flow of patient treatment at a hospital is observed, a series of procedures exists (e.g., records, outpatient consultations, diagnostic examinations, and therapeutic procedures) that comprise a linear sequence of events or a chain of interdependent processes. However, each link of this chain has the ability to perform its respective activity at a different mean service rate. Importantly, this chain is only as strong as its weakest link, which corresponds to the process with the lowest average rate of treated patients (SABADINNI, 2006). According to Bittencourt and Hortale (2009), the effects caused by overcrowded healthcare services include occupied beds, patients in the hallways, and long wait times for care during emergencies. These consequences indicate the low performance of the healthcare system in general and the hospital in particular.
Figure 1 shows data the number of hospital beds in Brazil and Rio Grande do Sul over time. Figure 2 shows the distribution of the number of beds in Rio Grande do Sul in 2013.
Figure 1. The number of hospital beds in Brazil and Rio Grande do Sul from 2005 to 2010 (beds per 1,000 inhabitants)
.
Sources: Ministry of Health; SAS; National Register of Health Establishments (Cadastro Nacional de Estabelecimentos de Saúde; CNES)
Figure 2. The distribution of hospital beds per type in Rio Grande do Sul in 2013 (no. of beds)
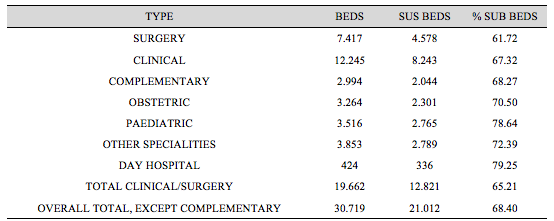
Source: SES RS (CNES/MS; data reference date: 29/04/2013)
Physicist Eliyahu M. Goldratt developed and presented the TOC in 1984 in his book The Goal (GOLDRATT, 1990). The primary concept that companies should make money now and in the future is a central factor of the TOC: Organisations have goals, and it is critical to understand the constraints of this system to achieve these goals. The TOC can be viewed as a model whose target is the management of organisations through the identification of constraints (GOLDRATT, 1990).
A constraint is anything that prevents a system from achieving a higher performance in relation to its goal (e.g., the weakest link in a chain or a limiting factor; GOLDRATT, 1990). Constraints must be identified because they are what will determine the system performance as a whole (SABBADDINI, 2006). According to Noreen, Smith, and Mackey (1996), either individuals control the constraints or they are controlled by the constraints. A constraint is neither good nor bad per se; however, the pursuit of better performance for a production system requires that it be managed in the best possible way (GOLDRATT, 1990).
The focusing process of the TOC enables the identification of bottlenecks and allows them to be managed (ARAÚJO, 2013). Bottlenecks are constraints on the system performance as a whole. A bottleneck resource is that whose capacity to generate value is lower than the demand placed on it. A capacity constrained resource (CCR) has a nominally higher value generation capacity than the demand placed on it; however, its performance is impaired by peak demand, thereby generating a possible bottleneck. In turn, non-bottlenecks are those whose capacities are higher than the demand placed on them. The Toyota Production System/Lean Thinking viewpoint provides a slightly different reading of the bottleneck. According to this view, the concepts of bottleneck, CCR and non-bottleneck are associated with processing capacity and not with the value generation capacity (ANTUNES et al., 2008). From the perspective of the present study, both definitions can be applied to hospital beds because the latter represents (on the one hand) a capacity for “processing” (e.g., recovery and convalescence) the patient but also for value generation (e.g., the hospital is paid per occupied bed daily, up to a certain limit set by the contract with the Brazilian Unified Health System [SUS], private health insurance companies, or the patient directly).
The TOC was initially applied to industrial systems to improve processes. Currently, its concepts and principles are used in organisations across several areas, including accounting, aerospace, automotive, consulting, defence, health, technology, timber, manufacturing, mining, steel, telecommunications, textile, and universities and colleges (BURTONHOULE, 2001). According to Sadat et al. (2013), the relative number of TOC applications reported in the healthcare sector is low. In England, the TOC was successfully applied to reduce the long waitlists that are managed by the National Health Service (NHS; PHIPPS, 1999).
Presenting the ideas that the core objective of organisations is to generate wealth and that at least one constraint (physical or non-physical) will always be present, Goldratt & Fox (1989) addressed these constraints through what he defined as the thinking process (TP) by responding to the three fundamental questions that one faces when dealing with constraints: What to change? Why change? and How to cause change? Table 1 shows the TOC management questions and tools.
Table 1. TP management questions and tools
QUESTIONS |
TOC TOOL |
WHAT TO CHANGE? |
Current Reality Tree (CRT) |
WHY CHANGE? |
Cloud Scattergram (CS) |
Future Reality Tree (FRT) |
|
HOW TO CAUSE CHANGE? |
Prerequisite Tree (PRT) |
Transition Tree (TT) |
Source: Cox; Spencer, 1999
By answering these three questions, it is possible to recognise that the performance of the value chain that involves the activities that generate wealth is dictated by the management of its constraints, which establishes the maximisation of those resources; to that end, Goldratt & Fox (1989) proposes responding to the five TOC focusing steps as follows:
According to Corbett (1997), a resource will always exist that constrains maximum flow, and a weak link will always exist on the chain. In this first step, the existing constraints in the system should be identified; it is not possible to increase system performance or the chain strength without identifying the weakest link, which determines its strength. Once the constrained recourse is identified, its use should be maximised (CAMACHO; GUERREIRO, 2003). According to Groop (2012), earnings can increase without the need to invest in additional resources via the effective management of these major leverage points.
Step 2: Decide how to explore the system constraints
The crux of Step 2 is to maximise system performance by considering the constraint (i.e., obtaining the best possible result within this condition). After deciding how to manage the constrained resources, the issue arises regarding what to do with the vast majority of resources that do not have constraints (CAMACHO; GUERREIRO, 2003).
Step 3: Subordinate everything else to the previous decision
The constrained resources (i.e., bottlenecks) determine system performance. Other resources should work at the pace of the constraint (not faster or slower). Materials should not be lacking for the constraint to operate, otherwise the pace would stop, and system performance as a whole would be adversely affected. No matter the type of constraint, a way to reduce its limiting effect on the system should be pursued (CAMACHO; GUERREIRO, 2003).
Step 4: Increase the system constraints
According to Guerreiro (1999), if, by the end of the third step, a constraint exists, it must be increased or overcome, thereby adding more resources to the system. This step implies investing more in the constraint by acquiring more machines, hiring people, increasing the number of shifts, and so on.
Step 5: If the constraint is broken, then return to Step 1 and do not allow inertia to constrain the system.
If a constraint was overcome in the previous step, then return to the first step and start again because a new constraint must surely be broken. The company must know how to live with constraints. Ignoring them would be a significant mistake. They should be acknowledged and managed so that they become an opportunity to leverage the business (CAMACHO; GUERREIRO, 2003).
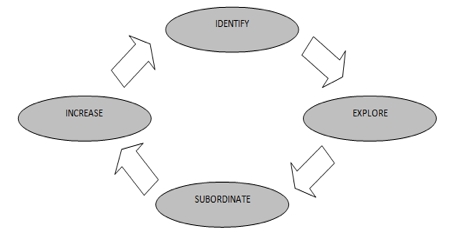
The continuous improvement process can be identified in methodologies such as the focusing process, which consists of focusing on the system target, determining improvement actions, identifying the constraint, managing it, and subordinating all resources to it. By continuously reassessing the system and its processes, an improvement cycle is obtained (see Figure 3; SABBADINI, 2006).
Figure 3. The continuous improvement cycle using the five-step methodology
Source: Sabbadini (2006)
The tools developed by Goldratt for TOC application are rational, and they seek to assist managers in the processes of business change. These processes aim to find the path to gain (VALLIM, 2004). According to Pi-Fang and Miao-Hsueh (2005), certain TOC tools are useful when problem management is necessary. The objective of the tools is to obtain answers to the following questions: What to change within the process? Why change? How to change? The tools depict a type of cause-and-effect relationship based on a logic tree. The five applicable tools in the TOC are CRT, cloud scattergram, future reality tree (FRT), prerequisite tree (PRT), and transition tree (TT).
The purpose of the CRT is to address the existing connections among all of the symptoms of the major constraint in the system, assuming that few common causes exist to explain many of the undesirable system effects. By accepting this assumption, the aim is not to focus on the analysis and treatment of the system symptoms but on its common causes (NOREEN, SMITH; MACKEY, 1996). According to Cox III and Spencer (2002), it is one of the most used tools for structuring the elements and connections of processes, consisting of the logical mapping of cause-and-effect relationships to determine the problems (e.g., bottlenecks and constraints) that cause UEs in the system.
2.4. TOC in Hospital and Healthcare Organisations
From the perspective of the TOC, any company with a goal has at least one constraint, regardless of its economic sector. Therefore, although the TOC originated from the industrial sector, it is not exclusive to this sector. Thus, the TOC can be applied without restrictions to any economic sector, including service providers.
Identifying and managing constraints is important at a hospital to use resources and improve system performance. According to Sadat et al. (2013), the goal of the healthcare system has not been widely discussed in the TOC literature. Some of the suggested goals include to "maximise life expectancy and quality of life at an acceptable cost to society" (HUNINK, 2001), "maximise health facilities" (BREEN et al., 2002), "provide safety while thinking about money only as an operating expense" (MCNUTT et al., 2004), "treat more patients, both now and in the future" (WRIGHT; KING, 2006), "maximise quality medical services provided to customers, subject to budgetary constraints" (ROTSTEIN et al., 2002), and "gain more health today and in the future" (SCHAEFERS et al., 2006).
Kershaw (2000) applied the TOC at a clinical oncology outpatient unit that provides chemotherapy to patients. The process consisted of six steps: check-in at the hospital, laboratory blood tests, pre-treatment process, consultation, chemotherapy in the treatment room, and making future appointments with the receptionist. From this process description, a bottleneck was identified, and the volume of patients was compared with the capacity of resources at each treatment process step. Improvement efforts were focused on the constraint. At the end of the study, the capacity of cared patients increased between 20 and 25 per cent.
Although greater productivity is pursued in the manufacturing environment, Kershaw (2000) stated that the goal of hospitals is to provide quality healthcare to the most patients. Similarly, a constraint is one of the processes that comprise patient treatment flow. Rotstein et al. (2002) retrospectively studied the presence of bottlenecks in an emergency department. Although the following scenario was not generalised, the first step of the continuous improvement process is to identify the bottleneck to assess whether the medical team is employing a valuable strategy. The results showed that physicians could only be considered a bottleneck when they treat 80 to 119 patients.
Schaefers et al. (2006) presented a more relevant definition of the TOC performance metrics for the health sector. The classic TOC goal concerns for-profit companies: “make money now and in the future”. This goal can be applied to any type of institution; therefore, the TOC objective is reformulated as “continuously make more objective units today and in the future”.
In addition, according to the authors, the TOC approach for non-profit institutions defines an objective unit as the “value of the product or service in the eyes of the organisation’s customers”. Thus, the patient’s objective is to receive care that will maximise their life expectancy with good quality of life. As such, the hospital should aim to meet this goal. Therefore, the metric is required because it captures quality of life and life expectancy.
In addition, according to Sabbaddini (2006), customer satisfaction is extremely important in the treatment process, as is their perceptions with regard to the quality of services provided. A comparative study emphasised the major differences between the health and manufacturing sectors using the five steps required to apply the TOC (see Figure 4).
Figure 4. TOC in the manufacturing and health sectors
Manufacturing |
Steps (TOC) |
Healthcare |
Is there enough demand for the product? |
Step 1 Identify system constraints |
Is there a suitable amount of patients? |
Is the raw material supply adequate? |
Is there availability of drugs and hospital material? |
|
Does demand exceed capacity per machine or process? |
Does the amount of patients exceed the treatment capacity of each sector? |
|
Purchase of material based on constraints of installed capacity. |
Steps 2 and 3
Decide how to explore the system constraints and subordinate remaining resources |
Purchase of drugs and hospital material based on installed capacity constraints. |
Production schedule based on capacity constraints. |
Appointment of patients based on installed capacity constraints. |
|
Reduce machine preparation time. |
Step 4 Increase constraint capacity of the system |
Reduce patient preparation time. |
Direct load to machines/processes without constraint. |
Direct treatment to sectors without constraints if possible. |
|
Eliminate/reduce machine stoppage. |
Eliminate/reduce downtime of bottleneck resources. |
|
Increase flow capacity. |
Speed up patient treatment flow. |
|
Increase production time at bottlenecks. |
Increase operation time at bottlenecks. |
|
Hire/acquire new professionals/equipment. |
Hire/acquire new professionals/equipment. |
|
|
Step 5 If constraint is dislocated, return to Step 1. |
|
Source: Kershaw (2000)
Thus, although the TOC originated from the manufacturing sector, it can be understood and used in the current study hospital. One of the goals of the TOC is to provide quality healthcare to the most patients to satisfy them throughout the treatment process.
The survey method used in the current study was exploratory and descriptive. According to Gil (2010), exploratory surveys aim to explore or examine a problem/situation to acquire knowledge and understanding as well as to develop, clarify, and modify concepts aimed at the formulation of problems. According to Köche (2002), an exploratory survey aims at deepening the knowledge regarding the phenomena or problem situation; this survey can be descriptive, exploratory, or explanatory. The present study used a descriptive survey to study and analyse the surveyed environment without interference from the researcher who only seeks to describe it (GIL, 2010).
This approach is characterised as qualitative because it focuses on the application of the CRT TP tool with regard to the processes related to hospital bed availability. Meetings and unstructured interviews were held with the hospital project director, the head nurse of the ward, and the physician responsible for the beds with regard to data collection. Figure 5 displays the six steps of this study.
Figure 5 - Study Steps
Source: Prepared by the authors
In the first and second steps of the study, the opportunity to study the hospital entity was pursued; therefore, the possibility arose to reassess a previous study conducted at the hospital in 2008. In that study, an informational survey of the hospital staff focusing on UEs was administered. However, no other structured approach (e.g., the CRT) was used. Hence, these UEs were used to demonstrate whether they remained valid or whether they had changed over time. In light of the collected data, an empirical basis was used for the present study.
In the third step of the study, the articles, theses, and dissertations indexed on national (CAPES and BIREME) and international databases (EBSCo) were reviewed. The keywords used for the literature search were “theory of constraints”, “hospital entities”, and “hospital bed management”. From these initially identified articles, abstracts were read and selected based on the theme of the study. The preselected articles were read thoroughly, and they formed the framework for conducting the analyses presented in the following steps.
In the fourth step of the study, meetings were held with the hospital staff to analyse the survey problem. First, a schedule of activities was created for the current study. After the schedule was agreed upon, two meetings were held with the staff during which the data regarding the causal relationships were obtained to structure the proposed analyses. In the fifth step, the authors consolidated the data using a spreadsheet. In the sixth and final step, the CRT was applied, and the results were analysed.
4. Study presentation
4.1. Study Unit
The target entity for this study was a private hospital founded in 1979 in Porto Alegre, Rio Grande do Sul. Currently, this capital has two hospitals, and another seven units are located in the countryside. The study site is a reference hospital for the medical and hospital care of patients with the most complex cases; furthermore, it is the only hospital in southern Brazil with a double quality certification. It is among the fastest growing healthcare institutions with regard to service quality and quantity as well as the products provided to the community. In over 30 years of activity, this hospital stands out from the next generation of hospitals that never stop specialising or growing given the speed of medical advances.
The hospital has a built area of approximately 40,000 m2 where high-tech equipment and a highly skilled medical and healthcare staff, including more than 4,000 accredited physicians, are concentrated. The hospital is composed of the following departments: emergency, day hospital for outpatient care, ICU, dialysis centre, maternity ward, neonatal ICU, obstetric centre, surgical ward, and blood bank. The hospital has more than 370 beds.
The demand for hospital beds increased in 2013. According to the hospital’s data, the number of annual hospitalisations was over 100,000. Over the years, the organisation has sought techniques and tools to continuously improve hospital bed management. Thus, the use of TOC concepts is applicable to assist the organisation with its goals, especially after identifying low bed availability as a major constraint.
4.2. CRT
As previously described, based on the meetings held between the researchers and the hospital staff, a CRT was drafted. To that end, the steps shown in Table 2 were followed. Below, each proposed step and its results are explicitly summarised.
Table 2. Steps used to create the CRT
STEPS TO BUILD THE CRT |
DESCRIPTION |
Step 1 |
Identify constraint-related problems (i.e., UEs). |
Step 2 |
Seek to identify causal relationship among the UEs. |
Step 3 |
Draw the causal diagram. |
Step 4 |
Identify the root problem. |
Source: Prepared by the authors
With the focal groups oriented toward identifying the problems related to low bed availability, the major UEs were raised, which were related to this problem. To better understand and categorise these UEs, the hospital staff listed the processes related to hospital bed management such as check-in, bed occupancy, hospitalisation, bed vacancy, and bed reoccupation. To better understand and assist with building the following steps, the UEs were numbered. As Table 3 shows, 38 UEs, which can be replicated across different processes, were listed.
Table 3. UEs with regard to hospital bed management
Processes |
UEs |
No. |
Check-in |
OPME authorisation Health insurance company authorisation required for hospitalisation Little or no adherence to the clinical protocols of hospitalisation No hospitalisation plan: reasons, documents, drugs, and resources Diagnostic examination conducted on inpatients rather than outpatients Lack of hospitalisation criteria Hospitalisation of private patient in a semi-private room (blocked bed) Absence of family member/legal representative needed to authorise hospitalisation Time to repair the room equipment Lack of reform plan Lack of bed block criteria for maintenance |
01 02 03 04 05 06 07 08
09 10 11 |
Bed Occupancy |
Bed cleaning time Unnecessarily long stay Time to transport patient from reception to room Time to transport patient from emergency department to room Time to transport patient from ICU to room Undersized transport team Lack of bed linens Time to fix room equipment Lack of reform plan Lack of bed block criteria for maintenance |
12 13 14 15 16 17 18 09 10 11 |
Hospitalisation |
OPME authorisation Health insurance company authorisation required for hospitalisation Authorisation for examinations and procedures Little or no adherence to the clinical protocols of hospitalisation No hospitalisation plan: reasons, documents, drugs, and resources Payers’ criteria for medical remuneration No hospitalisation follow-up assessment according to hospitalisation plan (assisted hospitalisation) Absence of family member/legal representative needed to authorise hospitalisation Time to perform tests on inpatients Time to issue inpatient test results Adverse events Time to fix room equipment Lack of bed block criteria for maintenance |
01 02 19 03 04 20 21
08
22 23 24 09 11 |
Bed Vacancy |
Lack of release criteria: time, estimate, and so on Release protocols Lack/non-adherence to release criteria in closed areas (ICU, SCU, and RS) Lack of release plan Assistant physician unavailable to release patient Complex release process (rework) Hospital billing Lack of structure to meet patients’ social conditions Family delay Lack of homecare criteria definition Complex homecare process Lack of external transport solution for patients Delay in informing family member of patient’s release Delay to collect patient’s belongings for release or internal transfer Time to perform tests on inpatients Time to issue inpatient test results Adverse events |
25 26 27 28 29 30 31 32 33 34 35 36 37 38 22 23 24 |
Bed Reoccupation |
Bed cleaning time Complex release process (rework) Family delay Lack of homecare criteria definition Complex homecare process Lack of structure to meet patient’s social conditions Delay in informing family member of patient’s release Lack of bed linens Delay to collect patient’s belongings for release or internal transfer Time to fix room equipment Lack of reform plan Lack of bed block criteria for maintenance |
12 30 33 34 35 32 37 18 38 09 10 11 |
Source: Hospital data
After reviewing and analysing the UEs listed, the cause-and-effect relationships among them were studied, always using the “IF=cause, THEN=effect” method. For example, if a “lack of bed linens” is identified, then “bed cleaning time" increases.
After the work team analysed the defined UEs and cause-and-effect relationships, the causal diagram was drawn to visually depict the CRT. The CRT was drawn top-down, from effects to causes; however, it should be read inversely (i.e., bottom-up, using the IF-THEN relationship). With this tool, it is possible to analyse the true root causes of the bed management problem analysed in the next section. Figure 6 shows the CRT.

.
Source: Prepared by the authors
By analysing the diagram and the cause-and-effect relationships among the UEs, the major problems related to low bed availability were identified in the study hospital; they are highlighted in green in Figure 6. These UEs were identified as primary causes of the others; therefore, mitigating these effects should improve system performance. The effects identified as root problems were the:
04. Inexistence of a hospitalisation plan: reasons, documents, drugs, and resources
05. Diagnostic examination conducted on inpatients rather than outpatients
08. Absence of the family members/legal representatives needed to authorise hospitalisation
10. Lack of reform plan
11. Lack of bed block criteria for maintenance
17. Undersized transport team
18. Lack of bed linens
20. Payers’ criteria for medical remuneration
22. Time to perform tests on inpatients
23. Time to issue inpatient test results
25. Lack of release criteria: time, estimate, and so on
26. Release protocols
27. Lack of/non-adherence to release criteria in closed areas (ICU, SCU, and RS)
28. Lack of release plan
29. Assistant physician unavailable to release patient
30. Complex release process (rework)
32. Lack of structure to meet patient’s social conditions
33. Family delay
35. Complex homecare process
36. Lack of external transport solution for patients
37. Delay in informing family member of patient’s release
UE 24 is worth singling out. Adverse effects were disregarded when building the CRT because they are related to many other effects, and they are unpredictable.
Numerous UEs in the current study were related to low bed availability and the cause-and-effect relationships among these variables. Implications are only perceived using “OR” links, and these interlinked processes generate complex problem solving; thus, their solution is more difficult because of insufficient causes and so on.
The UEs identified are related to the lack of planning, criteria, requirements, and quality standards regarding the management of the processes related to hospital beds. Thus, poor hospital bed management must be continuously studied.
Hospitals face the permanent challenge of managing resources. By redirecting improvement actions toward system constraints, actions are adopted so that these constraints affect the system as little as possible. In the current study, bed availability was the starting point for specific management actions. In particular, the current study preliminarily applied TOC concepts (especially the CRT tool) to increase an understanding the major UEs concerning low bed availability within a private hospital in the metropolitan region of Porto Alegre, Rio Grande do Sul.
Using the TOC for the current study hospital helped form the basis for improving hospital bed management processes and (especially) increasing understanding among the organisation staff with regard to operational functions and the existing constraints that cause problems in the system.
This theme should be studied further using TOC TP with regard to the processes related to low bed availability. Furthermore, other hospital sectors should be addressed, thereby creating a tradition of identifying issues and performing structured analysis for problem solving.
da Silva, S. A., Valácio, R. A., Botelho, F. C., & Amaral, C. F. S. (2014). Fatores de atraso na alta hospitalar em hospitais de ensino. Revista de Saúde Pública, 48(2), 314-321.
ANAHP (2014). Livro Branco: Brasil Saúde 2015 | A sustentabilidade do sistema de saúde brasileiro [Brazilian healthcare system sustainability].
ANTUNES, J. J., KLIPPEL, M., Koetz, A., & Lacerda, D. (2004). Critical issues about the theory of constraints thinking process-a theoretical and practical approach. PRODUCTION AND OPERATION MANAGEMENT SOCIETY-POMS, 15.
Araujo, F. J. (2013). Aplicação da TOC em uma estrutura hospitalar de grande porte: O uso da metodologia em um processo sistêmico nos serviços de internação. Revista de Gestão em Sistemas de Saúde, 2(1), 161-180.
Bittar, O. J. N. V. (1996). Produtividade em hospitais de acordo com alguns indicadores hospitalares. Revista de Saúde Pública, 30(1), 53-60.
Bittencourt, R. J., & Hortale, V. A. (2009). Intervenções para solucionar a superlotação nos serviços de emergência hospitalar: uma revisão sistemática Interventions to solve overcrowding in hospital emergency services: a systematic review. Cad. saúde pública, 25(7), 1439-1454.
Bradley, V. M. (2005). Placing emergency department crowding on the decision agenda. Journal of Emergency Nursing, 31(3), 247-258.
Breen, A. M., Burton-Houle, T., & Aron, D. C. (2002). Applying the theory of constraints in health care: Part 1—the philosophy. Quality management in healthcare, 10(3), 40-46.
Camacho, R. R., & Guerreiro, R. (2003). Teoria das Restrições aplicada na prestação de serviços – O caso de uma entidade hospitalar. I Congressoda Associação Uruguaia de Custos(A.U.R.C.O). Punta del Este.
Coleman, P., Irons, R., & Nicholl, J. (2001). Will alternative immediate care services reduce demands for non-urgent treatment at accident and emergency?. Emergency Medicine Journal, 18(6), 482-487.
Coleman, P., Irons, R., & Nicholl, J. (2001). Will alternative immediate care services reduce demands for non-urgent treatment at accident and emergency?. Emergency Medicine Journal, 18(6), 482-487.
CORBETT NETO, T. (1997). Contabilidade de Ganho: a nova abordagem gerencial de acordo com a teoria das restrições. Editora Nobel: São Paulo.
COX IIII, J. F., & SPENCER, M. (2002). Manual da teoria das restrições.
COX, J.F. & SPENCER M (2002). The Constraints Management Handbook. St. Lucie Press/APICS.
Gama, A. M., Reis, C. O. O., Santos, I. S., & Bahia, L. (2002). O espaço da regulamentação dos planos e seguros de saúde no Brasil: notas sobre a ação de instituições governamentais e da sociedade civil. Saúde debate,26(60), 71-81.
Gil, A. (2010). Como Elaborar Projetos de Pesquisa. Atlas.
Guerreiro, R. (1999). A meta da empresa: seu alcance sem mistérios. Atlas.
Goldratt, E. M., & Fox, R. E. (1989). A corrida pela vantagem competitiva.São Paulo: IMAN.
Goldratt, E. M. (1990). Theory of constraints. Croton-on-Hudson: North River.
Goldratt, E. M. (1992). A síndrome do palheiro: garimpando informação num oceano de dados. Educator.
Goldratt, E. M., & Cox, J. (1995). A meta: um processo de aprimoramento contínuo. In A meta: um processo de aprimoramento contínuo. Educator.
Groop, J. (2012). Theory of Constraints in field service: Factors limiting productivity in home care operations.
Hunink, M. M. (2001). In search of tools to aid logical thinking and communicating about medical decision making. Medical Decision Making,21(4), 267-277.
Kershaw, R. (2000). Using TOC to cure Healthcare problems. Management Accounting Quaterly, Spring.
Köche, J. C. (2002). Fundamentos de metodologia científica: teoria da ciência e iniciação à pesquisa. atual. Petrópolis: Vozes.
Kotler, P., Shalowitz, J., & Stevens, R. J. (2010). Marketing Estratégico para a Área da Saúde. Bookman Editora.
Lima, F. X. C., & Belderrain, M. C. N. (2007). Propostas de melhorias de atendimento num Pronto Socorro utilizando Teoria de Filas e Teoria de Restrições. ENCONTRO DE INICIAÇÃO CIENTÍFICA E PÓSGRADUAÇÃO DO ITA, 13.
MINISTÉRIO DA SAÚDE (2014). Cadastro Nacional de Estabelecimentos de Saúde. Available at: http://www.saude.rs.gov.br/. Accessed on: July 9, 2014.
McNutt, R. A., & Odwazny, M. C. (2004). The theory of constraints and medical error: a conversation with Robert A. McNutt. Quality Management in Healthcare, 13(3), 183-187.
Noreen, E. W., Smith, D., & Mackey, J. T. (1996). A teoria das restrições e suas implicações na contabilidade gerencial: um relatório independente. Educator.
Organização Mundial da Saúde. (2003). Cuidados inovadores para condições crônicas: componentes estruturais de ação: relatório mundial.
Paim, J., Travassos, C., Almeida, C., Bahia, L., & Macinko, J. (2012). Saúde no Brasil 1 O sistema de saúde brasileiro: história, avanços e desafios. Veja,6736(11), 60054-8.
Phipps, B. (1999). Hitting the bottleneck. Health Management Magazine, 1-3. Available at Goldratt Institute. (www.goldratt.com). Accessed on July 14, 2014.
Pi-Fang, H., & Miao-Hsueh, S. (2005). Using the Theory of Constraints to improve the identification and solution of managerial problems. International Journal of Management, 22(3), 415. Available at: http://proquest.umi.com >. Accessed on July 31, 2014.
Rotstein, Z., Wilf-Miron, R., Lavi, B., Seidman, D. S., Shahaf, P., Shahar, A., ... & Noy, S. (2002). Management by constraints: considering patient volume when adding medical staff to the emergency department. The Israel Medical Association Journal: IMAJ, 4(3), 170-173.
Sapata, M. D. P. M., Soares, D. A., & Souza, R. K. T. D. (2006). Utilização dos leitos hospitalares sob gestão pública em Município de médio porte da Região Sul do Brasil, 1998-2002. Epidemiologia e Serviços de Saúde, 15(2), 57-67.
Sabbadini, F. S., Gonçalves, A. A., & de Oliveira, M. J. F. (2006). A aplicação da teoria das restrições (toc) e da simulação na gestão da capacidade de atendimento em hospital de emergência. Revista Produção Online, 6(3).
Sadat, S., Carter, M. W., & Golden, B. (2013). Theory of constraints for publicly funded health systems. Health care management science, 16(1), 62-74.
Schaefers, J., Colin, J., Aggoune, R., & Kucina, M. (2006). A contribution to performance measurement in the healthcare industry: the industrial point of view. International Journal of Business Performance Management, 9(2), 226-239.
Schout, D., & Novaes, H. M. D. (2007). Do registro ao indicador: gestão da produção da informação assistencial nos hospitais. Cienc Saude Coletiva,12(4), 935-44.
SECRETARIA DE PLANEJAMENTO, GESTÃO E PARTICIPAÇÃO CIDADÃ. Accessed on July 16, 2014. Available at: http://www.scp.rs.gov.br/atlas/conteudo.
Vallim, C. R. (2004). Aplicação do Processo de Raciocínio da Teoria das Restrições: Um estudo de caso na área da saúde. Faculdade São Geraldo-FSG.
Viacava, F., Almeida, C., Caetano, R., Fausto, M., Macinko, J., Martins, M., ... & Silva, L. D. (2004). Uma metodologia de avaliação do desempenho do sistema de saúde brasileiro. Ciênc saúde coletiva, 9(3), 711-24.
Wright, J., King, R., & Goldratt, E. M. (2006). We all fall down. Great Barrington, MA: North River Press.
1. Graduate Program in Production and Systems Engineering . UNISINOS. São Leopoldo, Brasil. (e-mail: marianecasseres@gmail.com)
2. Graduate Program in Production and Systems Engineering . UNISINOS. São Leopoldo, Brasil. (e-mail: thiagosouza.uem@gmail.com)
3. Graduate Program in Production and Systems Engineering . UNISINOS. São Leopoldo, Brasil. (e-mail: guilhermev@unisinos.br)