
 HOME | ÍNDICE POR TÍTULO | NORMAS PUBLICACIÓN
 Espacios. Vol. 37 (Nº 24) Año 2016. Pág. 25
Anderson Lima PINHEIRO, Francisco de Assis da Silva MOTA 1, Francisco Francielle Pinheiro dos SANTOS, Auceliane André da Silva LIMA.
Recibido: 11/04/16 • Aprobado: 12/05/2016
RESUMO: Este trabalho apresenta a simulação de uma unidade piloto de produção de aditivos para a gasolina a partir do glicerol. A substituição dos combustíveis fósseis tem sido motivada por fatores econômicos, ambientais e sociais, uma vez que toda a sociedade depende do seu uso. Nesse contexto uma alternativa que tem se destacado é o uso do biodiesel, entretanto seu uso gera o glicerol. Atualmente, o excesso deste subproduto no mercado mundial provoca o preço relativamente baixo para sua utilização. Portanto, a viabilização do biodiesel passa pelo consumo excedente de glicerol. A partir disso, diversas pesquisas são voltadas para o desenvolvimento de processos que transformem o glicerol em um produto de alto valor agregado. Dentre vários processos existentes, o glicerol é convertido em triacetina durante uma reação com ácido acético, onde tal produto pode atuar como um aditivo para a gasolina aumentando as propriedades do frio, reduzindo a viscosidade e como um antidetonante. Utilizou-se o software Hysys da Aspen Tech no desenvolvimento do processo e na simulação. O glicerol é convertido em um reator PFR na temperatura de 250ºC, pressão de 4 bar e razão molar (ácido acético/glicerol) de 4 obtendo assim uma conversão 99,97% de glicerol. Os equipamentos existentes no processo são: bombas, colunas de destilação e trocadores de calor. |
ABSTRACT: This paper presentes the simulation of a pilot plant for the production of additives for gasoline from glycerol. Currently, the excesso of this by-product in te world Market causes the relatively low price for its use. Therefore, the viability of biodiesel through the exceeded consume of glycerol. From this, several researches, are focused on the development of processes that transform glycerol into a product with high benefit. Among the various existing processes, glycerol triacetate is converted in a reaction with acetic acid where such a product can act a gasoline additive for enhancing the properties of cold, reducing the viscosity and as an anti-knock. We used the software Hysys of Aspen Tech in process development and simulation. Glycerol is converted to a PFR reactor at a temperature of 250 ° C, pressure of 4 bar and a molar ratio (acetic acid / glycerol) 4 thereby obtaining a conversion of 99.97% glycerol. Existing equipment in the process are: pumps, distillation columns and heat exchangers. |
The growing concern over global warming at the beginning of the XXI century encourage discussions on new energy sources. Modern society is still very dependent on oil. The viability of renewable fuels are already discussed worlwide, which cause much less impact on global warming, because the total balance reduces CO2 emissions, one of the main villains of the greenhouse effect. The use of biofuels is gaining prominence in recente decades and the replacement of fossil fuels has been motivated by environmental, economic and social factors, since the entire society depends on its use (SILVA, GONÇALVES E MOTA, 2010).
Biofuels have advantages for the environment. By not having sulfur in its composition, its burning causes no emissions of sulfur oxides, pollutants harmful to the quality and responsible for the acid rain. Recently, biodiesel has emerged as a viable alternative has renewable fuel, where the main route of abtaining is the transesterification of vegetable oils with alcohols (methanol and etanol), and using base catalysis. During its production in the gereneration of a byproduct called crude glycerol or glycerin (BALARAJU et al., 2010).
Glycerin is basically composed of 80% glycerol. Glycerol is a substance with different aplications in chemical industry. However, with the increase in biodiesel production, the amount of glycerol in the Market is much large than the demand, which makes the price of the product decreases. The world Market for this product is around 19 million tons / year to use about 11% by weight in gasoline. This corresponds to 2% oxygen in gasoline. If we consider the same percentage and taking into account that in the glycerin molecules, the oxygen atoms correspond to 52% of the total weight, we would have a potential Market in the world of around 7 million tons for glycerin, considering only its use as fuel additive. Therefore, ethers and esters derived from glycerin appear as possible candidates (MOTA, SILVA E GONÇALVES, 2009).
From this, several researches are focused on the development of processes for gycerin, since it is a residue of low value in biofuel industries. There are different processes being developed for glycerol, including the production of triacetin obtained from the reaction with acetic acid. This product has application as additives for gasoline (GONÇALVES, SILVA e MOTA, 2010; RAHMAT, ABDULLAH e MOHAMED, 2010).
The process simulation is a complementary tool of Process Engineering. The use of models of chemical processes allows, with a high degree of confidence, the analysis of a chemical process since its conception, through the desing phase to the basic analysis of a operating unit defined. With its use, it is possible to study alternative Technologies for the production of chemicals by comparing results, energy use, by-products and operating conditions. Their use in the desing phase of a basic unit goes from the consolidation of energy and material balance, equipment sizing and study of control strategies. The Hysys was selected as a process simulator, for its simulation capability and flexibility to incorporate the calculations using spreadsheets. The first steps in the development of the simulation process were selecting chemical componentes for the process as well as a suitable thermodynamic model. In addition, unit operations and operating conditions, plant capacity, and operating conditions must be all selected, and especified.
The library of Hysys has information for the componentes used in the following simulation: glycerol, sodium hydroxide, water, glycerol triacetate, acetic acid and H2SO4. Triacetin was used as the reaction product of glycerol and acetic acid. The simulation a required amount of sulfuric acid involved in the process, once the laboratory's acale uses the excesso of sulfuric acid to catalyze the reaction. The componentes are not available in the Hysys' library were specified using the Tabular Hypothetical Input. Sodium sulfate, monoacetina and diacetina were specified. The specification of a componente requires entry of a number of properties, such as the normal boiling point, density, molecular weght, as well as the assential properties of the substance.
Due to the presence of polar compunds such as, for example, glycerol and acetyls and in the process, we used the activity model (NRTL) to predict thermodynamic properties, where such model is based on thermodynamic studies of the molecular liquid solutions concept of local composition. Some of the binary interaction parameters were not available in the database of the simulation. They were estimated using the UNIFAC model for vapor-liquid equilibrium and models of liquid-liquid equilibrium.
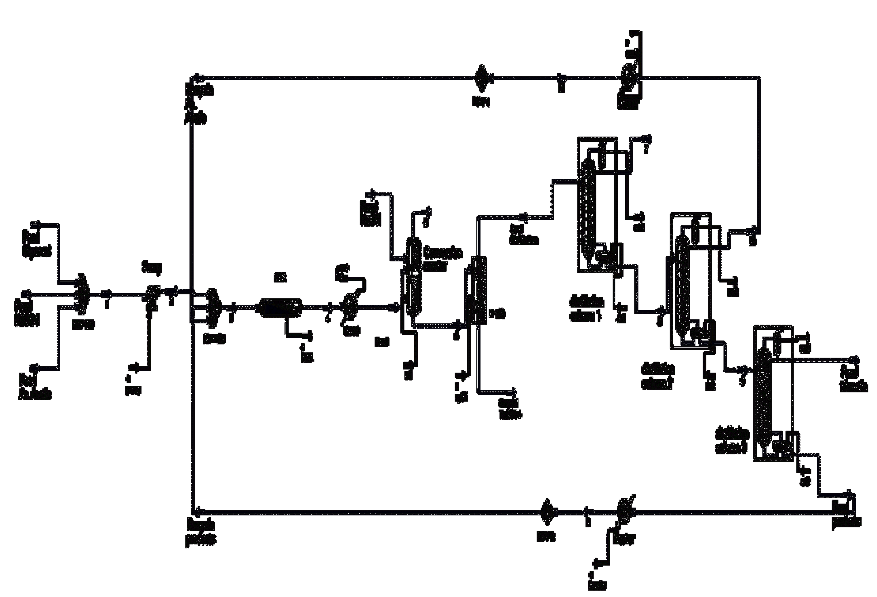
The flowsheet of the developed process is shown in Figure 1. The existing unit operations in the process are: PFR reactors and conversion, distillation columns, pumps, and heat exchangers. From kinetic data available in Golan et al (2009), obtained the frequency factors and activation energies for the reaction under study. The developed process for producing triacetin from glycerol has the capacity to 552.57 Kg/hr of purê glycerol, 1,441.2 kg/hr of acetic acid, and 294.24 Kg/hr of sulfuric acid, which acts as the catalyst for the reaction. The molar flow rate of glycerol was chosen with the intention that the elaborated plan was classified as a pilot plant. The molar flow rate of acetic acid was chosen so that the molar ratio of currents acetic acid / glycerol resulted on 4.
First, the stream of pure glycerol is mixed with the stream of acetic acid, together with sulfuric acid stream, with a molar ratio of acetic acid / glycerol of 4. Then, it is mixed with recycled acetic acid, from the CD-2 column, and mixed with the recycle of glycerol, monoacetina, and diacetin from the column CD-3. Then this mixture feeds the reactor PFR.
The effluent from the PFR reactor will pass to a reactor of conversion, where occurs the removal of the sulfuric acid using a total neutralization reaction with NaOH. The reactor effluent conversion feeds the distillation column CD-1, so that there is separation of the water from product's top. The bottom product from this column, feeds the column CD-2 to promote the separation of acetic acid, exiting as top product. The bottom product feeds the column CD-3 for separating the triacetin of other substances. The bottom product of this column is recycled, as previously stated.
The designed unit as capacity of production of triacetin 1, 308.7 Kg/hr with a 99.85% purity.
Several studies have been done to get to the end of the process flowsheet. Below are shown the studies of how it was determined the operating conditions of the equipment on this unit, and Tables 1 and 2 shows the general data of the process and the values of each stream used in the simulation respectively.
Table 1 – Summary of unit operating conditions for process
Acetylation of glycerol |
|
Catalyst |
H2SO4 |
Reactor type |
PFR |
Temperature (°C) |
250 |
Pressure (kpa) |
400 |
Mole ratio (Acetic acid / Glycerol |
4 |
Residence time (h) |
5.5 |
Conversion (%) |
99.97 |
Catalyst neutralization |
|
Reactor type |
Conversion |
Neutralizing agent |
NaOH |
Water Separation |
|
Reflux ratio |
2.8 |
Number of stages |
30 |
Condenser/Reboiler pressure (kPa) |
1 |
Acetic Acid Separation |
|
Reflux ratio |
0.05 |
Number of stages |
15 |
Condenser/reboiler pressure (kPa) |
1 |
Triacetin Separation |
|
Reflux ratio |
1.35 |
Number of stages |
43 |
Condenser/reboiler pressure (kPa) |
1 |
Final purity (%) |
99.85 |
Table 2 – Stream information for the acetylation of glycerol process
|
Feed stream |
|
Products streams |
|||
Feed Glycerol |
Feed C2H402 |
Feed H2SO4 |
Feed Products |
Feed Triacetin |
||
Temperature (°C) |
30 |
30 |
30 |
Temperature (°C) |
277.79 |
257.91 |
Pressure (Kpa) |
100 |
100 |
100 |
Pressure (kPa) |
100 |
100 |
Molar flow (kgmol/h) |
6.00 |
24.00 |
3.00 |
Molar flow (kgmol/h) |
0.041902 |
6.00 |
Mass flow (kg/h) |
552.57 |
1441.2 |
294.24 |
Mass flow (kg/h) |
7.4011 |
1309.5 |
Component molar fraction |
Component molar fraction |
|||||
Glycerol |
1.00 |
0.00 |
0.00 |
Glycerol |
0.0002 |
0.0000 |
Acetic Acid |
0.00 |
1.00 |
0.00 |
Acetic Acid |
0.0000 |
0.0010 |
H2SO4 |
0.00 |
0.00 |
1.00 |
H2SO4 |
0.0000 |
0.0000 |
Monoacetin |
0.0142 |
0.0004 |
||||
Diacetin |
0.9233 |
0.0001 |
||||
Triacetin |
0.0123 |
0.9985 |
||||
H2O |
0.0500 |
0.0000 |
||||
The reaction was carried out in various situations in Hysys software in order to get the best reaction conditions. When dimensioning the reactor PFR -1, it was considered no pressure drop and residence time of 5.5 h.
The results obtained in figure 2, it is noted that the influence of temperature on the conversion is nearly constant, with results higher than 99%. The selectivity of monoacetin and diacetin is very low within the domain of temperature, not exceeding 9%. Furthermore, the selectivity of triacetin shows superior results at 96%, with the highest value obtained at a temperature of 250 ° C.
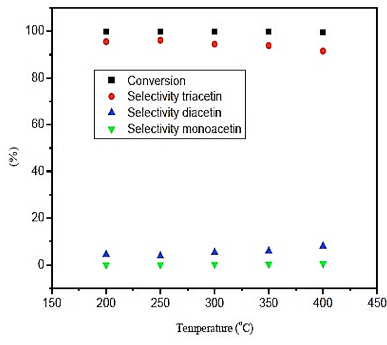
Fig. 2. Effect of temperature in conversion and selectivity
Observing results obtained in figure 3, it's noticeable that the temperature influence is more significant in the production of triacetin than the pressure. However, the greatest amount of triacetin is produced at a temperature of 300 ° C at a pressure of 8 bar. As the difference in the production of triacetin is small compared to pressures below 10 bar, it uses a pressure of 4 bar once the process would become safer, and the costs would be reduced. With respect to the temperature, the amount of triacetin produced in the reactor is greater than 250 ° C. Therefore, the operating conditions are: P = 4 bar and T = 250 ° C.
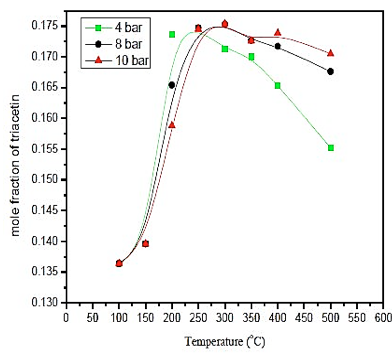
Fig. 3. Effect of temperature and pressure in formation of triacetin
Figure 4 shows the influence of the molar ratio of acetic acid / glycerol, since the existence of the excess of acetic acid, favors the formation of triacetin in the reaction. Therefore, the ratio of 4 provides the highest production of triacetin in operating conditions. Note that large excesses of acid did not favor the formation of the product, which was already seen in the literature and confirmed in the simulation.
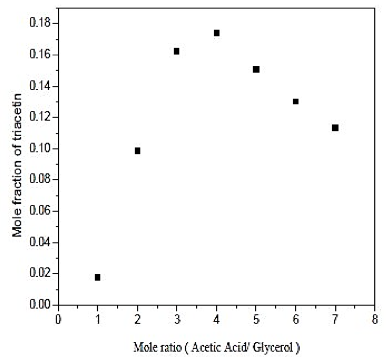
Fig. 4. Effect of mole ratio in formation of triacetin
From figure 5 which shows the influence of the residence time in the production of triacetin, it is observed that the difference between the three longer residence times have a little difference with respect to the amount of triacetin produced. Note that an increase in residence time of the last point, provides a 1% increase in production of triacetin. Therefore, the residence time used in the simulation is 5,08 h since the volume used for the construction of the reactor will be smaller and a much lower cost.
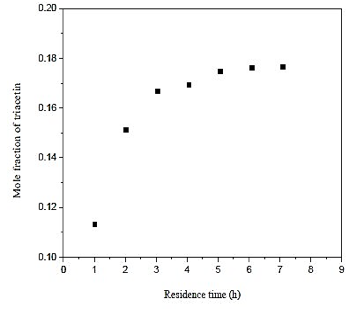
Fig. 5. Effect of residence time in formation of triacetin
The water separation was conducted in the distillation column (CD-1). The minimum number of stages and minimum reflux ratio are 28.9 and 2.506, respectively. The number of theoretical stages is calculated between 30 and 50. The feed plate is calculated between 12 and 19. The influence of the reflux ratio in molar composition of water in the overhead product and the reboiler heat load is shown in figures 6 and 7. The influence of the feed plate molar composition of water in the overhead product is shown in figure 8.
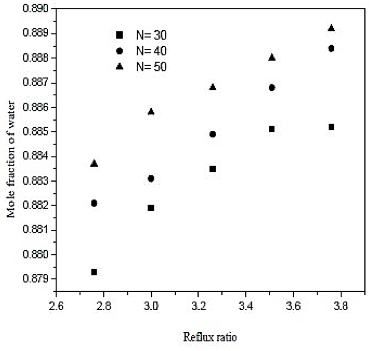
Fig. 6. Effect of reflux ratio and number of stages in formation of water on distillation column 1 (CD-1)
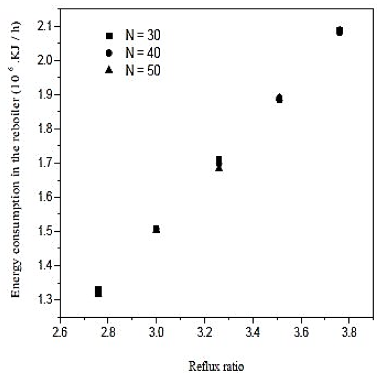
Fig. 7. Effect of reflux ratio and number of stages in energy consumption in the reboiler on distillation column 1 (CD-1)
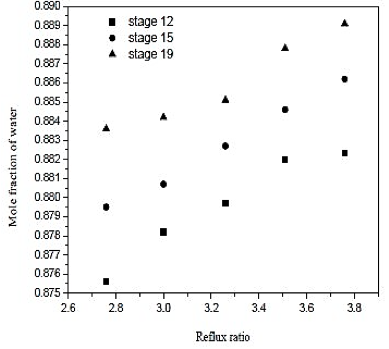
Fig. 8. Effect of reflux ratio and feed-stage in formation of water on distillation column 1 (CD-1)
Looking at the results of figures 6, we conclude that increasing the reflux ratio increases the mole fraction of water in the overhead product, but analyzing the results of figure 7, we see that increasing the reflux ratio also causes na increase in the termal load of the reboiler. Note that a 10% increase in the reflux ratio causes an increase of only 0.29% in the fraction of water in the overghead product. However, the same increase in reflux ratio provides a 10% increase in thermal load on the reboiler. Therefore, the distillation column must operate at lower reflux ratio, once it will be achieved a good separation and a saving in energy consumption of the unit. In figures 7 and 8 also abserved that the number of theoretical stages or no effect on the improvement of separation or decrease in thermal load of the reboiler. However, the ideal is that the distillation column has the lowest number of theoretical stages, and it will require fewer materials for its construction. Figure 8 shows that the closer to the bottom of the column is the feed, it will encourage in the separation. Thus, the optimal feed plate to the tower 1 is the CD-plate 19. The tower CD- 1 is the type of filling and has 30 equilibrium stages. It operates with a reflux ratio of 2.76 and power in hte nineteenth stage.
The separation of acetic acid was carried out in a distillation column (CD-2). The minimum number of stages and minimum reflux ratio are 4.509 and 0.046, respectively. The number of theoretical stages is calculated between 15 and 27. The feed plate is calculated between 8 and 15. Analogously to distillation column 1 made the same analyzes: the influence of reflux ratio in the composition in molar acetic acid bottoms product and the reboiler heat load used is shown in figures 9 and 10. The influence of hte feed plate in the composition in molar acetic acid bottoms product is shown in figure 11.
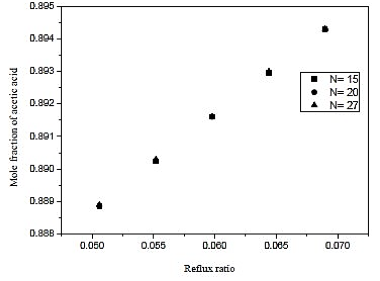
Fig. 9. Effect of reflux ratio and number of stages in formation of acetic acid on distillation column 2 (CD-2)
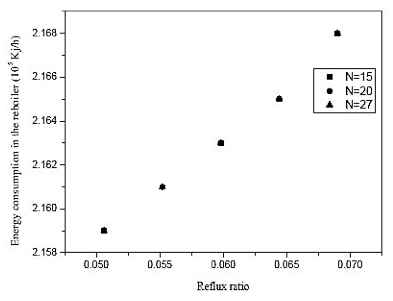
Fig. 10. Effect of reflux ratio and number of stages in energy consumption in the reboiler on distillation column 2 (CD-2).
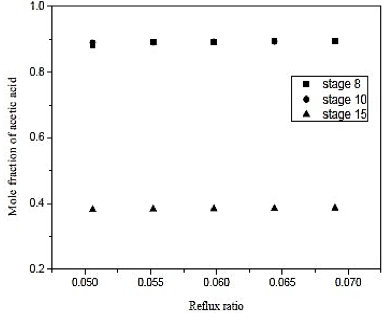
Fig. 11. Effect of reflux ratio and feed-stage in formation of acetic acid on distillation column 2 (CD-2)
Through the results of figures 9 and 10, we observe that the influence of the number of stages is practically nil in molar composition of acetic acid. Analogous fact occurs between the reboiler heat load and the number of the stage, we note that the thermal load is practically constant in each case. Thus, the reflux ratio can be any range studied, because it does not influence the separation in considerable improvement in economy and not the thermal load of the reboiler. Therefore, we conclude that the distillation column contains 15 theoretical stages that cannot influence the efficiency of the column and CD-2 at the same time, saving materials in the construction of the equipment.
Looking at figure 11, we conclude that the feed plate has to be close to the bottom of the column. Therefore, the supply was made in the plate 8 with a reflux ratio of 0.06 and is a type column filling.
The separation of triacetin was performed at atmospheric distillation column (CD-3). The minimum number of stages and minimum reflux ratio are 24 and 1.228, respectively. The number of theoretical stages is calculated between 43 and 61. The feed plate is calculated between 10 and 13. The influence of the reflux ratio in molar composition of the overhead product triacetin and used in the reboiler heat load is shown in figures 12 and 13. The influence of the feed plate triacetin molar composition of the overhead product is shown in figure 14.
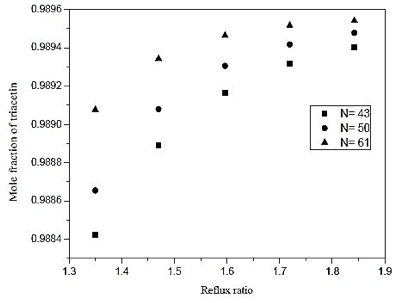
Fig. 12. Effect of reflux ratio and number of stages in formation of triacetin acid on distillation column 3 (CD-3).
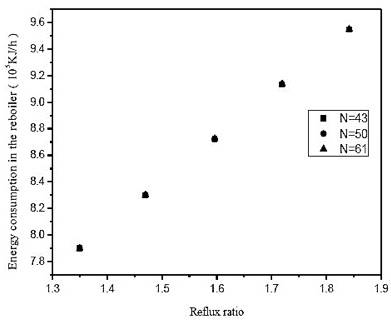
Fig. 13. Effect of reflux ratio and number of stages in energy consumption in the reboiler on distillation column 3 (CD-3)
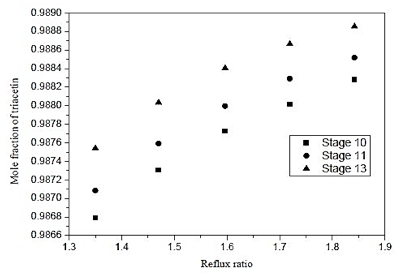
Fig. 14. Effect of reflux ratio and feed-stage in formation of triacetin of distillation column 3 (CD-3)
By means of figures 12 and 13, we see a 10% increase in the reflux ratio results in an increase in the fraction of 0.048% triacetin in the overhead product, and a 5% increase in thermal load on the reboiler. In figure 12 we also note that at low reflux ratios, increasing the number of theoretical stages leads to an improvement in separation. However, at reflux in the lower graph of the analysis to the increase of 0.01%, is required a 41% increase in the number of theoretical plates. Therefore it is not feasible to build the equipment, the largest number of stages, in addition the, cost is much lower for the lower stage numbers. From figure 13, it is noted that the number of theoretical stages does not affect the thermal load of the reboiler. Therefore, wer chose to operate at low reflux ratio and low number of theoretical stages.
Figure 14 shows that feeding may be performed in any of the dishes analyzed, however, to feed the plate 13, one obtains a slight improvement in the separation of 0.08%.
Figure 15 shows the comparison of industrial utilities employed in the construction of the pilot plant. Note that the PFR reactor has 48% of the total energy used in the unit, it is compatible due to the changes in glycerol, that requires high levels of energy compared to other equipment.
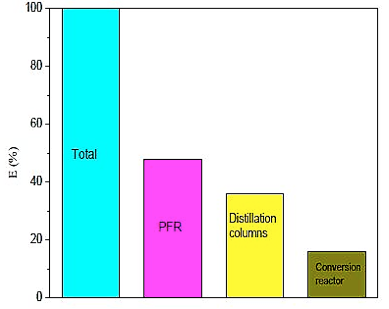
Fig. 15. Comparison of energy between the equipments of pilot plant.
Figure 16 shows that the highest yield of triacetin results, in not larger pilot plant energy consumption, this fact can be attributed to the mild conditions employed in the process and the kinetics of the reaction itself. It is noted that low productivity and high energy consumption, the use of the associated operating conditions unfavorable for the production of triacetin as shown in figure 3.
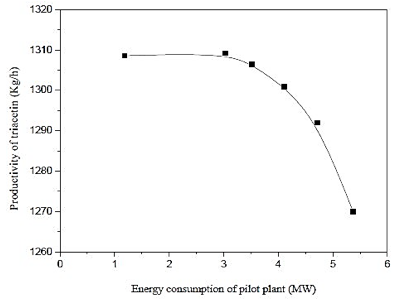
Fig. 16. Effect of energy consumption of pilot plant by productivity of triacetin.
Through the relationship of recovered energy / power required formula described below, there is a relationship with the amount of triacetin produced in terms of energy invested in the process.
Where: ∆Hr – Heat of reaction, Qp – Consum energy plant, X – Conversion, Є Recovered energy / power required.
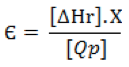
The value obtained is Є = 0.853 and this result is between 0 < Є < 1, then a higher energy used in the process will favor the formation of triacetin.
The simulation and the development of the pilot plant for the production of triacetin from glycerol were simulated through the Hysys process simulator as a tool to aid the design process. Note that this tool performs effectively the mass balances, energy balances and equipment sizing. Major equipment presente in the process are: pumps, distillation columns, reactors (PFR and conversion) and heat exchangers. The whole process is designed with the aim of obtaining the best arrangement in such a way that took into account the following parameters: lower consumption of industrial utilities, process safety, cost to purchase equipment and lower energy consumption.
The developed process is capable of feeding of 552.57 kg/hr of pure glycerol, 1,441.2 kg/h of acetic acid and 294.24 kmol/h of sulfuric acid. The reaction was performed in a PFR reactor of 10 m³ capacity, at a temperature of 250 ° C and pressure of 4 atm obtaining these conditions 99.07% conversion of glycerol. The conversion reator was used in order to remove H2SO4, so that such equipment is supplied with a stream of NaOH in the same molar amount of the acid. The separation vessel is employed in order to separate the substances from the salt formed Na2SO4 converion in the reactor, since it is highly corrosive and detrimental to the distillation columns.
The distillation column (CD-1) has the function to promote the separation of water as overhead product. It was simulated with a reflux ratio of 2.76 and with 30 theoretical stages. The distillation column (CD-2) has the function to promote the separation of acetic acid as bottom product. This tower was simulated with a reflux ratio of 0.05 and with 15 theoretical stages. The distillation column (CD-3) has the function to promote the separation of triacetin as top product. It has simulated a reflux ratio of 1.35 and with 43 theoretical stages. The triacetin is produced with a purity of 99.85 mol % and the molar amount of 5.9979 kmol/hr.
Through energy analysis, it was found that among industrial utilities used in the pilot plant reactor PFR is 48% of the total energy consumption and the highest productivity triacetin does not result in a higher energy consumption. On the other hand, greater energy employed in the process favors the formation of triacetin.
[1] SILVA, L. N.; GOLÇALVES, V.L. C.; MOTA, C. J. A.; Catalytic acetylation of glycerol with acetic anhydride. Catalysis Communications, v. 11, p. 1036-1039, mai. 2010.
[2] BALARAJU, M. P.; NIKHITHA, K. J.; SRILATHA, K.; SAI PRASAK, P. S.; LINGAIAH, N.; Acetylation of glycerol to synthesize bioaditives over niobic acid supported tungstophosphoric acid catalysts. Fuel Processing Technology, v. 91, p. 249-253, oct. 2010.
[3] MOTA, C. J. A.; SILVA, C. X. X.; GONÇALVES, V. L. C.; Gliceroquímica: novos produtos e processos a partir da glicerina de produção de biodiesel. Química Nova, v. 32, n. 3, p. 636-648, mar. 2009.
[4] GONÇALVES, V. L. C.; SILVA, N. L.; MOTA, C. J. A.; Catalytic metylation of glycerol with acetic anhydride. Catalysis Communications, v. 11, p. 1039-1039, mai. 2010.
[5] RAHMAT, N.; ABDULLAH, A. Z.; MOHAMED, A. R.; Recent progresso n innovative and potential Technologies for glycerol transformation into fuel additives: A critical review. Renewable and Sustainable Energy Reviews, v. 14, p. 987-1000, nov. 2010.
[6] GALAN, M. I.; BONET, S. R.; RENEAUNE, J. M.; PLESÇU, A. E.; From residual to useful oil: Revalorization of glycerine from biodiesel synthesis. Bioresource Technology, EUA, v. 100, n.1, p. 3775-3778, mar. 2009.
1. Departamento de Engenharia de Produção, Campus Universitario Minstro Petronio Portela –Universidade Federal do Piaui, Teresina, Piaui, Brasil. Email: assismota@ufpi.edu.br