HOME | ÍNDICE POR TÍTULO | NORMAS PUBLICACIÓN
 Espacios. Vol. 37 (Nº 16) Año 2016. Pág. 11
Carlos Alberto Klimeck GOUVEA 1; Alessandra Novak dos SANTOS 2; Ana Lúcia BERRETTA-HURTADO 3; Marcelo MACEDO 4
Recibido: 18/02/16 • Aprobado: 13/03/2016
ABSTRACT: The study on students' behavior at different educational levels and its behavior inside and outside of school constitutes a method for evaluating if environmental education is achieving its desired effects. In a case study, 661 students were interviewed from grade school students, high school students, and college students using questionnaires prepared to assess the perceptions these students have about school and learning about environmental issues, the evaluation of behavior regarding this theme and if these students see themselves as agents participating in environmental changes. Surprisingly, the results showed that students did not demonstrate improvements in their pro-environmental behaviors based on the number of classes on the subject, showing that family habits display a greater impact as determining factors, as well as different the social classes interviewed are distinct from each other. |
RESUMO: É consenso que a educação e, especialmente, a educação ambiental é a solução para os problemas ambientais. O estudo do comportamento dos estudantes nos diferentes níveis de ensino e o comportamento desses estudantes dentro e fora da escola constitui uma forma de avaliar se a educação dessa temática está surtindo os efeitos desejados. Foram entrevistados 661 alunos de escolas do ensino fundamental, médio e superior, através de questionários que objetivaram avaliar a percepção que esses alunos têm sobre a escola e o ensino de meio ambiente, a avaliação do comportamento em relação ao tema e se esses alunos se veem como agentes participantes das transformações do meio. Surpreendentemente, os resultados mostraram que os alunos não demonstraram avanços em seus comportamentos pró-ambientais na medida em que receberam mais aulas sobre o assunto, mostrando que os hábitos familiares são mais determinantes, assim como as diferentes classes sociais entrevistadas distinguem-se entre si. |
Education has been seen as a key to the development and quality of life, not just for individual improvements, but for humanity as a whole. A systematic research for understanding environmental attitudes began in the last century, in the beginning of the seventies and now it is a clearly defined field of study, according to many studies [1-5].
However, defining behavioral attitudes is not as simple as it sounds. Changes in individual attitudes, (including understanding and knowledge) are related to the channeling of education and awareness towards environmental conversation [6]. The attitude can be understood as an evaluative response, predisposing the individual to consider various behavioral alternatives. A very relevant position on attitude concepts, about envisions connections among knowledge, values and actions is found in literature [7], where the researcher identifies every attitude consists of the following three basic components:
(1) Informational: beliefs, knowledge and information an individual understands about an object;
(2) Emotional: idea, feeling and values of a person (positive, neutral or negative); and
(3) Behavior: the tendency of a person to act in a particular manner.
There are other important studies that seek to evaluate the environmental attitudes in different approaches. From the psychosocial point of view, environmental attitudes are concentrated on beliefs, in which the consequences from the respective environmental deterioration can cause, to other humans or to the biosphere [3]. Researchers [3,4] argues that environmental attitudes are rooted in the concept of the very person and the degree the individual considers himself/herself to be an integral part of the natural environment. Other authors consider environmental attitudes based on other perspectives: The Anthropocentric Dimension - evaluates the quality of the environment for its contribution to the quality of human life and The Ecocentric Dimension – these values nature based on its own value [4].
Environmental problems are becoming more and more relevant at all educational levels, including college. An original purpose of the university is to serve the community as a place for communication and the circulation of critical thinking. Environmental education is a process in life that begins in a family, goes on to school and prepares a new individual and begins a new cycle [8]. The modern university has transcended this conceptualization of a larger institution to educate and prepare humans for active living and social responsibility in the world [9].
Among the tools used for assessing the attitudes, the most common are those that are based on using the closed answer questionnaires, using for example: the Likert rating scales. Likert surveys are the most common when it comes to collecting information quickly, as they are easy to evaluate and, if they are prepared as such to comply with their required proposal, they can faithfully fulfill their role [10]. However, for an evaluation of the data collected from opinion questionnaires, statistical tools should also be applied.
Most scales that propose to assess environmental attitudes were designed to be applied to a broad range of the population, such as samples from the general public [5, 11] and some authors [12-13] to discover the environmental attitudes of students in elementary, middle and high schools. Attitude scales have also been used to discover the influence of practical schoolwork in the field and infrastructure of educational institutions on environmental attitudes of students in the 9th to 11th grades in high schools [14].
In general, there is consensus that education on all school levels is considered vital in the preparation of pro-environmental attitudes [15-16]. This theory states attitudes are important for behavior, but the intent does not directly determine behavior, but it only influences and shapes our actions. Theories of social and health psychology assume that intentions may cause behaviors. Studies use modern statistical methods to summarize the results of a body of primary studies and provide convincing empirical evidence for the set of intentions as a predictor of environmental behavior [17], that highlighted the influence of Internal factors called Environmental Consciousness, (which include such values as: knowledge, feelings, emotional involvement or psychological benefits), and external factors (as social infrastructure and cultural factors, economic status, etc.
There has been a remarkable study in grade school confirming the incorporation of environment teaching in the early school years leads to attitudes of environmental responsibility. At higher education level there are some models that analyze the relationship between environmental attitudes and behaviors [18-27].
It is extremely difficult to measure environmental attitudes and ecological views of people related to the world, since many elements influence the relationship among humans and nature. Thus, the financial outlook for the respective exploitation of nature, the economic conditions and other conditions, such as locational, social, cultural, beliefs, values, and many others play a key role in the relations that people and students have with nature [28].
Considering the fact that not all school studied here have subjects which include practical fieldwork in environment issues or specific courses on the subject, it is justified to develop its own scale. Creating a specific scale is crucial due to the reasons already mentioned and also because not all responders are the same age in grade school is capable to understand a range of responses as proposed on the Likert scale. This study aims to assess the behavioral attitudes of responding students in grade school, high school, college, and graduate courses on their pro-environmental attitudes.
A questionnaire was prepared and handed out to assess environmental perceptions, there were 14 questions and it was possible to answer very simply, such as: - I agree, no opinion, disagree; and handling waste products: always, sometimes and never - for most issues. The proposed questions sought to evaluate three aspects: a) the point of view of the school and the teaching environment (5 questions); b) behavioral assessment (8 questions); c) understanding of environmental responsibility (1 question) (Table 1).
Table 1 Questions proposed separated in its 3 aspects
Aspect |
Question |
a |
Do you have course on environmental issues at school? With environmental subjects are addressed in the classroom? There is any environmental projects at school? Do you participate in these projects? What this classes discuss about? |
b |
1-Do You Sort Trash at Home? Do you think about reuse before discarding trash? Do you Turn Off the Light When Leaving a Room? Do you Turn Off the Tap While Brushing Teeth? Do you Leave Food on your Plate? Do You Reuse Paper as Scratch Paper? Are You Dedicated to Recycling? Do you Separating Garbage at Home? Do you Separating Garbage at School? |
c |
What is the most responsible agent for environmental problems? |
The study sample consisted of 248 grade school students (1st through 9th grade), 299 high school students (1st to 3rd year) and 114 undergraduate students in some engineering courses. Five different schools in a middle town were studied, separated by social classes, which are displayed on Table 2.
Table 2 Number of students interviewed, their grades in school
and social levels of the educational institution.
Educational Level |
Age (years) |
School (neighborhood) |
Responders |
Grade school (1st to 8th) |
10 to 16 |
A – private (upper class) |
78 |
B – private (middle class) |
66 |
||
C – public (lower class) |
104 |
||
High school (1st to 3rd) |
14 to 18 |
A – private (upper class) |
17 |
B – private (middle class) |
225 |
||
C – public (lower class) |
57 |
||
College courses |
18 to 31 |
B – private (middle class) |
114 |
Environmental behavior was evaluated in distinct two phases. First, among the different school levels and then among social classes, here they are sorted as A, B and C, on the grade school and secondary levels. The adherence of the results obtained from the questionnaires employed the statistical method of X-square (X2), known as chi-square, for the evaluation of the dispersion results (equation 1) using reliability level as 5% [348]:
X2= Σ [(p - e)2 /e] (1)
Whereas: p = observed attendance for each class; e = expected attendance for each class
In equation (1), the value of (p - e) is the deviation. Using the reliability level as 5%, depending on the possibilities of the event, extract the critical chi-square value from Table 2 (XC2), from which X2 is calculated for comparison, considering the degree of tolerance (DF) which is equal to the number of possible answers minus 1 (Table 3):
Table 3 Critical value of X2 for 5% reliability
based on the degree of tolerance
|
Xc2 |
0.05 |
|
1 |
3.841 |
2 |
5.991 |
3 |
7.815 |
4 |
9.488 |
5 |
11.070 |
... |
The perception of the school and the teaching environment
The first of the five questions presented intends to assess the perception on the presence of environmental classes in school and the second question asks which(s) subject(s) considers this topic. The question answers were calculated by the method of chi-square for evaluation of dispersion, and the results from the first 5 questions are presented on Table 4.
Table 4 Analysis of Dispersion Results for the inquiries on the perception of the
school and the teaching environment
Teaching level |
NO Answers |
YES Answers |
Number of Responders |
Grade school |
|
|
|
(p) |
47 |
201 |
248 |
(e) |
59.65 |
152.70 |
|
(p-e)2/e |
2.683 |
15.278 |
|
High school |
|
|
|
(p) |
33 |
266 |
299 |
(e) |
71.92 |
227.10 |
|
(p-e)2/e |
21.062 |
6.663 |
|
College |
|
|
|
(p) |
79 |
35 |
114 |
(e) |
27.42 |
86.60 |
|
(p-e)2/e |
97.028 |
30.746 |
|
Total of responders |
159 |
502 |
661 |
G.L. = 2 |
Xc2 = 5.991 |
X2 = 173.453 |
|
As a result, in 248 grade school students, 53 of them (21.4%) answered they did not study that type of subject or said that subject is considered different from other subjects, such as English, Gym, Religion and Art classes, leading to the interpretation that these students did not recognize any course that included this subject. However, when asked in multiple-choice questions on environmental subjects addressed in the classroom, such as: pollution in water, soil, and air, as well as trash, etc., absolutely everyone was able to relate to these subjects taught, emphasizing the fact that no student chose to select any of the other options.
When the first question was asked to the 289 students from high school, 33 of them (11.4%) they all answered that they did not study about any environmental subjects in class school.
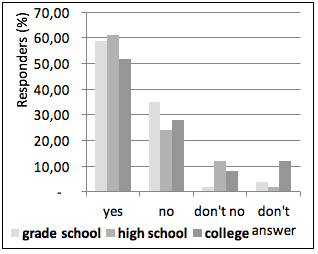
When the proposition was introduced to the college students, 79 students of the total 114 (69.3%) said that was no course on environmental issues, however, all mentioned issues were debated on the environment in the classes (Figure 1).
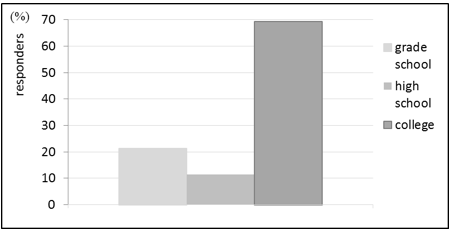
Figure 1 Students from different education levels realize NOT have any classes on the environmental issues
The interpretation of this fact is not so simple and can be understood in several ways. Part of grade school students and high school students can respond jokingly, not taking the survey seriously being conducted, a childish characteristic in our national culture. This can be evidenced when mentioning that the environment subject is covered in classes on sports or art. Others often find themselves in a lethargic state, not connecting between what, where and when it is taught, just selecting items they have heard about without realizing that the question refers to the subject taught in the classroom. In college courses, many students understand they only have environment class when the term "environment" in included in the name of the course. They can also consider that they have not studied this course yet, so they answer they did not study an environment course that semester.
Based on the data in Table 2, we see that X2 is equal to 173.453, ie, X2 > XC2, so there is no relationship among the groups, indicating that the behavior is independent in each of the sampled groups. For better understanding the point of view of students about what they have learned about environment studies in school, they were surveyed about the existence of environmental projects at school (Figure 2) and if they participated in these projects or not (Figure 3).
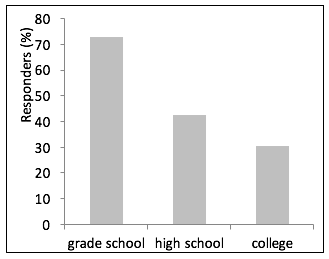
Figure 2 Perception of existence of projects on environmental subjects |
Figure 3 Participation on environmental projects |
The comparison between the levels of education in the perception of existence of environmental projects at school is quite interesting. Even the grade school students are required to engage in projects, a very significant percentage (59.3%) stated there is mandatory project participation and it is linked to final grade, compared to 40.7% of students who said they had no classes on the environment, as they did not know if this was taught or not or even give an opinion. As Figure 3 reports, more than 70% of grade school students are working on environmental projects, it seem that part of the 40.7% who say there is no environment classes are working on it, but they do not seem to be unaware of what it is. The interest in this subject is slightly higher in the high school level, as 60.3% of responders are aware of the existence of environmental projects in their schools. As participation is not mandatory in all the evaluated educational institutions, the maturity and age seem to explain if they know if this subject is taught or not in school.
As there is no requirement in the college level, coupled to the fact that the interviewed students work during daytime, then participation in environmental projects is lower. 30.5% of the students participating in the project, more than half of them did not participate because they did not have the time or lack of interest. However, the added percentage that answered "do not know" or "do not have any project", it is almost double to the students from grade school and high school. This also shows that unawareness is much greater in this interviewed group.
Applying the Chi-square in equation (1) with two degrees of tolerance, for the YES answers in Figure 2 this is how Table 5 was generated.
Table 5 Analysis of Dispersion Results on the existence and participation in environmental projects
Teaching level |
YES Answers |
NO Answers |
Number of Responders |
Grade school |
|
|
248
|
(p) |
147 |
101 |
|
(e) |
144.45 |
103.55 |
|
(p-e)2/e |
0.045 |
0.063 |
|
High school |
|
|
299
|
(p) |
179 |
120 |
|
(e) |
174.15 |
124.847 |
|
(p-e)2/e |
0.135 |
0.188 |
|
College |
|
|
|
(p) |
59 |
55 |
114 |
(e) |
66.40 |
47.60 |
|
(p-e)2/e |
0.824 |
1.150 |
|
Total responders |
385 |
276 |
661 |
G.L. = 2 |
Xc2 = 5.991 |
X2 = 2.405 |
|
It was concluded that the behavior from the three levels is the same, since X2 is 2.405, lower than the XC2. Furthermore, we proposed a final question for the evaluation of this aspect, which seeks to identify which subjects on the environment were discussed the most in class. This question seeks to certify if all students have classes on the environment topic, if the classes, somehow, were perceived and what made the biggest impression (Figure 4).
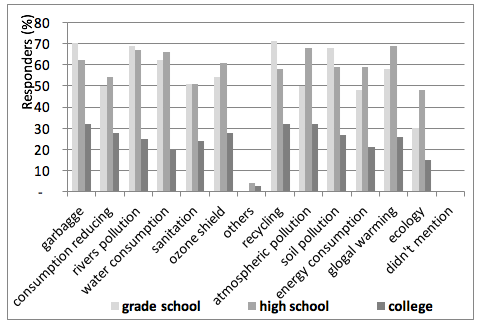
Figure 4 Subjects discussed in environment classes
Initially, it should be clarified that the graph in Figure 4 is cumulative and it does not display a 100% average, because the students may mention more than one subject that deals with this. Figure 4 is extracted first of all, on all the subject relating to the environment as mentioned by more than 50% of grade school students and, in much the same way, the high school students cite all subjects as having been studied in the classroom. However, data on students in the college level display consistency, since less than 30% on an average of the students reported having debated the topic in the classroom, and only 30.7% of students reported having classes on environment issues. An interesting finding is that the percentage of subjects that deal with environmental issues reported by students in the college level is the same as for students in the lower levels.
Behavioral Assessment
The 8 questions were presented to the responders randomly, but here are discussed in groups to evaluate the pro-environmental behavior at home and at school, separately. The results were analyzed on the subjects to assess the pro-environmental behavior at home environment (Figure 5).
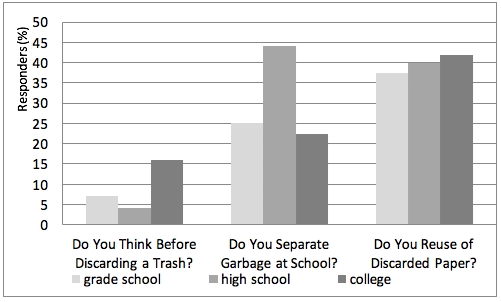
Figure 5 Behavioral values transferred by the family
Regarding the answers to the questions asked, "Always" means that the practice takes place, however, when the answer is "Sometimes" or "Never" means there is not habit, so it is understood to mean a simple "NO". Based on these considerations, we analyzed the dispersion of the results (Table 6).
Table 6 Analysis of Results Dispersion on the family value inquires
|
Do You Sort Trash at Home? |
Do You Turn Off the Light When Leaving a Room? |
Do You Turn Off the Tap While Brushing Teeth? |
Do You Leave Food on Your Plate? |
Responders Based on grade in School |
||||
|
YES |
NO |
YES |
NO |
YES |
NO |
NO |
YES |
|
Grade school |
|||||||||
(p) |
137 |
111 |
82 |
166 |
195 |
53 |
87 |
161 |
248 |
(e) |
145.57 |
102.43 |
121.94 |
126.06 |
196.56 |
51.38 |
84.38 |
163.50 |
|
(p-e)2/e |
0.505 |
0.717 |
13.081 |
12.652 |
0.012 |
0.051 |
0.082 |
0.038 |
|
High school |
|||||||||
(p) |
186 |
113 |
159 |
140 |
241 |
58 |
96 |
203 |
299 |
(e) |
175.51 |
123.49 |
147.01 |
151.98 |
233.08 |
60.94 |
100.80 |
195.33 |
|
(p-e)2/e |
0.627 |
0.891 |
0.978 |
0.944 |
0.270 |
0.142 |
0.229 |
0.301 |
|
College |
|||||||||
(p) |
65 |
49 |
84 |
30 |
88 |
26 |
42 |
72 |
114 |
(e) |
66.92 |
47.08 |
56.05 |
57.95 |
90.39 |
23.63 |
38.81 |
75.21 |
|
(p-e)2/e |
0.055 |
0.078 |
13.938 |
13.481 |
0.063 |
0.237 |
0.262 |
0.137 |
|
Total of responders |
388 |
273 |
325 |
336 |
524 |
137 |
225 |
436 |
661 |
G.L. = 2 Xc2 = 5.991 |
X2 = 2.873 |
X2 = 55.070 |
X2 = 0.775 |
X2 = 1.049 |
|
||||
Based on this premise, the evaluation about Sort Trash shows that around 50% of responders have such a habit at home and there is no meaningful distinction between groups. Regarding Turn Off the Light, there is a decrease in this behavior as educational cycles progress, however, the same behavior is present based on increasing age, which also infers a greater degree of attention in daily habits. As age increases, there is also a conscience increase regarding the value of money, which can unlink a conscious environmental action. The results presented in Table 5 clarify the scattering of the results, i.e., there is no dependence for this item.
Now, the question about Turn Off the Tap, the family habit is predominate in transferring this to the children, and it turns out that there is no behavioral difference between grade levels in terms of chi-square results which is seven times less critical than chi-square, as shown in Table 5. This observation is confirmed by the response to question about Leave Food on Plate which has displayed results with similar dispersion, showing that family values are equivalent to different school levels.
Thus, the results from Sort the Trash at Home are compared to Leave Food on Plate and Turn Off the Tap, the family values are confirmed and imply similar pro-environmental behaviors at different school levels. The three proposed questions refer to the same pro-environmental behavior when the interviewed student is not in the family environment, for verifying if the behavior of the individual is away from his/her family nucleus, abides by the behavior of the group or if the family behavior is already ingrained in the person (Figure 6).
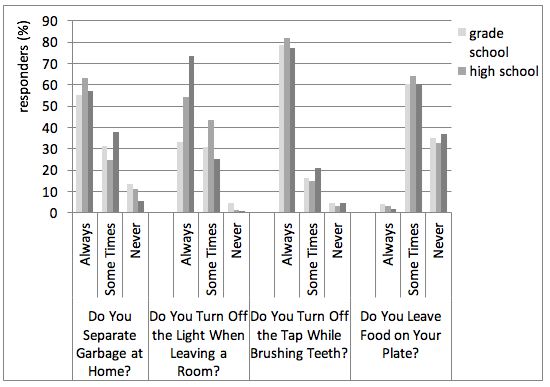
Figure 6 Behavioral values transferred by the school
Regarding reusing discarded paper, this will only be possible if the paper used is available, therefore, the best access is for students in the college level, as grade school students certainly do not use the printer in their daily school routine and, usually high school students do not have much access to the printed paper. Thinking Before Discarding Trash requires more concentration, which normally occurs from becoming more mature and Sorting their Trash at School is related to the school environment infrastructure. As the selective bins are present in the interviewed schools, then to understood the question about Sort Trash at School is more appropriate in evaluating the relationship between education and pro-environmental behavior. Thus, the high school level students demonstrated more pro-environmental behavior than the others, as 43% of responders sorted waste at school. To analyze the distribution results for the question over Sort Trash at School treatment was conducted separately from the responses of grade school students and high school students separately in order to ascertain whether these results were similar. Then the results of the college students were compared to high school students for the same purpose (Table 7).
Table 7 Results Dispersion in the evaluation of the influence of education on pro-environmental behavior
School level |
YES Answer |
NO Answer |
Number of Responders |
YES |
NO Answer |
Number of Responders |
Grade school |
||||||
(p) |
63 |
185 |
248 |
|
|
|
(e) |
61.657 |
186.34 |
|
|
|
|
(p-e)2/e |
0.029 |
0.0096 |
|
|
|
|
High school |
||||||
(p) |
|
|
|
129 |
170 |
299 |
(e) |
|
|
|
112.94 |
124.847 |
|
(p-e)2/e |
|
|
|
2.284 |
1.386 |
|
College |
||||||
(p) |
27 |
87 |
114 |
27 |
87 |
114 |
(e) |
28.34 |
85.66 |
|
17.85 |
70.94 |
|
(p-e)2/e |
0.063 |
0.021 |
|
4.693 |
3.636 |
|
Total of responders |
90 |
272 |
362 |
156 |
257 |
413 |
G.L. = 2 Xc2 = 3.841 |
X2 = 0.123 |
|
X2= 11.999 |
|
||
The behavior of high school students was shown to be independent from the others. The sorting of trash at home is a family's behavior while in school this behavior was not verified as incorporated by people. Students in college course are adults, who are conscious of their actions in everyday life. However, the data led us to believe that concern for the environment and the impacts of our actions on the environment issues addressed in formal education did not result in a pro-environmental behavior. Regarding the assessment of family influence on pro-environmental behavior for grade school and high school education, based on the three classes studied, it is possible to draw some conclusions (Figure 7).
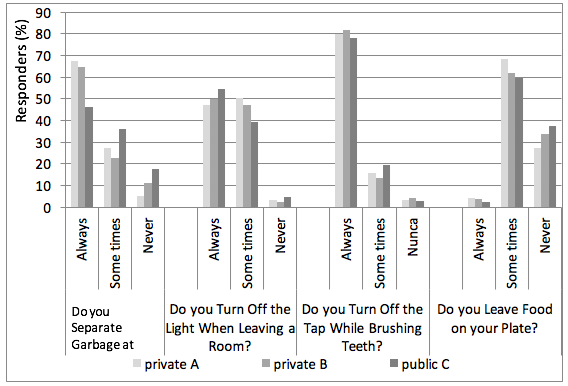
Figure 7 Behavioral values transferred by the family to different social classes
First, it appears that the higher social class has a more consolidated practice of sorting trash, since they have the highest rate of "YES" answers, and the lowest rate in the "NEVER" response. However, the sample group in the three social classes is not independent, since chi-square is 17.533 for the Xc2 5.991, the C Class is notably different in its behavior in the groups (Table 8).
Table 8 Result Dispersion for the different social classes
Question |
X2 |
Do You Sort Trash at Home? |
17.533 |
Do You Turn Off the Light When Leaving a Room? |
2.331 |
Do You Turn Off the Tap While Brushing Teeth? |
0.843 |
Do You Leave Food on Your Plate? |
3.973 |
In the item Turn Off the Light the percentages are very close, making it difficult to establish a conclusion, as the same phenomenon observed in Turn Off the Tap. These two items are dependent groups with chi-square equal to 2.331 for the first question and 0.843 for the second.
When the question is about Leave Food on Plate, despite the uniform behavior of the group with chi-square equal to 3.973, this behavior is emphasized and more predominant in the highest social class. Certainly, the value attributed to food is higher in lower social classes in a developing country, which results in a greater respect for food on the plate. This has to be considered, as the value of food in the family is very similar to sorting trash. In this way, the higher social classes have the intention to take care of the environment by sorting trash, but do not respect and value as much when it comes to teaching about saving and respecting natural resources, as food and water.
Understanding of environmental responsibility
The last question asked to the responders objectively assesses the awareness of the individual's role in modifying the environment on a broader level, placing each one as co-participant of the environmental degradation process, either directly or indirectly (Figure 8).
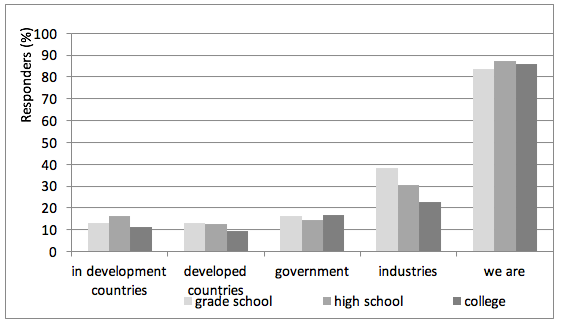
Figure 8 Question "What is the most responsible agent for environmental problems?"
From the graph in Figure 7, we can see the inquiries from the surveyed public, it does not matter what the educational levels and related ages are, most people see themselves as agents for changing the environment, causing pollution to a greater or lesser degree, therefore they play a role in environmental conservation.
In this way, behavioral changes must be promoted in the formal education environment and exercise a similar role as the family in determining conscious behavior and unconscious actions, both in environmental degradation in a movement to assure its preservation. Family values are so strong that they do not differentiate in a child's grade school or in college, since the dispersion of the results was X2 = 0.783 for XC2 = 5.991. Therefore, homogeneity is evident in the results and it is clear that the formation of values in the family seems to have a more decisive effect on the behavior than new knowledge promotes in the unconscious behavior of individuals.
Their older age demonstrates that this maturation is based on their age, which results in the observed results and consequent dispersion behavior. Thus, it is understood that the family culture is transferred an equal basis to students regardless of grade level.
Pro-environmental behavior evaluated among different social classes, shows that the higher social classes handle their trash better than the others. The lowest social class is the portion that does not show homogeneity within the group. The pro-environmental behavior based on family values and passed by formal education does not seem to be sufficiently effective. The homogeneous way the responders answered was remarkable on all levels of the study, makes us understand that the responsibility for environmental problems is for everyone, and not delegated to third parties to blame for problems related to the environment, which indicates that responders in schools in the region in question are aware of their role in the world, but without any concern to be an active part in contributing to environmental improvement or sustainability. Based on these results, it is understood that past habits are crucial for families in all age groups, being more prominent in the younger students, as stated by [16]. Unfortunately, the teaching of this subject has not displayed that those who study it develop any critical sense, even in children who are still receiving the first information.
[1] Courtenay-Hall, P., Rogers, L. Gaps in mind: problems in environmental knowledge- behaviour modeling research. Environmental Education Research. Vol. 8. (3). 2002. pp.283-297.
[2] Kaiser, F.G., Wolfing, S., Fuhrer, U. Environmental attitude and ecological behaviour. Journal of Environmental Psychology. Vol. 19. 1999. pp. 1-19.
[3] Schultz, P.W., Zelezny, L. Values as predictors of environmental attitudes: evidence for consistency across 14 countries. Journal of Environmental Psychology. Vol. 19. 1999. pp. 255-265.
[4] Thompson, S. C. G., & Barton, M. A. Ecocentric and anthropocentric attitudes toward the environment. Journal of Environmental Psycology. Vol. 14. 1994. pp. 149-158.
[5] Wiegel, R. H. & Wiegel, J. Environmental concern: The development of a measure. Environ. Behav.. Vol. 10. 1978. pp. 3-15.
[6] Hassan, A., Juahir, H., Jamaludin, N.S. The level of environmental awareness among students to fulfil the aspiration of National Philosophy of Education. Am. J. Sci. Ind. Res. Vol. 5. 2009. pp. 50-58.
[7] Luthans, F. Organizational Behavior. McGraw-Hill, New York. 2002.
[8] Cetin, G., Nisanci, S.H. Enhancing students' environmental awareness. Procedia Social and Behavioural Sciences. Vol. 2. 2010. pp. 1830-1834.
[9] Webb, T.L., Sheeran, P. Does changing behavioral intentions engender behavior change? A meta-analysis of the experimental evidence. Psychological Bulletin. Vol. 132. 2006. pp. 249-268.
[10] Sharon, T. & Wright, A. Giving "teeth" to an environmental policy: Adelphi study at Dalhousie University. J. Cleaner Prod.. Vol. 14. 2006. pp. 761-768.
[11] DeVellis, R.F.. Scale development. Theory and applications. In: Applied Social Research Methods Series, vol. 26. Sage, Newbury Park, CA. 1991.
[12] Leeming, F. C., Dwyer, W. O., & Bracken, B. A. Children's environmental attitude and knowledge scale: Construction and validation. The Journal of Environmental Education. Vol. 26 (3). 1995. pp. 22-31.
[13] Misiti, F. L., Shrigley, R. L., & Hanson, L. Science attitude scale for middle school students. Science Education. Vol. 75(5). 1991. pp. 525-540.
[14] Smith-Sebasto, N. J., & D'Costa, A. Designing a Likert-type scale to predict environmentally responsible behavior in undergraduate students: A multistep process. The Journal of Environmental Education. Vol. 27(1). 1995. pp. 14-20.
[15] Fernández-Manzanal, R., Hueto, A., Rodríguez-Barreiro, L. M., & Marcén, C. (2003/2, May-August). Qué miden las escalas de actitudes? Análisis de un ejemplo para conocer la actitud hacia los residuos urbanos. Ecosistemas. Revista Científica y Técnica de Ecologıa y Medio Ambiente. Retrieved August 10, 2003, from http://www.revistaecosistemas.net/pdfs/pdfcompleto revista 2003 2.pdf
[16] Fernández-Manzanal, R., Rodríguez Barreiro, L. Ma, Carrasquer, J. Evaluation of environmental attitudes. Analysis and results of a scale applied to university students. Science Education. Vol. 91. 2007. pp. 988-1009.
[17] Rodriguez-Barreiro, L. M., Fernández-Manzanal, R., Serra, L. M., Carrasquer, J., Murillo, M. B., Morales, M. J., Calvo, J. M., Del Vale, J. Approach to a causal model between attitudes and environmental behavior. A graduate case study. J. Cleaner Prod. Vol. 48. 2013. pp. 116-125.
[18] Ajzen, I. Nature and operation of attitudes. Annu. Rev. Psychol.. Vol. 52. 2001. pp. 27-58.
[19] Hens, L., Wiedemann, T., Raath, S., Stone, R., Renders, P., Craenhals, E., Richter, B. Monitoring environmental management at primary schools in South Africa. J. Cleaner Prod. Vol. 18 (7). 2010. pp. 666-677.
[20] Keles, O. Evaluation of primary school students' thought about behaviour and attitudes towards environment. Energy Educ. Sci. Technol., Part B, Social and Educational Studies. Vol. 3, (3). 2011. pp. 343-359.
[21] Stern, P.C. Toward a coherent theory on environmentally significant behavior. Journal of Social Issues. Vol. 56 (3). 2000. pp. 407-424.
[22] Desha, C.J., Hargroves, K. Surveying the state of higher education in energy efficiency, in Australian engineering curriculum. J. Cleaner Prod. Vol. 18. 2010. pp. 652-658.
[23] Kullmuss, A., Agyeman, J. Mind the Gap: why do people act environmentally and what are the barriers to pro-environmental behavior? Environmental Education Research. Vol. 8, (3). 2002. pp. 239-260.
[24] Juárez-Nájera, M., Rivera-Martínez, J.G., Hafkamp, W.A. An explorative sociopsychological model for determining sustainable behavior: pilot study in German and Mexican Universities. J. Cleaner Prod. Vol. 18. 2010. pp. 686-694.
[25] Lin, P.-C., Huang, Y.-H. The influence factors on choice behavior regarding green products based on the theory of consumption values. J. Cleaner Prod. Vol. 22. 2012. pp. 11-18.
[26] Lukman, r., Lozano, R., Vamberger, T., KJrajnc, M. Addressing the attitudinal gap towards improving the environment: a case study from a primary school in Slovenia. J. Cleaner Prod. Vol. 48. 2013. pp. 93-100.
[27] Yurt, O., Cevher-Kalburana, N., Kandir, A. Investigation of the environmental attitudes of the early childhood teacher candidates. Procedia Social and Behavioral Sciences. Vol. 2 (2). 2010. pp. 4977-4984.
[28] Nisbet, E. K., Zelenski, J. M. and Murphy, S. A. The nature relatedness scale – linking individuals' connection with nature to environmental concern and behavior. Environment and Behaviour. Vol. 41(5). 2009. pp. 715-740.
1. Production Engineering Master Science, Centro Universitario UNISOCIESC, Brasil. Email: gouvea@sociesc.org.br
2. Production Engineering Master Science, Centro Universitario UNISOCIESC, Brasil
3. Production Engineering Master Science, Centro Universitario UNISOCIESC, Brasil