
 HOME | ÍNDICE POR TÍTULO | NORMAS PUBLICACIÓN
 Espacios. Vol. 36 (Nº 20) Año 2015. Pág. 3
Edmundo R. LIZARZABURU 1; Kurt BURNEO 2; Luis BERGGUN 3
Recibido: 20/06/15 • Aprobado: 02/08/2015
ABSTRACT: This present research paper, introduces one of the most important companies in the local market (Peru), Union Andina de Cementos S.A.A. (UNACEM). The company is engaged in the development and manufacture of clinker, cement and other building materials in the country and abroad, including marketing and sales as well as the operation of the dock facilities and complementary Conchan oil refinery. In the last years, their capital structure and their WACC changed because of the merger between Cementos Andino and Cementos Lima. Also, we considered the macroeconomic environment and the national cement industry, in 2012; the company had a market share of 54% and was the leader of the local market. Additionally, according to the forecast of the national economic institutions, the local construction market will have an increase of 14% in the next years. This research paper is ideal for the analysis of the capital structure of the company with the market value, and could be used within the current context of the construction sector, in view of the new projects and the growth of the local market. |
RESUMEN: El presente trabajo de investigación, presenta una de las empresas más importantes en el mercado local (Perú), Unión Andina de Cementos SAA (UNACEM). La empresa se dedica al desarrollo y fabricación de clinker, cemento y otros materiales de construcción en el país y en el extranjero, incluyendo marketing y ventas, así como el funcionamiento de las instalaciones del muelle y complementaria refinería Conchán. En los últimos años, su estructura de capital y su WACC cambiaron debido a la fusión de Cementos Andino y Cementos Lima. Asimismo, se consideró el entorno macroeconómico y la industria nacional de cemento, en 2012; la empresa tenía una cuota de mercado del 54% y fue el líder del mercado local. Además, según el pronóstico de las instituciones económicas nacionales, el mercado local de la construcción tendrá un incremento del 14% en los próximos años. Este trabajo de investigación es ideal para el análisis de la estructura de capital de la empresa con el valor de mercado, y podría ser utilizado en el contexto actual del sector de la construcción, en vista de los nuevos proyectos y el crecimiento del mercado local. |
Nowadays, many companies take decisions of each area, but in this research paper, we focus on the capital structure, that the company has to choose. This decision has to be according with the firm's goals. The capital structure decision affects the financial risk and the value of the company.
The capital structure theory helps us understand the most important factors in the relationship between capital structure and the value of the company. This research paper studies the most important concepts and definitions on capital structure, which affect financial risk and the value of the company. According to Ross (2008), the primary goal of the capital structure decision is to determine the financial leverage that maximizes the value of the company (or minimizes the weighted average cost of capital).
In this research paper, we will focus on the theories of the weighted average cost of capital (WACC) and Capital Asset Pricing Model (CAPM) with an application of UNACEM. This company is the most important cement producer of the country with operations since 1916; it was created from the fusion of Cementos Lima and Cementos Andinos during 2012 (Peru).
During 2013, the international economy showed slight signs of recovery. According to BCRP (2013), it is estimated that global growth will total 2.9%, a figure achieved in an adverse and above all, volatile environment, where emerging countries were the major contributors to growth. According to the 2013 Annual Report of UNACEM, 2 starting in the second quarter of the year, the main economics have the following behavior:
After several years of solid economic performance, the emerging economies experienced a significant deceleration, which the majority of them were able to handle thanks to the adoption of adequate policies and the fact that they had sufficient reserves and more flexible foreign exchange rates.
According to the Annual Report of UNACEM (2013): "The Peruvian economy kept up its growth streak, standing out for its macroeconomic strength despite persisting global uncertainty, and registering growth of 5.0% over 2012". This lower rate may be explained by lesser growth in private investment and private consumption, in addition to reduced exports.
Graphic 1: World's Forecast GDP Percent Change from 2010 to 2016
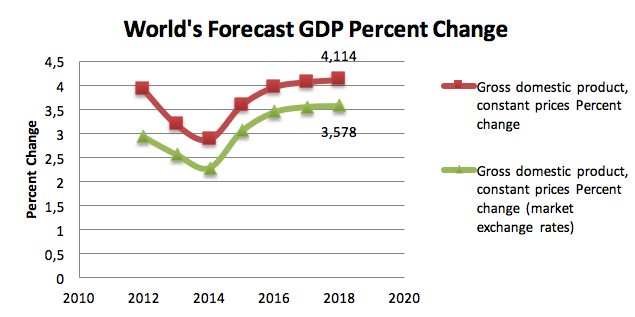
Source: Database International Monetary Fund (2014)
According to the database of the World Bank (2014), for the next years 2014 and 2015, projections of GDP growth have been revised from 3,9 to 4,1 percent and 5,5 to 5,7 percent, respectively (View in Graphic 2). Additionally, as the BCRP (2013) said in their annual macroeconomic report, the forecast in 2015 to accelerate the growth due to the start-up investment projects mainly is in the mining sector.
Graphic 2: GDP Forecast Growth (Constant 2010, in US$ Dollars)
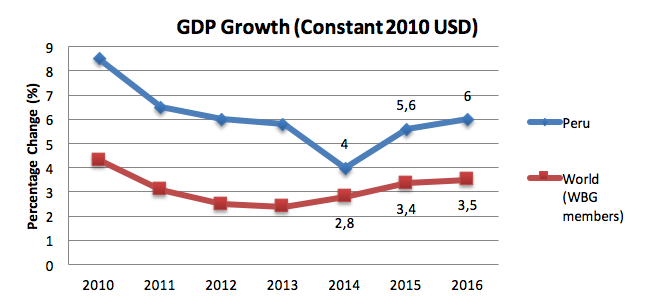
Source: Database from the World Bank (2014)
According to the investigation of the National Cement Producers Association, the introduction of cement in our country began in 1864; the initial provision was named "Roman Cement" misnomer designating a product with hydraulic qualities developed early in the century. Years later, in 1869 the canalization of Lima was made using this type of cement.
Then, in 1902, the importation of cement was 4500 Mt. Later, in 1904, the engineer Michel Fort published his studies on the Atocongo limestone deposits, pondering industrial projections use for the manufacture of cement.
In 1916 the Peruvian Cement Company Portland was established for the operation of "said quarries". According to Gonzales de la Cotera (1989), the Peruvian cement industry started its production in 1924 with the implementation of Wonders Plant, owned by Peruvian Cement Company Portland. Until 1950, the consumption in other regions was very small, mostly sourcing for import. In 1955, Chilca Cement SA production started with a small plant in the town of the same name, later becoming part of the Peruvian Cement Company Portland.
Additionally of the investigation of Gonzales de la Cotera (1985), the monopoly that actually existed in our country, centralized in the capital region, was broken with the formation of two decentralized private companies, Pacasmayo Cement in 1957 and Cemento Andino (nowadays, UNACEM) in 1958.
Subsequently, the capital company installed a small plant in the city of Juliaca, which began its operations in 1963 (nowadays called South Cement SA) and in 1966; the factory of Cementos Yura was created in the region of Arequipa. In Graphic 2, we can see the percentage of participation in the Peruvians market from all these cement companies.
Graphic 3: Local Sales of Cement per Company from 2009 to 2012
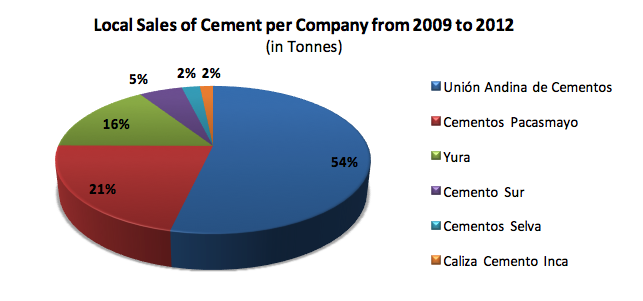
Source: Web Page of INEI (2013)
According to the National Cement's Producers Association, known as ASOCEM (2013), shipments totaled 10.48 million Mt in 2013, more than nine million 571.920 Mt. registered in 2012. In the last year, the cement production was 10.527 million Mt, that represents an increase of 6.90% compared to the nine millions in 2012. At the end of 2013, exports reached 222.98 thousand Mt of cement, reporting an increase of 11.22% over the previous year, when they were of 200,485 Mt (View in Table 1).
Table 1: National Cement Production of 2013
Months from 2013 |
Cement Production |
Total Cement Dispatch |
National Cement Dispatch |
Export of Cement |
January |
880,052 |
878,639 |
850,487 |
28,152 |
February |
804,076 |
802,005 |
786,606 |
15,399 |
March |
826,009 |
795,933 |
784,280 |
11,653 |
April |
840,167 |
868,649 |
854,956 |
13,692 |
May |
847,287 |
845,108 |
832,648 |
12,460 |
June |
828,867 |
806,811 |
795,896 |
10,915 |
July |
891,334 |
896,626 |
880,277 |
16,349 |
August |
935,844 |
931,897 |
915,490 |
16,407 |
September |
913,800 |
888,541 |
872,467 |
16,074 |
October |
916,774 |
957,226 |
939,135 |
18,090 |
November |
920,636 |
919,837 |
896,600 |
23,236 |
December |
927,988 |
889,559 |
849,011 |
40,548 |
Total |
10,532,834 |
10,480,831 |
10,257,853 |
222,975 |
Source: Web Page of ASOCEM (2013)
According to Bendezú, Espinoza, Miyahira, & Rojas (2013), nowadays, the industry is an oligopoly of 3 groups that are distributed domestically. These groups are:
According to the statistics reports of ASOCEM and many experts of the industry, the increased demand for cement is concentrated in the south, while in Lima it continued to grow at significant rates. As we can observe in Graphic 3, we can see the evolution of the construction sector and their influence of the national economy for the last six years. According to ASOCEM (2013), in the national estimation of 2014, the cement shipment continues to grow to the extent that many develop public and private infrastructure projects.
Graphic 4: Evolution of GDP Construction Sector from 2007 to 2013
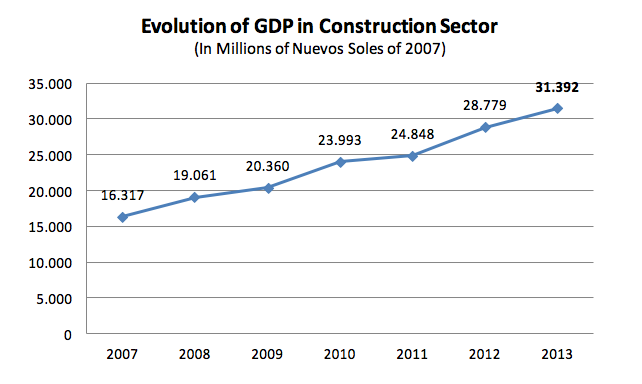
Source: Web Page of INEI (2013)
The construction sector grew by 8.6% over 2012, continuing to be the driving force of the GDP among non-primary economic sectors. While there was a drop in the rhythm of execution of roadway infrastructure and mining projects during the year, this was offset by the strong demand for housing and mall construction. It is important to note that during 2013, the sector exhibited unequal growth among regions: the south and east were the most dynamic zones, achieving growth of approximately 14.0% and 16.0%, respectively, while central Peru grew by around 7.4%.
Graphic 5: Variation of National GDP & Construction Sector from 2008 to 2013
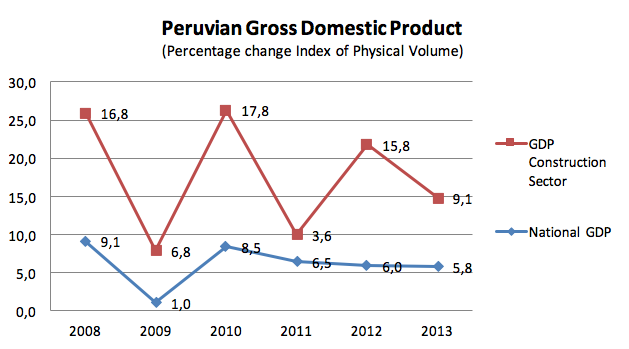
Source: Web Page of INEI (2013)
Union Andina de Cementos S.A.A is one of the last mergers of the Peruvian companies; they are the binding of Cementos Lima SAA and Cemento Andino SA. UNACEM SAA is the most important cement manufacturer in the country, controlled by a corporate national group; their matrix is the holding company Nuevas Inversiones SA (NISA). For over 60 years this company promotes an industry with solid and sustainable technology, innovation, and respect of the environment and quality. In the last year, the company has increased their assets but it has reduced their profits.
UNACEM markets its products through two business units: bagged cement and bulk cement, which represent 73.0% and 27.0% of total sales, respectively. According to the company (2013), the products sold by the business unit are bagged cement: Portland cement type I, under the "Cemento Andino" and "Cement Sun"; IP Portland cement under the "Atlas Cement" and "Cemento Andino"; IPM and cement type V, under the "Cemento Andino". Additionally, in the second half of 2013 we added to our product portfolio "Cement Apu" general purpose blended cement, which is a cheaper alternative to cement and has excellent performance.
The portfolio primarily marketed its products through two distribution channels: traditional Ironmonger channel (consisting of Network Hardware Progre-Sol and independent hardware stores) and modern hardware channel (consisting of large self-service hardware stores).
During 2013, the company decided to streamline their product portfolio by regions and cities, in an effort to serve their customers more efficiently while also increasing their market coverage levels. In many different cities such as Iquitos, Pucallpa and Ayacucho, priority was given to products from the Condorcocha Plant (where such products used to compete with products from Atocongo Plant), this achieving savings efficiency for over 3 million Nuevos Soles, added to coverage levels surpassing 94% in points of sales in Iquitos achieved in less than one year.
Graphic 6: UNACEM's Distribution of Sales per Region of 2012
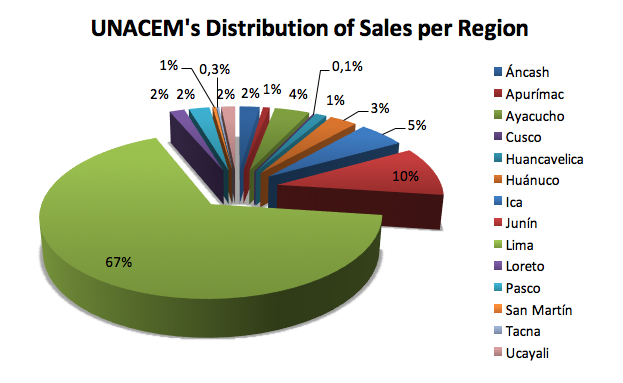
Source: Web Page of INEI (2013)
According to the web page of UNACEM (2013), they offer their customers, high quality resistors cement and are above the standards of the Peruvian American Technical Standard (NTP) and (ASTM). The product portfolio [6] consists of:
The services of the company consist in creating a relationship with the main customers and strengthen the market share of the cement & construction industry. The services are the followings:
According to the financial theory, the Finance Manager (CFO) should choose the capital structure according to the industry and the core business of the company. For that reason, the CFO is involved in Management, Financing and Investment decisions. Therefore, the stockholders only benefit with the changes on the value increase of the company.
According to UNACEM Annual Report (2013), one of their principal strategies is focused on strengthening a sustainable commercial relationship throughout the entire value chain, from the plant to the points of sale, as well as investing in improving the service provided to our clients and also to the end users of our products. Additionally in their annual report (2013): "Their financial objective in managing capital is to safeguard its ability to continue a Company in order to generate returns for shareholders, benefits for other groups of interest, and maintain optimal capital structure to reduce the cost of capital". Therefore, the company can adjust the amount of dividends paid to shareholders, refund capital to shareholders, issue new shares or sell assets to reduce its debt.
According to the annual memory [7] of the Company in 2013, their financial statements audited to December 31, 2013 show the following results:
This increase is supported by the largest volume ships; amounting to 4.7% result of increased construction activity driven by an increase in public and private investment.
On the other hand, the cost of local sales increased by 2.8% due to higher volume of cement ships and higher purchased cost of imported clinker. As a result of higher revenue, control costs and expenses, gross profit was maintained in relation to the last period and an operating income of S/. 520 million (it increased 7.3% more than 2012).
By the reports of the company, maintaining the same sale prices of cement and clinker imported large volumes in 2013, which cost twice the self-produced; in the last year, the operating income reached as in 2012. EBITDA was 9.5% higher that of 2012, thanks to the operational efficiencies and synergies from the merger (View in the Graphic 5):
Graphic 7: UNACEM Performance Results from 2009 to 2013
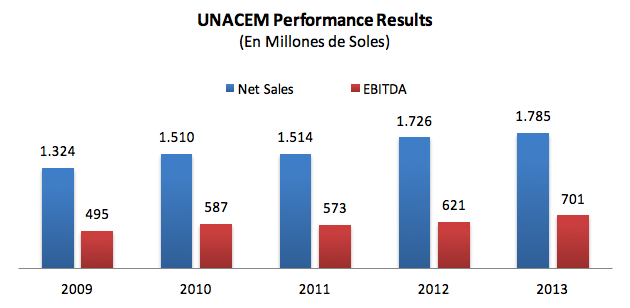
Source: UNACEM Annual Memory 2013
According to the Annual Report of the company (2013): "the financial expenses were 35.3% higher relative to the previous year, due to the increased debt by 19.5% and higher rates for the partial replacement of short-term debt in dollars, for medium-term debt at higher rates in soles, to the beginning of the year 70.3% of the debt was denominated in U.S. dollars, and generated significant foreign exchange losses".
Therefore, the company in order to avoid exposure to larger exchange rate fluctuations and increases in interest rates management, reduced exposure in U.S. debt to a level of 49.0% of total debt and dollars, to end of 2013, the long-term debt accounted for 70.0% of total financial debt, compared to 55.0% at the end of 2012.
During the year we will continue with the policy to reduce exposure to currency risk and increased interest rates.
Graphic 8: UNACEM Financial Debt 2013
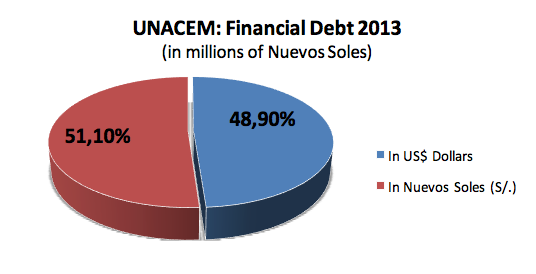
Source: UNACEM Annual Memory 2013
According to the Annual Report (2013): "the positive performance in operating terms was negatively impacted by the foreign exchange losses, as a result of which the net profit totaled S/. 204.7 million, 42.9% lower than the ones booked in 2012".
The question in every company is; how can their capital be structured on our pie model. By Ross, Westerfield & Jaffe (2008): "The pie in question is the sum of financial claims of the firm, debt and equity in this case. We define the value of the firm to be this sum (…)". For example, the value of the firm (V) is:
Equation 1: The Value of the Firm
![]()
Where B is the market value of the debt and E is the market value of the equity. As we can see in the Graphic 3, in the case of UNACEM, their pie structure average of the last years are 52% of Debt and 48% of Equity. In the last two years, UNACEM has to increase their liabilities in long-term according to their strategies. The company increases their liabilities because of their future projects that it will be financing and implementing in a context of the growth of the national market.
Graphic 9: UNACEM's Book Capital Structure from 2011 to 2013
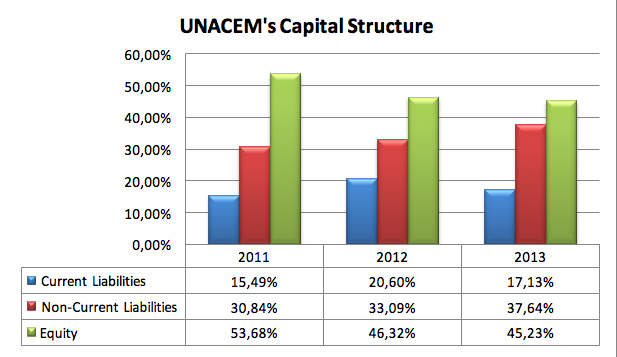
Source: UNACEM Annual Memory from 2011 to 2013
According to Harvard University, the cost of equity is an interesting part of this process, (you will cover more of this when you get to the CAPM - Capital Asset Pricing Model). This is an investor's opportunity cost. The general formula for its basic form is:
Equation 2: CAPM Formula
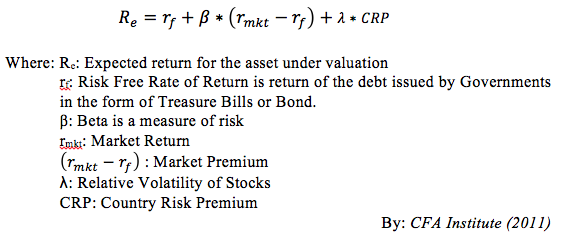
As we can observe in the table 2, here are the main equity indicators from UNACEM from the period 2011 to 2013. According to Damodaran (2008): "The risk free rate is the building block for estimating both the cost of equity and the capital". For that reason, the cost of equity is computed by adding a risk premium to the risk free rate, with the magnitude of the premium being determined by the risk in an investment and the overall equity risk premium (for investing in the average risk investment). Additionally, the unleveraged beta represents the sensibility of the market movements, the beta represent the market risks. In our case, until 2012 the unleveraged beta had outperformed the general market movements, but in the last year, it moved in the same direction of the market (Brealey, Myers, & Allen, 2010).
Table 2: Equity Indicators from 2011 to 2013
UNACEM's Equity Indicators |
2011 |
2012 |
2013 |
Risk Free Rate |
5.41% |
5.38% |
5.21% |
Risk Premium |
5.80% |
5.88% |
6.29% |
Unleverage Beta of Construction Sector |
1.12 |
1.17 |
0.75 |
Source: Web Site of Aswath Damodaran (2013)
In our days, UNACEM is listed on the stock exchange of Lima (BVL) with 1'646,503,408 common shares with a nominal value of S/. 1.00. In Table 3, we can observe the evolution and the odds ratios of their common shares, with this information, we can estimate the market value of the equity that is valued in Lima Stock Exchange Market.
Table 3: UNACEM's Odd Ratio from 2011 to 2013
UNACEM1 |
2011 |
2012 |
2013 |
Last Odds Ratio |
2.70 |
3.24 |
3.77 |
Low Odds Ratio in Year |
2.70 |
2.68 |
3.30 |
Source: Lima Stock Exchange Market (BVL)
According to the annual report, in the financial area, the Company's principal liabilities comprise loans and borrowings, trade payables and other payables. The main purpose of these financial liabilities is to finance their daily operations. The Company has cash and short-term deposits and trade and other receivables that arise directly from its operations. At the end of 2013, the long-term debt represented 70% of the total financial debt, compared to the 55% at the end of 2012.
According to the UNACEM, in 2013 they continued with their policy of reducing exposure to foreign exchange risk and increase in interest rates. In Table 4, we can see their financial obligations from 2011 to 2013, both obligations (Foreign Loans and Corporate Bonds) are in long-term and also considerate the type of financing for their operations:
Table 4: UNACEM's Financial Obligations from 2011 to 2013
Financial Obligations |
2011 |
2012 |
2013 |
|
Foreign Loans5 |
Bank of Nova Scotia (1) |
- |
S/. 122,235 |
S/. 110,675 |
Banco Continental (1) |
S/. 107,880 |
S/. 95,663 |
S/. 76,890 |
|
Banco Continental (2) |
S/. 130,725 |
S/. 93,375 |
S/. 18,675 |
|
Bank of Nova Scotia (2) |
S/. 121,365 |
S/. 84,183 |
S/. 58,716 |
|
Banco Continental (3) |
S/. 84,750 |
S/. 77,097 |
S/. 59,325 |
|
Banco de Crédito del Perú (1) |
S/. 24,273 |
S/. 22,959 |
S/. 25,164 |
|
Banco de Crédito del Perú (2) |
S/. 26,970 |
S/. 20,963 |
S/. 17,695 |
|
Bank of Nova Scotia (3) |
- |
- |
S/. 133,858 |
|
Interbank |
- |
- |
S/. 168,421 |
|
Corporate Bonds |
First to eighth issue program |
S/. 440,000 |
S/. 385,000 |
S/. 270,000 |
First to the third issue of the second program |
- |
- |
S/. 180,000 |
|
First and Third issuance program |
S/. 94,395 |
S/. 89,285 |
S/. 70,459 |
|
Total |
S/. 1,030,358 |
S/. 990,760 |
S/. 1,189,878 |
|
Source: UNACEM Annual Memory 2013 & 2012
In the case of cost of Debt, first we will need to estimate how its bond rating (which the interest rate depends on) changes as it takes on more debt. To calculate that we first calculate the Interest Coverage Ratio:
Equation 3: Interest Coverage Ratio
![]()
By: CFA Institute (2011)
As we can see on Table 5, the interest coverage ratio range to determinate the default spread of the company:
Table 5: Interest Coverage Ratio's Default Spread of 2013
If interest coverage ratio is |
|||
> |
≤ to |
Rating is |
Spread is |
-100000 |
0.199999 |
D2/D |
12 |
0.2 |
0.649999 |
C2/C |
10.50% |
0.65 |
0.799999 |
Ca2/CC |
9.50% |
0.8 |
1.249999 |
Caa/CCC |
8.75% |
1.25 |
1.499999 |
B3/B- |
7.25% |
1.5 |
1.749999 |
B2/B |
6.50% |
1.75 |
1.999999 |
B1/B+ |
5.50% |
2 |
2.2499999 |
Ba2/BB |
4.00% |
2.25 |
2.49999 |
Ba1/BB+ |
3.00% |
2.5 |
2.999999 |
Baa2/BBB |
2.00% |
3 |
4.249999 |
A3/A- |
1.30% |
4.25 |
5.499999 |
A2/A |
1.00% |
5.5 |
6.499999 |
A1/A+ |
0.85% |
6.5 |
8.499999 |
Aa2/AA |
0.70% |
8.5 |
100000 |
Aaa/AAA |
0.40% |
Source: Damoradan Web Page (2013)
According to Binsbergen, Graham & Yang (2010), the cost of debt are integrated by the risk free rate, the spread of the results of interest coverage and percentage of the country risk. To calculate the Cost of Debt, this is the sample formula:
Equation 4: Cost of Debt Formula
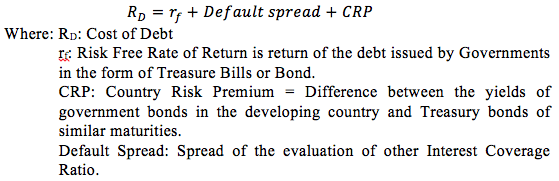
By: CFA Institute (2011)
As we can see in table 6, we can find the country premium risk, with that information; we can establish the cost of debt. The country premium risk is the spread for the shareholders to invest in Peru.
Table 6: Country Risk (EMBI+) From 2011 to 2013
Period per Average |
Spread - EMBIG (pbs) |
Spread - EMBIG Peru (pbs) |
2011 |
3.41% |
1.91% |
2012 |
3.42% |
1.57% |
2013 |
3.18% |
1.59% |
Source: Banco Central de Reserva del Peru (2011-2013)
According to CFA Institute (2011): " The weighted average cost of capital is the marginal cost of raising additional capital and is affected by the cost of capital and the proportion of each source of capital". The WACC formula can be written as:
Equation 5: WACC formula without Taxes
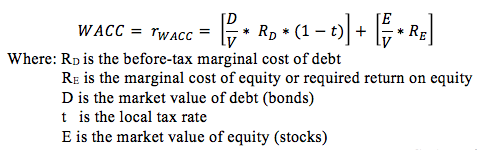
By: CFA Institute (2011)
According to the CFA Institute (2012): "the WACC is the discounted rate of the firm and is also referred to as the marginal cost of capital". In many countries, the interest paid on corporate debt is tax deductible, because we are interested in the after-tax cost of capital; we adjust the cost of debt (Rd) for the firm's marginal tax rate (t).
The WACC, as we have described before, is the cost of financing firm assets. With this rate, we can view this cost as an opportunity cost. Also, we had to consider how a company could reduce its cost if it found a way to produce its output using fewer assets, like less working capital. In case the company needs less working capital, we can use the fund freed up to buy back of the debt and equity securities in a mix that just matches our target capital structure (CFA Institue, 2012).
Another main topic to add is the weights in the calculation of WACC, which should be based on the firm's target capital structure, the proportions (based on the market values) of debt, preferred stock, and equity that the firm expect to achieve over time. Finally, the main goal of calculating the WACC is to use an appropriate discount rate for projects that have approximately the same level of risk as the firm's existing projects. This is because the component cost of capital used to calculate the firm's WACC are based on the existing level of firm risk (CFA Institue, 2012). An additional issue to consider when using a firm's WACC to evaluate a specific project or to estimate the future value of the company with a fundamental analysis, is that there is an implicit assumption that the capital structure of the firm will remain at the target capital structure over the life of the project and in an estimated case with a fundament analysis that the company has no end of life (Brealey, Myers, & Allen, 2010).
As we inform before, UNACEM is valued on Lima Stock Exchange Market (BVL), for that reason, the valuation of the company, has to be on market value. For that reason, their financing and their funding has to be according on their shares valued in BVL and their financing in Long-Term has to consider their interest coverage and their raking with the default spread.
According to the information on the Exhibits 1, 2, 3 and 4, on their estimate of their cash flows and their weight average cost of capital (WACC), the discount rate to obtain their market value of the company had to be used. To obtain the WACC, in this research paper, we estimate the cost of capital (Ke) and the cost of debt (Kd) with the variables of: risk free rate, the unleveraged beta, the default spread of the interest coverage and the effects on the relative volatile of stocks.6
With this, the following is hoped to be resolved:
To resolve this case, we need information of the web pages of Damodaran, the Annual report of the company, the financial information of SMV, [10] and the historical prices of UNACEM and Lima Stock Exchange General Index to estimate the cost of capital and the cost of debt of the company.
Tables 7 and 8 below show the alternatives to compare:
Table 7: UNACEM's Weight Average Cost of Capital
UNACEM S.A.A. |
Period |
Debt to Equity Ratio |
% |
Cost of Capital |
% |
Cost of Debt Before Taxes |
% |
Local Tax Rate |
% |
WACC Per year |
% |
-----
Table 8: Discounted Cash Flow of UNACEM
Discounted Cash Flow |
Value (In thousands) |
Present Value of Free Cash Flow Projected |
S/. |
Present Value of Free Cash Flow in Perpetuity |
S/. |
Financial Debt |
S/. |
Actual Box |
S/. |
Value of Shares (Market Capitalization) |
S/. |
In this research paper, we focus on the investigation of the cement company Union Andina de Cementos S.A.A. (UNACEM); which was the binding of Cementos Lima and Cementos Andinos. Also, it is the most important cement manufacturer, with a market share of 54%, and it is controlled by the matrix Nuevas Inversiones SA. Additionally, UNACEM is valued in the Lima Stock Exchange Market (BVL) with more than 20 years. [11] Nowadays; UNACEM has 1.65 millions of shares in the local stock market, this funding on their equity permits to have a market valuation. To have a market value of the company, it is necessary to obtain their cost of capital or equity and their cost of debt according with their weights of funding and financing.
In the macroeconomic environment, it was estimated that global growth will total 2.9%, a figure achieved in an adverse and, above all, volatile environment, where emerging countries were the major contributors to growth. Actually, the national construction sector has a growth among regions: the south and east were the most dynamic zones, achieving growth of approximately 14.0% and 16.0%, respectively, while central Peru grew by around 7.4%.
Their financial objective in managing capital is to safeguard its ability to continue a Company in order to generate returns for shareholders, benefits for other groups of interest, and maintain optimal capital structure to reduce the cost of capital.
In the actual case of the company in 2013, it has an increase of their sales amounting to 4.7%, result of the increased construction activity driven by an increase in public and private investment. On the other hand, the cost of local sales increased by 2.8% due to higher volume of cement ships, and the higher purchased cost of imported clinker.
As a result of higher revenue, control costs and expenses, gross profit was maintained in relation to the last period and operating income had increase 7.3% higher than in 2012.
Exhibits of the Case
Exhibit 1: Audited Financial Statements Balance Sheet until 2013
Audited Financial Statement Balance Sheet [12] |
|||
UNION ANDINA DE CEMENTOS S.A.A. - UNACEM S.A.A. |
|||
2011 |
2012 |
2013 |
|
ASSETS |
|
|
|
Current Assets |
|
|
|
Cash & Cash Effective |
S/. 63,473 |
S/. 181,209 |
S/. 322,348 |
Others Financial Assets |
S/. 170 |
S/. - |
S/. - |
Accounts Receivable |
S/. 141,606 |
S/. 313,586 |
S/. 437,151 |
Inventory |
S/. 353,114 |
S/. 485,785 |
S/. 559,244 |
Others No-Financial Assets |
S/. 35,578 |
S/. 20,482 |
S/. 26,295 |
Total Current Assets |
S/. 593,941 |
S/. 1,001,095 |
S/. 1,345,038 |
|
|
|
|
Non-Current Assets |
|
|
|
Others Financial Assets in Long Term |
S/. 1,503,326 |
S/. 15,226 |
S/. 12,951 |
Accounts Receivable in Long Term |
S/. 11,700 |
S/. 49,616 |
S/. 30,965 |
Machinery & Equipment (Net) |
|
S/. 5,938,062 |
S/. 6,131,641 |
Intangible assets other than goodwill |
S/. 3,346,367 |
S/. 107,625 |
S/. 100,790 |
Deferred tax assets |
S/. 63,164 |
S/. 76,468 |
S/. 127,811 |
Appreciation |
S/. 9,745 |
S/. 114,745 |
S/. 114,745 |
Others No-Financial Assets |
S/. 104,476 |
S/. 133,200 |
S/. 175,923 |
Total Non-Current Liabilities |
S/. 5,038,778 |
S/. 6,434,942 |
S/. 6,694,826 |
TOTAL ASSETS |
S/. 5,632,719 |
S/. 7,436,037 |
S/. 8,039,864 |
|
|
|
|
LIABILITY & EQUITY |
|
|
|
Current Liabilities |
|
|
|
Others Financial Liabilities |
S/. 537,070 |
S/. 1,003,879 |
S/. 892,908 |
Trade Payables and Other Payables |
S/. 283,403 |
S/. 487,462 |
S/. 458,764 |
Other Provisions |
S/. 37,321 |
S/. 36,723 |
S/. 24,766 |
Liabilities for Income Tax |
S/. 14,499 |
S/. 3,487 |
S/. 661 |
Total Current Liabilities |
S/. 872,293 |
S/. 1,531,551 |
S/. 1,377,099 |
Non-Current Liabilities |
|
|
|
Other Financial Liabilities |
S/. 1,228,313 |
S/. 1,815,198 |
S/. 2,339,277 |
Trade payables and other payables |
|
|
S/. 23,016 |
Other Provisions |
S/. 10,590 |
S/. 11,062 |
S/. 13,663 |
Deferred tax Liabilities |
S/. 488,646 |
S/. 566,460 |
S/. 598,295 |
Other Non-Financial Liabilities |
S/. 9,328 |
S/. 67,668 |
S/. 52,307 |
Total Non-Current Liabilities |
S/. 1,736,877 |
S/. 2,460,388 |
S/. 3,026,558 |
Total Liabilities |
S/. 2,609,170 |
S/. 3,991,939 |
S/. 4,403,657 |
|
|
|
|
Equity |
|
|
|
Capital Stock |
S/. 1,499,023 |
S/. 1,646,503 |
S/. 1,646,503 |
Other Capital Reserves |
S/. 213,749 |
S/. 249,871 |
S/. 270,303 |
Retained Earnings |
S/. 1,317,306 |
S/. 1,529,497 |
S/. 1,606,202 |
Other Equity Reserves |
S/. -6,529 |
S/. -165,183 |
S/. -74,868 |
Non-Controlling |
|
S/. 183,410 |
S/. 188,067 |
Total Equity |
S/. 3,023,549 |
S/. 3,444,098 |
S/. 3,636,207 |
TOTAL LIABILITY & EQUITY |
S/. 5,632,719 |
S/. 7,436,037 |
S/. 8,039,864 |
Exhibit 2: Audited Financial Statements Income Statements until 2013
Income Statement |
2011 |
2012 |
2013 [13] |
Revenue |
S/. 1,513,521 |
S/. 1,725,896 |
S/. 1,785,163 |
Cost of Sales |
S/. -851,849 |
S/. -988,604 |
S/. -1,021,726 |
Gross Profit |
S/. 661,672 |
S/. 737,292 |
S/. 763,437 |
Sales and Distribution Expenses |
S/. -79,950 |
S/. -82,517 |
S/. -89,889 |
Administrative Expenses |
S/. -160,334 |
S/. -171,125 |
S/. -152,425 |
Other Operating Income |
S/. 55,753 |
S/. 26,269 |
S/. 30,016 |
Other Operating Expenses |
S/. -20,398 |
S/. -19,639 |
S/. -31,093 |
Operative Income |
S/. 456,743 |
S/. 490,280 |
S/. 520,046 |
Interest Income |
S/. 10,212 |
S/. 16,956 |
S/. 10,488 |
Financial Expenses |
S/. -64,838 |
S/. -67,125 |
S/. -90,835 |
Net-Change Differences |
S/. 34,770 |
S/. 75,973 |
S/. -138,260 |
Earnings Before Income Taxes |
S/. 436,887 |
S/. 516,084 |
S/. 301,439 |
Expenses Income Taxes |
S/. -128,506 |
S/. -156,290 |
S/. -96,697 |
Net Income |
S/. 308,381 |
S/. 359,794 |
S/. 204,742 |
Earnings (loss) per share: |
|
|
|
Basic per common share from continuing operations |
S/. 0.187 |
S/. 0.219 |
S/. 0.124 |
Earnings (loss) per common share |
S/. 0.187 |
S/. 0.219 |
S/. 0.124 |
Source: Annual Memorial Report 2013
----
Exhibit 3: Audited Financial Statements Cash Flow Statement until 2013
Cash Flow Statement |
2011 |
2012 |
2013 |
Cash flows from operating activities |
|||
Classes of cash receipts from operating activities |
|||
Sale of Goods and Service |
S/. 1,820,184 |
S/. 2,031,861 |
S/. 2,114,729 |
Other cash receipts relating to operating activity |
S/. 51,056 |
S/. 16,950 |
S/. - |
Classes of cash payments for operating activities |
|||
Suppliers of Goods and Services |
S/. -1,018,297 |
S/. -1,396,475 |
S/. -1,472,938 |
Contracts held for purposes of dealing or trading |
S/. -145,544 |
S/. -159,032 |
S/. -141,329 |
Payments to and on behalf of employees |
S/. -149,624 |
S/. -153,950 |
S/. -92,401 |
Other Cash Payments Related to the Operation Activity |
S/. -34,462 |
S/. - |
S/. -17,815 |
Net cash and cash equivalents provided by (used in) operations |
S/. 523,313 |
S/. 339,354 |
S/. 390,246 |
Interest expense (not included in the activity of financing) |
S/. -73,810 |
S/. -70,195 |
S/. -85,047 |
Cash and Cash Equivalent Cash From (Used in) Operating Activities |
S/. 449,503 |
S/. 269,159 |
S/. 305,199 |
Cash flow from investment activity |
|||
Classes of cash receipts from investing activities |
|||
Sale of Property, Plant and Equipment |
S/. 2,159 |
S/. 6,091 |
S/. - |
Dividends Received |
S/. 6,989 |
S/. 1,371 |
S/. 2,850 |
Classes of cash from investing activities |
|||
Purchase of Subsidiaries, Net of Cash Acquired |
S/. -79,188 |
S/. -48,944 |
S/. -89,527 |
Purchase of Interests in Joint Ventures, Net of Cash Acquired |
S/. - |
S/. - |
S/. - |
Purchase of Property, Plant and Equipment |
S/. -256,322 |
S/. -272,543 |
S/. -259,799 |
Purchase of Intangible Assets |
S/. -11,456 |
S/. -17,320 |
S/. -6,817 |
Other collections (payments) of cash related to investment activity |
S/. -79,018 |
S/. - |
S/. - |
|
|
|
|
Cash and Cash Equivalent Cash From (Used in) Investment Activities |
S/. -416,836 |
S/. -331,345 |
S/. -353,293 |
Cash flows from financing activities |
|||
Classes of cash receipts from financing activities: |
|||
Borrow |
S/. 219,803 |
S/. 561,843 |
S/. 1,397,959 |
Classes of Cash From Financing Activities: |
|||
Loan Amortization and payment |
S/. -402,439 |
S/. -403,169 |
S/. -1,143,333 |
Paid of Dividends |
S/. -82,348 |
S/. -85,772 |
S/. -83,971 |
Other collections (payments) of cash related to financing activities |
S/. -7,851 |
S/. - |
S/. - |
Cash and Cash Equivalent Cash From (Used in) Financing Activities |
S/. -272,835 |
S/. 72,902 |
S/. 170,655 |
Increase (Decrease) in Net Cash and Cash Equivalent before Changes in Foreign Exchange Rates |
S/. -240,168 |
S/. 10,716 |
S/. 122,561 |
Effects of Changes in Foreign Exchange Rates on Cash and Cash Equivalents |
S/. 34,770 |
S/. - |
S/. - |
Increase (Decrease) in Net Cash and Cash Equivalent |
S/. -205,398 |
S/. 10,716 |
S/. 122,561 |
Cash and Cash Equivalent Initial |
S/. 268,871 |
S/. 63,473 |
S/. 74,189 |
Cash and Cash Equivalent at the End of the Year |
S/. 63,473 |
S/. 74,189 |
S/. 196,750 |
Source: Annual Memorial Report 2013
----
Exhibit 4: Historical NOPAT Estimate from 2011 to 2013
|
2011 |
2012 |
2013 |
Operative Incomes |
|
|
|
Revenue |
S/. 1,513,521 |
S/. 1,725,896 |
S/. 1,785,163 |
Other Operating Income |
S/. 55,753 |
S/. 26,269 |
S/. 30,016 |
Total Operative Income |
S/. 1,569,274 |
S/. 1,752,165 |
S/. 1,815,179 |
Cost of Goods |
S/. -851,849 |
S/. -988,604 |
S/. -1,021,726 |
Others Operating Expenses |
S/. -20,398 |
S/. -19,639 |
S/. -31,093 |
Total of Operating Expenses |
S/. -872,247 |
S/. -1,008,243 |
S/. -1,052,819 |
Gross Profit |
S/. 697,027 |
S/. 743,922 |
S/. 762,360 |
Operational Expenses |
|||
Sales and Distribution Expenses |
S/. -79,950 |
S/. -82,517 |
S/. -89,889 |
Administrative Expenses |
S/. -160,334 |
S/. -171,125 |
S/. -152,425 |
Earnings Before Interest And Taxes |
S/. 456,743 |
S/. 490,280 |
S/. 520,046 |
Taxes |
S/. -149,293 |
S/. -177,810 |
S/. -125,819 |
NOPAT [14] |
S/. 307,450 |
S/. 312,470 |
S/. 394,227 |
Source: Annual Memorial Report 2013
-----
Exhibit 5: Country Risk (EMBI+) From 2011 to 2013
Period |
Spread - EMBIG (pbs) |
Spread - EMBIG Peru (pbs) |
Jan-11 |
283 |
146 |
Feb-11 |
286 |
146 |
Mar-11 |
297 |
157 |
Apr-11 |
296 |
193 |
May-11 |
305 |
187 |
Jun-11 |
314 |
192 |
Jul-11 |
303 |
171 |
Aug-11 |
356 |
200 |
Sep-11 |
408 |
237 |
Oct-11 |
424 |
233 |
Nov-11 |
410 |
214 |
Dec-11 |
415 |
216 |
Average 2011 |
3.41% |
1.91% |
Jan-12 |
421 |
219 |
Feb-12 |
379 |
199 |
Mar-12 |
337 |
166 |
Apr-12 |
354 |
164 |
May-12 |
382 |
181 |
Jun-12 |
395 |
188 |
Jul-12 |
360 |
163 |
Aug-12 |
320 |
133 |
Sep-12 |
299 |
124 |
Oct-12 |
288 |
108 |
Nov-12 |
295 |
123 |
Dec-12 |
273 |
117 |
Average 2012 |
3.42% |
1.57% |
Jan-13 |
260 |
110 |
Feb-13 |
278 |
127 |
Mar-13 |
291 |
140 |
Apr-13 |
294 |
133 |
May-13 |
285 |
133 |
Jun-13 |
345 |
180 |
Jul-13 |
338 |
175 |
Aug-13 |
351 |
191 |
Sep-13 |
350 |
182 |
Oct-13 |
338 |
173 |
Nov-13 |
348 |
182 |
Dec-13 |
340 |
177 |
Average 2013 |
3.18% |
1.59% |
Source: Damodaran Web Page (2013)
-----
Exhibit 6: Calculation of Value Drivers to Estimate the projected Free Cash Flow
Drivers |
2011 |
2012 |
2013 |
Average |
Cost of Goods/Net Sales |
56.28% |
57.28% |
57.23% |
56.93% |
Other Costs Op. / Other Income Op |
36.59% |
74.76% |
103.59% |
71.65% |
Total Operating Expense / Total Gross Revenue |
55.58% |
57.54% |
58.00% |
57.04% |
Expense Sales / Total Gross Revenue |
-5.09% |
-4.71% |
-4.95% |
-4.92% |
Administrative Expenses / Total Gross Revenue |
-10.22% |
-9.77% |
-8.40% |
-9.46% |
Investment Year / Total Gross Revenue |
-27.15% |
-19.34% |
-19.62% |
-22.03% |
Depreciation / Investing Year |
-257.30% |
-119.33% |
-128.15% |
-168.26% |
Working Capital / Total Gross Revenue |
4.27% |
4.07% |
9.71% |
6.02% |
-----
Exhibit7: Book Value of UNACEM SAA from 2011 to 2013
UNACEM S.A.A. |
2011 |
2012 |
2013 |
Others Financial Liabilities |
S/. 537,070 |
S/. 1,003,879 |
S/. 892,908 |
Trade Payables and Other Payables |
S/. 283,403 |
S/. 487,462 |
S/. 458,764 |
Other Financial Liabilities in Long-Term |
S/. 1,228,313 |
S/. 1,815,198 |
S/. 2,339,277 |
Trade payables and other payables in Long-Term |
S/. - |
S/. - |
S/. 23,016 |
Other Non-Financial Liabilities in Long-Term |
S/. 9,328 |
S/. 67,668 |
S/. 52,307 |
Liabilities Interest |
S/. 2,058,114 |
S/. 3,374,207 |
S/. 3,766,272 |
Equity |
S/. 3,023,549 |
S/. 3,444,098 |
S/. 3,636,207 |
Total Book Value of UNACEM S.A.A. |
S/. 5,081,663 |
S/. 6,818,305 |
S/. 7,402,479 |
4. We are grateful to Rafael Adrian Perez Guevara for his assistance in this research paper.
5. This Annual Report of UNACEM 2013 was downloaded from the website of the Superintendence of Market Values (SMV).
6. As we said before, UNACEM is the fusion of Cementos Lima SA and Cementos Andino SA, for that reason, they have four products on their portfolio. The original brands of Cementos Lima are: Cementos Sol, Apu Cement and Atlas Cement.
7. See the Annual Report of UNACEM and their Financial Statement Audited that was downloaded from the website of SMV, 2014.
8. The different type of Foreign Loan with the same bank or financial institution is because of the different type of term and maturity of the loans that UNACEM requires to finance their operations.
9. As we mentioned before, the relative volatile of stocks are according to the BVL general index (IGBVL) and the Standards & Poor's 500 index (S&P500).
10. See, for instance, the webSite: www.smv.gob.pe, Superintendencia de Mercado de Valores (SMV)
11. Previously, this valuation stared with Cementos Lima and Cementos Andinos, but in 2012 these two companies merged, and they are on Lima Stock Exchange Market with the name of their shares as UNACEM1.
12. See the financial information of SMV (Superintendencia de Mercado de Valores)
13. See the financial information of SMV (Superintendencia de Mercado de Valores)
14. The NOPAT was calculated from the Financial Statements of UNACEM with a different tax rate per year, according to the Annual Report.