1. Introduction
Multinational enterprises (MNEs) constitute one of the major participants of the current globalization trends with their increasing participation in the world economy and though the generation of a variety of both positive and negative effects due to its global strategies and scope of operations. The purpose of this work is explore one of these global practices, specifically, that of cross-border profit shifting within member firms of the multinational group in order to take advantage of corporate tax rate differentials, ultimately affecting the involved countries’ tax revenues and economic potential.
The quantitative section explores the issue within the context of Poland as an emerging economy; firstly, an economic overview is developed for the purpose of covering the main macroeconomic indicators related to the topic, followed by inquiring into the existence of profit shifting executed via strategic transfer pricing practices or via capital structure design under the multinational’s global strategic considerations.
The issue under analysis is potentially relevant not only for the Polish economy and its partners but also to every open economy and particularly to those of emerging countries.
2. Multinationals and profit shifting issues
The literature is abundant in relation to the worldwide expansion of trade over the last century, with such evolution resulting from different factors, mainly: increases in population and output, trade and investment liberalization policies, diminishing trade costs and increasing activities of multinational firms. As previously mentioned, this work focusses on multinationals’ activities and their growing influence, mainly obtained due to their ability to exploit economies of scale and transfer knowledge efficiently.
Multinational activities can have positive results in the economy as it tends to increase productivity due to technological and managerial transfers (Dunn and Mutti, 2004), whereas on the other hand MNEs can also have a negative impact, especially regarding potential differences in their strategic behavior when compared to independent entities acting under market conditions. Essentially this is possible since the multinational is not constrained by market forces when setting internal terms, including transfer prices (Kant, 1988).
Taxation exerts an important influence in the multinationals' strategies, particularly when taking into account that differences in tax rates across countries not only generate shifts of economic activities but also incentivizes shifts of pure accounting income among MNE entities across countries (i.e. profit shifting). This is especially visible under international tax rate competition, in other words, countries’ offering of progressively lower corporate tax rates to attract multinational businesses to their territory (Bartelsman and Beetsma, 2003).
Empirical evidence suggests that to some extent multinationals ultimately relocate taxable profits towards the group's entities with comparatively lower corporate income tax rates lowering the overall group's tax rate (Huizinga and Laeven, 2008; Dischinger, 2007; Grubert and Mutti, 1991; Gerard Gillard, 2004), thus reducing the group's total tax expense and simultaneously affecting the involved governments’ tax revenues. Usually, less developed economies tend to be negatively affected, possibly because of having more difficulties in applying tax regulations (Fuest, Hebousb and Riedel, 2011).
Profit shifting practices may include intra-group transfer pricing manipulations, as well as undertaking capital structure decisions purely under the scope of global tax-minimizing strategies, both variants are explored as follows.
2.1. Transfer pricing and profit shifting
Global multinationals can take advantage of tax differences among countries by executing some degree of profit shifting by underpricing or overpricing any type of intra-group transactions (Weichenrieder, 1996; Bartelsman and Beetsma, 2003; Satapathy, 2001; MehaFDI, 2000), as in effect, the global profit of the group is determined to some extent by its “internal pricing policies” (Petty and Walker, 1972) (i.e. internal transfer prices). As a consequence, it can be said that unfair transfer pricing practices can enhance private gain while contributing to decrease welfare in a society due to relatively frequent tax avoidance in the area (Sikka and Willmott, 2010). It is of course also an ethical issue (MehaFDI, 2000) especially in the case of comparatively weaker economies.
2.2. Capital structure design and profit shifting
Multinationals’ profit shifting practices can also include a subsidiary’s capital structure decisions taken under a global tax-minimizing perspective rather than under standalone considerations. This is due to the fact that the MNE will aim to use the tax deductibility of interests as much as possible in order to improve its results at the consolidated level rather than at subsidiary’s level (Buettner and Wamser, 2007; Newberry and Dhaliwal, 2001; Panteghini 2009; Barion, Maniaci, Panteghini and Parisi, 2010).
An abnormally high use of intra-group debt in detriment to the use of equity contributions towards certain group’s entities is referred to as "thin capitalization". In fact, it is not uncommon that entities in high-tax countries are financed through debt rather than with equity, either via loans from the parent company or from other group members (Bartelsman and Beetsma, 2003). There is also empirical evidence showing that the subsidiary’s debt-to-asset ratio tends to increase as the tax rate of the subsidiary increases (Chowdhry and Coval, 1998), as well as, on the effects of the local tax rate on the affiliate’s leverage and its choice of capital structure (Buettner, Overesch, Schreiber and Wamser, 2009 and 2006; Graham, 2003).
Profit-shifting practices within the MNE are based on the notion that whereas unconstrained or independent profit-oriented entities would aim to maximize their standalone profitability; entities existing within the boundaries of the group, can be at best constrained with respect to their financing decisions as these tend to be taken at Headquarters’ level.
3. Overview of the polish economy
The 1999-2010 period is selected as it allows to review two separate five-year periods, the first one before the accession of Poland to the European Union (which took place in May 2004), and the second one corresponding to the five-year post accession period. Additionally, the selected period aims to exclude the distorting effects of the high volatility resulting from the political transition taking place in Poland during the early 1990s. The economic overview considers the main macroeconomic variables during the period as well as the evolution of the Polish public finances.
3.1. Economic growth in Poland
In terms of GDP, Poland is the 7th biggest economy in the European Union (EU), and the 20th in the world (2010 GDP, current prices, IMF data). An important proportion of such growth has been achieved within the last decade. In fact, Poland has presented higher annual growth rates not only than the EU but also than the average of the world economy, as shown in Figure 1.
Figure 1. Evolution of polish, e.u. and world economies -GDP growth (1999-2010).
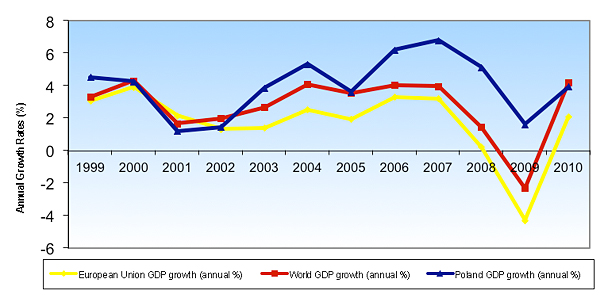
Source: World Bank ((http://databank.worldbank.org/ddp/home.do).
In comparison to other Central and Eastern European (CEE) countries within the EU (Bulgaria, Hungary, Czech Republic, Romania and Slovakia), Poland shows higher growth rates for the period 2005-2010, being the only country in the region to maintain growth during the world economic downturn as seen in Figure 2.
Figure 2. GDP growth for Poland and cee countries (1999-2010).
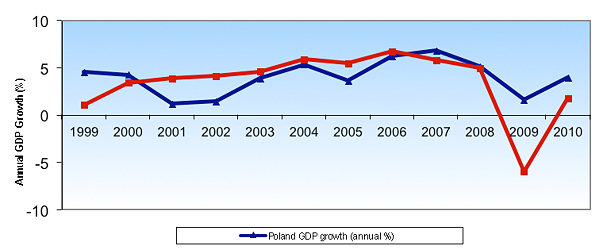
Source: World Bank ((http://databank.worldbank.org/ddp/home.do).
3.2. International trade flows in Poland
In terms of its international position, trade as a percentage of its GDP shows similar levels to those of the EU average, although lower in comparison with other EU CEE countries, indicating a relatively lower exposure of the Polish economy to external shocks when compared to other CEE countries within the EU (Bulgaria, Hungary, Czech Republic, Romania and Slovakia), as seen in Figure 3.
Figure 3. Comparative evolution of trade flows (as % of gdp) (1999-2010).
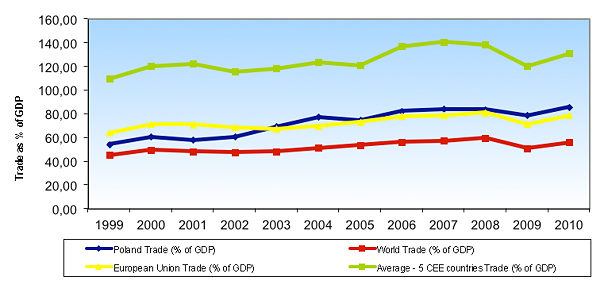
Source: World Bank ((http://databank.worldbank.org/ddp/home.do).
Nevertheless, the Polish merchandise and services import and export flows have been increasing steadily over time, particularly the trade of merchandises as indicated in Figure 4.
Figure 4. Polish imports and exports (current mm us$) (1999-2010).
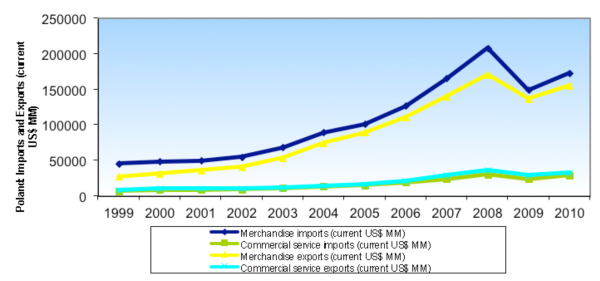
Source: World Bank ((http://databank.worldbank.org/ddp/home.do).
3.3. Foreign direct investment into Poland (1999-2010)
During the recent economic crisis, Poland has been in a privileged position with respect to FDI inflows, surpassing other countries within the emerging CEE region (Bulgaria, Hungary, Czech Republic, Romania and Slovakia), as seen in Figure 5.
Figure 5. FDI inflows towards Poland and cee countries (1999-2010).
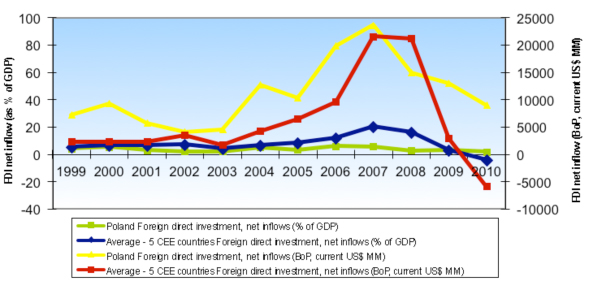
Source: World Bank (http://databank.worldbank.org/ddp/home.do).
Regarding foreign investments already located in Poland, as of the year 2010 the accumulated FDI value (calculated as book value of the investments) amounted to EUR 150 441 MM, with most of the such investments coming from OECD countries (95%), while 86% from investors in other EU countries. As of 2010, the six main holders of FDI stocks in Poland are the Netherlands, Germany, France, Luxemburg, Italy and the United States, accounting for over 65% of the total according to PAIZ data as shown in Figure 6.
Figure 6. Share of FDI stock holders in Poland as of 2010.
Source: PAIZ (http://www.paiz.gov.pl/Poland_in_figures/foreign_direct_investment).
In terms of the participation of multinationals in the Polish economy, a steady increase can be observed over the last few years; both with respect to turnover and number of enterprises within the manufacturing sector (see Fig. 7.)
Figure 7. Multinational participation in the polish manufacturing sector (1999-2007).
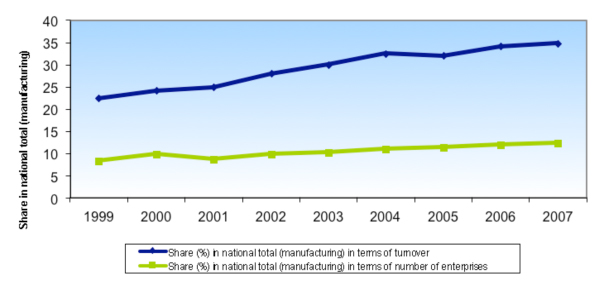
Source: OECD Statistics (http://stats.oecd.org/Index.aspx).
3.4. Local credit markets
The World Bank's Doing Business Report for the year 2011puts Poland in the 8th position for the Getting Credit item (while in 2007 it was in the 65th position in the same item). The interest rates in the Polish markets have shown a reduction over the years, as a result of an increase in the availability of credit (see Fig. 8).
Figure 8. Polish interest rates (1999-2010).
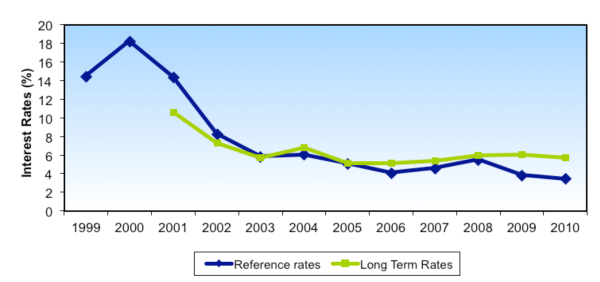
Source: Polish Central Bank (http://nbp.pl/home.aspx?f=/dzienne/stopy_archiwum.htm) and OECD Statistics
(http://stats.oecd.org/Index.aspx).
3.5. Corporate taxation and public finances
Corporate taxation in particular constitutes one of the parameters to the overall competitiveness analysis. In spite of being only one among many considerations, it is widely seen by the public and policy makers as one of the most important ones. The direct consequence is that governments actively undertake reductions of the corporate tax rates as a measure to attract foreign investments.
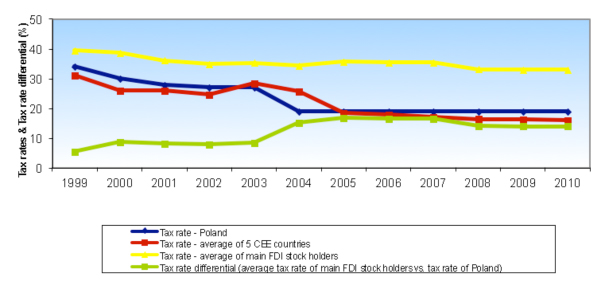
Furthermore, probably resulting to some extent from the relative ease of gathering corporate tax rates' information across potential investments opportunities in different countries; governments engage in what could be referred to as international tax competition, whereby corporate tax rates are lowered in successive policy decisions across competing countries, it is thus, reminiscent of interactions towards a Nash equilibrium (i.e. lowered rates), as shown in Figure 9.
Figure 9. Evolution of corporate tax rates for Poland, cee and main FDI stock holders in Poland.
Source: World Bank (http://databank.worldbank.org/ddp/home.do), Trading Economics
(http://tradingeconomics.com/), Damodaran Online (http://pages.stern.nyu.edu/~adamodar/) and own calculations.
It can be observed that over the years the corporate tax rates are being diminished both for Poland and other CEE countries (Bulgaria, Hungary, the Czech Republic, Romania and Slovakia), as well as, for larger economies which constitute the main FDI stock holders in Poland. Conversely, it can also be seen that the tax rate differential between the averaged corporate tax rate of the main FDI stock holders in Poland and the Polish corporate tax rate increases over time 2 (see Fig. 9.)
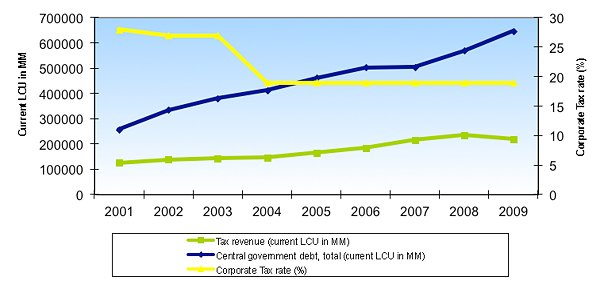
The inflow of FDI into the Polish economy can be explained at least partially by the comparatively lower corporate tax rates in relation to its investors' economies. Evidently, the resulting increased economic activity does account for increased government tax revenues, although it simultaneously diminishes the overall collection of potential tax revenues due to the tax rate reductions. The full magnitude of such trade-off is a topic of detailed analysis; however, within the Polish government finances it can be observed that the levels of government debt are increasing at a faster rate than the government tax revenues in the presence of an on-going reduction of the corporate tax rates as shown in Figure 10.
Figure 10. Evolution of government finances in Poland (1999-2010).
Source: World Bank (http://databank.worldbank.org/ddp/home.do), Trading Economics (http://tradingeconomics.com/)
and Damodaran Online (http://pages.stern.nyu.edu/~adamodar/).
As previously mentioned, in addition to the real economic activity shifts; from the MNE's point of view, the existence of corporate tax rate differentials across the countries it operates, might generate incentives for the application of global strategies towards executing artificial profit or income shifting (i.e. pure accounting shifting). It is thus clear that within the context of worldwide expanding trade and increasing FDI and multinationals' activities it is relevant to evaluate the potential profit shifting practices across countries.
4. Study on potential profit shifting
The following part describes the initial hypotheses, data collection procedure, testing design, quantitative results and analysis related to the study on potential profit shifting practices by entities controlled by multinationals in the Polish economy.
4.1. Initial hypotheses
For the reviewed period, there is evidence of profit or income shifting behavior among firms which are controlled by MNEs in comparison with firms which are under local control. Specifically, profit shifting occurs in the following ways:
- There is evidence of profit shifting via transfer pricing among companies under multinational control. Such a practice is evaluated through comparative operating profitability analysis of MNE-controlled firms versus locally-controlled firms.
- There is evidence of profit shifting via capital structure manipulation among companies under multinational control. Such a practice is evaluated through comparative capital structure analysis of MNE-controlled firms versus locally-controlled firms.
4.2. Data collection
The data collection procedure is based on the gathering of two main samples, namely, Sample 1, composed by MNE-controlled firms, referred to as "foreign ownership" and, Sample 2, composed by locally-controlled firms, referred to as "local private ownership". The database employed at this stage was Hoppenstedt Bonnier Polska.
The following search parameters were employed. For the foreign ownership dataset:companies listed as having more than 50% of foreign capital participation and larger than 1000 employees. For the private ownership dataset: companies listed as having local private ownership while not listed as having more than 50% of foreign capital and larger than 1000 employees.
The foreign ownership dataset was preliminarily composed of 155 companies, while the local private ownership dataset was preliminarily composed of 282 companies. In order to increase the reliability of the test, detailed analysis into each company was performed.
For the foreign ownership dataset (i.e. MNE-controlled firms), the final dataset should be composed by companies having more than 50% of foreign control (i.e. multinational control); therefore the shareholder structure was reviewed in order to exclude companies either lacking such information or not complying with such criteria.For the local private ownership dataset (i.e. locally-controlled firms), the final dataset should be composed of companies having less than 50% of foreign control; therefore, the shareholder structure was reviewed in order to exclude companies either lacking such information or not complying with such criteria. Moreover, the dataset should be composed of commercial profit oriented non-financial companies; therefore, companies having majority state control and providing public services such as transportation, energy or heating were excluded.
For both datasets, it was considered that the final set should be composed of commercial non-financial companies, therefore, banks or financial institutions were excluded.Following, the financial information for each of the remaining companies conforming both datasets was gathered from ISI Emerging Markets Corporate Database and Monitor Polski B; nevertheless, as the data for some companies was unavailable, these were also excluded from the sample.
As a result of this process for the foreign ownership dataset, out of the initial 155 companies, the final set is composed of 117, as 38 firms which were preliminarily included were excluded for the above stated reasons. 2. In the case of the local private ownership dataset, out of the initial 282 companies, the final set is composed of 138, as 144 firms which were preliminarily included were also excluded for the above stated reasons.
4.3. Testing design
Financial information for the period 1999-2004 (pre-EU accession) and for the period 2005-2010 (post-EU accession) was gathered for each of the 255 companies from both datasets. The inter-period comparison is performed in order to observe the variation over multi-year periods, thus accounting for the effects of the economic cycles within the selected companies' activities and thus, financial information.
The financial information consisted in: Shareholder's Equity, Long Term Liabilities, Short Term Liabilities, Sales Revenue and, Operating Profit or Loss. The financial information was employed for the calculation of two financial indicators for each of the described samples during two five-year periods; in order to execute the relevant comparisons and subsequent analyses. The indicators are calculated as follows:
For the verification of Hypothesis 1, based on comparative operating profitability analysis, the Operating Margin "OM" indicator was employed, where:
OM = (Operating Profit or Loss 3/ Sales Revenue), thus, the calculated OMs for the multinational-controlled sample is compared to those which are obtained from the locally-controlled sample.
For the verification of Hypothesis 2, based on comparative capital structure analysis, the long term debt-to-equity ratio "D/E" is employed, where:
D/E = (Long term debt 4/ Shareholder's Equity), thus, the calculated D/E ratios for the multinational-controlled sample is compared to those which are obtained from the locally-controlled sample.
4.4. Results
4.4.1. Hypothesis 1 on profit shifting through transfer prices manipulation
It can be observed that during the period 1999-2004, both samples displayed similar profitability levels, whereas the inter-period comparison related to Hypothesis 1 shows increased levels of profitability for both samples (see Fig. 11).
Nevertheless, the 1999-2004 to 2005-2010 profitability increase was larger for the multinational-controlled sample than that of the locally-controlled sample. In fact, for the 2005-2010 period, the multinational-controlled sample's profitability increased by 36.33%, while the locally-controlled sample increased by 13.64% in the relation to the 1999-2004 period 5 as seen in Table 1.
Table 1. Profitability - comparison of five-year periods between MNE and locally controlled companies.
Profitability |
Inter-period Profitability Variation (%) |
Profitability for Period 1999-2004 |
Profitability for Period 2005-2010 |
OM (MNE-controlled) |
+36.33% |
4.34% |
5.92% |
OM (locally-controlled) |
+13.64% |
4.54% |
5.16% |
Source: Own calculations.
----
Figure 11. Profitability - comparison of five-year periods between MNE and locally controlled companies.
Source: Own calculations.
Complementary Tests on Profitability
The following results correspond to complementary tests executed in order to verify the main results related to Hypothesis 1.
Complementary Test 1 - Operating margin comparisons for the period 2007-2010.
The following test is based on comparing the multinational-controlled sample's profitability for the 2007-2010 period with that of the locally-controlled sample's for the same period. Additionally, two more separate samples were prepared, one composed by 466 listed companies across Poland, and other composed by 647 listed companies from other CEE countries for the 2007-2010 period employing data from the Infinancials service.
The gathered results illustrate increased levels of profitability for the multinational-controlled sample during the period 2007-2010, when compared to the locally-controlled samples, as well when compared to samples composed by publicly listed companies from Poland and other CEE for the same period as seen in Table 2 and Figure 12.
Table 2. Profitability - Complementary test 1.
Profitability |
Multinational Control: 117 Companies Sample - Poland (2007-2010) |
Local Control: 138 Companies Sample - Poland (2007-2010) |
466 Listed Companies in Poland (2007-2010) |
647 Listed Companies from Hungary, Romania, Bulgaria, Slovakia and Czech Republic (2007-2010) |
OM |
5.64% |
5.35% |
5.08% |
2.36% |
Source: Own calculations
----
Figure 12. Profitability - Complementary test 1.
Source: Own calculations.
----
Complementary Test 2 - Automated operating margin comparisons for the period 2007-2009.
The following test is based on an automated operating margin comparison for the latest available period 2007-2009, between two automatically generated samples, one of companies under multinational control in Poland and one with companies under local control. This comparison was developed employing samples that were automatically generated using Bureau Van Dijk’s Amadeus Database.
- Automatic Sample - Companies under multinational control in Poland: Those having more than 50% of multinational control and more than 1000 employees. Financial information was obtained for 122 firms complying with such specifications on the Polish market.
- Automatic Sample - Companies under local control in Poland: Those having less than 50% of multinational control and more than 1000 employees. Financial information was obtained for 194 firms complying with such specifications on the Polish market.
The gathered results illustrate increased levels of profitability for the automatic sample composed by companies under multinational control in Poland for the period 2007-2009 when compared to the automatic sample of companies under local control in Poland for the same period as shown in Table 3 and Figure 13.
Table 3. Profitability - Complementary test 2.
Profitability |
Multinational Control:122 Companies, Automatic Sample - Poland (2007-2009) |
Local Control:194 Companies, Automatic Sample - Poland (2007-2009) |
OM |
6.29% |
3.41% |
Source: Own calculations
---
Figure 13. Profitability - Complementary test 2.
Source: Own calculations.
The results related to hypothesis 1 which were obtained from the main test as well as those gathered from the complementary tests 1 and 2 indicate that companies under multinational control in Poland consistently present higher levels of profitability that those of locally controlled entities during recent years. Furthermore, profitability levels for both types of entities, companies under multinational control and those locally controlled, increased in the 2005-2010 period when compared to the 1999-2004 period, although it must be highlighted that the increase for those under foreign control approximately more than doubles that of locally controlled firms (when considering inter-period increases of 36.33% versus 13.64%).
4.4.2. Hypothesis 2 on profit shifting through capital structure design
It can be observed that during the 1999-2004 period both samples maintained a comparable capital structure, as MNE-controlled entities maintained a long term debt to equity ratio of 0.0944, while the locally controlled entities maintained 0.0702 as shown in Table 4.
Nevertheless, for the 2005-2010 period, whereas locally controlled entities increased considerably their long term debt use, MNE-controlled entities displayed a significant decrease in their use of long term debt (see Table 4 and Figure 14). In fact, the locally-controlled sample presented an inter-period increase of 101.96%, while the MNE-controlled one rather displayed an inter-period decrease of -70.73% in its use of long term debt for financing their activities.
Table 4. Capital structure - comparison of five-year periods between MNE and locally controlled companies 6.
Structure |
Inter-period D/E Ratio Variation (%) |
Debt-to-Equity Ratio (1999-2004) |
Debt-to-Equity Ratio (2005-2010) |
D/E (MNE-controlled) |
-70.73% |
0.0944 |
0.0276 |
D/E (locally-controlled) |
+101.96% |
0.0702 |
0.1417 |
Source: Own calculations.
---
Figure 14. Capital structure - Comparison of five-year periods between MNE and locally controlled companies.
Source: Own calculations.
4.4.3. Analysis of the results for hypothesis 1
Internal transfer pricing manipulations can be executed in order to take advantage of tax rate differentials among countries, such differences are themselves a direct consequence of tax competition. Therefore, multinationals acting under global strategies towards maximizing profits at the consolidated level are able to execute some degree of under or overpricing for any type of cross-border intra-group transaction that takes place among its members. Such a manipulation of the internal prices influence the involved entities' taxable profits within each country, evidently affecting the collected tax revenues in such countries, in some cases positively while in others, negatively.
With respect to the Polish economy, the results suggest that there is evidence of inwards profit shifting via transfer pricing manipulation, whereas companies which are under multinational control consistently display higher levels of profitability at the operating level than those which are locally controlled.
During the last decade the Polish economy has achieved economic growth on an annual basis, as such both, companies under multinational control and those under local control presented an increase of their profitability for the 2005-2010 period in relation to the 1999-2004 period (see Table 1 and Figure 11). Nevertheless, according to the results of the main test, the growth in profitability for the companies under MNE control more than doubles that of the local companies, which can suggest a certain sensibility from the group's perspective to the comparatively lower corporate tax rates in Poland.
In other words, the comparatively higher increase in profitability for companies under multinational control could be explained by the allocation of more profits (i.e. profit shifting) towards the Polish subsidiaries under strategic considerations, thus increasing the taxable profits in Poland at the expense of taxing the same profits in countries with comparatively higher tax rates which would result in disregarding potential tax savings and failing to improve profits at the consolidated level for the MNE.
As a matter of fact, when taking annual data related to the main test, the evolution of the operating margins derived from MNE-controlled sample is negatively correlated to the evolution of the Polish corporate tax for the analyzed period (with a Pearson coefficient of
-.7676, see Table 5.), which might suggest that the decreasing Polish tax rates served as an incentive towards increasing reported profitability in Poland. Furthermore, the increased profitability of Polish companies under multinational control for the last few years is confirmed by the complementary tests.
Table 5. Annual profitability for the sample of 117 MNE controlled companies compared to the polish tax rates.
Profitability |
1999 |
2000 |
2001 |
2002 |
2003 |
2004 |
2005 |
2006 |
2007 |
2008 |
2009 |
2010 |
OM (MNE-controlled) - sample of 117 companies |
0.0373 |
0.0287 |
0.0297 |
0.0370 |
0.0552 |
0.0513 |
0.0528 |
0.0572 |
0.0509 |
0.0529 |
0.0689 |
0.0682 |
Corp. Tax rate (%) - PL |
34 |
30 |
28 |
27 |
27 |
19 |
19 |
19 |
19 |
19 |
19 |
19 |
Source: Own calculations.
Robustness check for hypothesis 1
In order to cross evaluate the results from the main and complementary tests, the following strategy was developed. From the initial set of 117 MNE-controlled entities, a subset was obtained by selecting exclusively companies which were listed as having capital only from countries being the main FDI holders in Poland as of 2010. The described subset is composed by 83 companies with capital from the Netherlands, Germany, France, Luxemburg, Italy and the United States as previously mentioned. When considering such a set, the correlation between the median observation for each year and the Polish corporate tax rate is also negative (with a Pearson coefficient of -.7988, see Table 6).
Table 6. Annual profitability for the sample of 83 MNE controlled companies compared to the polish tax rates.
Profitability |
1999 |
2000 |
2001 |
2002 |
2003 |
2004 |
2005 |
2006 |
2007 |
2008 |
2009 |
2010 |
OM (MNE-controlled) - sample of 83 companies |
0.0384 |
0.0328 |
0.0319 |
0.0440 |
0.0623 |
0.0625 |
0.0646 |
0.0672 |
0.0623 |
0.0494 |
0.0746 |
0.0664 |
Corp. Tax rate (%) - PL |
34 |
30 |
28 |
27 |
27 |
19 |
19 |
19 |
19 |
19 |
19 |
19 |
Source: Own calculations.
Furthermore, when evaluating the correlation between the profitability of the sample composed by 83 companies and the weighted tax rate differential between the main FDI holding countries and the Polish rate 7, it was observed that there is a positive correlation (with a Pearson coefficient of .7395, see Table 7); which might suggest that the increasing differential acts as an incentive to profit shifting towards Poland at the expense of the main FDI holding countries.
Table 7. Annual profitability for the sample of 83 MNE controlled companies compared to tax rate differentials.
Profitability |
1999 |
2000 |
2001 |
2002 |
2003 |
2004 |
2005 |
2006 |
2007 |
2008 |
2009 |
2010 |
OM (MNE-controlled) - sample of 83 companies |
0.0384 |
0.0328 |
0.0319 |
0.0440 |
0.0623 |
0.0625 |
0.0646 |
0.0672 |
0.0623 |
0.0494 |
0.0746 |
0.0664 |
Tax rate differential (main FDI stock holders vs. Poland) (%) - weighted for the sample of 83 companies |
6.65 |
10.08 |
6.65 |
7.71 |
8.78 |
16.03 |
17.59 |
17.52 |
17.53 |
13.80 |
13.73 |
13.71 |
Source: Own calculations.
Additionally, when considering the inter-period variation between the 2005-2010 and 1999-2004 periods, the results are consistent with the previous findings as, for the 2005-2010 period the profitability of the subset increased by 18.81% with respect to the 1999-2004 period, while the Polish corporate tax rates showed a decrease of -30.90%, and the calculated weighted differential with respect to the 83 companies' subset an increase of 67.90% when compared to 1999-2004 as seen in Table 8.
Table 8. Comparison of profitability levels, polish tax rate and tax rate differentials
- sample of 83 MNE controlled companies.
Profitability |
Period 1999-2004 (average) |
Period 2005-2010 (average) |
Variation (%) |
OM (MNE-controlled) - sample of 83 companies |
5.20% |
6.17% |
+18.81% |
Corp. Tax rate (%) – PL |
27.50 |
19.00 |
-30.90% |
Tax rate differential (main FDI stock holders vs. Poland) (%) - weighted for sample of 83 companies |
9.32 |
15.65 |
+67.90% |
Source: Own calculations.
Such results suggest that there is evidence of profit shifting among the multinational controlled entities composing the 83 companies' subset in order to take advantage of the differences in corporate tax rate, in this case those between Poland and the countries which are the main FDI holders.
4.4.4. Analysis of the results for hypothesis 2
Profit shifting practices also include the execution of capital structure decisions under a global tax-minimizing perspective with the objective of using the tax deductibility of interests to generate tax savings at the consolidated results' level.
Financial decision-making under global strategies rather than on the subsidiary's standalone basis aims at the maximization of corporate profits by gauging the use of intra-group debt to the tax rate differential between the involved countries and not from the point of view of the subsidiary's optimal capital structure. Despite the existence of thin capitalization rules in many countries, such practice still occurs to some degree.
Under the scope of global profit-maximization strategies, entities in high-tax countries tend to be financed with intra-group debt rather than with equity or debt from the "external" or regular credit markets. With respect to the Polish economy, the results suggest that there is evidence of inwards profit shifting via capital structure decisions, whereas companies which are under multinational control employ lower levels of debt than locally control ones.
Within the context of a growing economy with favourably evolving local credit markets conditions for the 2005-2010 period, companies under multinational control employed significantly lower levels of long term debt when compared to local companies. In fact, for the 2005-2010 period companies under multinational control diminished their use of long term debt by -70.73% in relation to the levels presented in the 1999-2004 period; while companies under local control increased considerable theirs', displaying a 101.96% increase with relation to the 1999-2004 period (see Table 4 and Figure 14).
Furthermore, the use of long term debt by the MNE-controlled companies diminished by -70.73% in 2005-2010 with respect to 1999-2004, while the averaged tax rate differential between the main FDI holding countries and the Polish rate increased by 70.13% 8. Therefore, the increasing tax rate differential might by acting as a disincentive towards the use of debt by the Polish entity, particularly when considering that local companies increased their use of long term debt by 101.96% for the same period, probably as a result of improved conditions in the local credit markets.
Robustness check for hypothesis 2
In order to cross evaluate the results from the main test, the following strategy was developed. From the initial set of 117 MNE-controlled entities, a subset was obtained by selecting exclusively companies which were listed as being controlled by countries acting as the main FDI holders in Poland as of 2010. The described subset is composed of 83 companies with capital from the Netherlands, Germany, France, Luxemburg, Italy and the United States.
Nevertheless, in order to obtain increased reliability it was necessary to consider also the effects on companies related to having on-going losses and that they could be carried forward, as in practice it neutralizes the tax deductibility of the interests derived from the use of debt. For this purpose companies which have losses for three or more consecutive years were excluded from the sample. Therefore, the subset diminished in size from 83 to 61 MNE-controlled companies with capital from the main FDI holding countries. As this step considerably reduces the number of outlying extreme values, the following calculations consider the use of the average D/E ratio.
When considering the described set composed of 61 companies, the correlation between the annual averaged D/E ratio and the weighted 9 tax rate differential is negative (with a Pearson coefficient of -.6949, see Table 9); which might suggest that the increasing differential acts as an disincentive to the use of debt by the Polish entity, thus, resulting in profit shifting towards Poland at the expense of the main FDI holding countries.
Table 9. Comparison of capital structure and tax rate differentials - sample of 61 MNE controlled companies.
Structure |
1999 |
2000 |
2001 |
2002 |
2003 |
2004 |
2005 |
2006 |
2007 |
2008 |
2009 |
2010 |
D/E (MNE-controlled) - sample of 61 companies |
0.3943 |
0.5966 |
0.5750 |
0.4652 |
1.1772 |
0.2163 |
0.1943 |
0.1707 |
0.1248 |
0.1760 |
0.1231 |
0.1327 |
Tax rate differential (main FDI stock holders vs. Poland) (%) - weighted for sample of 61 companies |
4.41 |
7.63 |
6.54 |
6.67 |
7.56 |
15.14 |
16.43 |
16.24 |
16.25 |
13.93 |
13.77 |
13.76 |
Source: Own calculations.
Interestingly, when analyzing the correlation between the annual averaged D/E ratio for the sample composed by 61 MNE-controlled companies and the evolution of the Polish Central Bank's reference interest rates, it is observed that there is positive correlation (coefficient of .4129), whereas when comparing such Polish reference interest rates with the D/E ratio of the original sample composed by 138 locally controlled firms, there is a negative correlation (coefficient of -.6378) which can suggest that the increase in the locally-controlled companies' use of debt is partially explained by the reduction in the local interest rates over the years, as seen in Table 10.
Table 10. Comparison of capital structure and polish interest rates - sample of 138 locally controlled companies.
Structure |
1999 |
2000 |
2001 |
2002 |
2003 |
2004 |
2005 |
2006 |
2007 |
2008 |
2009 |
2010 |
D/E (locally-controlled) - sample of 138 companies |
0.0407 |
0.0439 |
0.0322 |
0.0365 |
0.0338 |
0.0757 |
0.0729 |
0.0625 |
0.0865 |
0.1117 |
0.1293 |
0.0936 |
Polish reference rate (%) |
14.50 |
18.25 |
14.43 |
8.28 |
5.88 |
6.08 |
5.15 |
4.13 |
4.63 |
5.54 |
3.88 |
3.50 |
Source: Own calculations.
The previous finding suggest that MNE-controlled firms do not resort to the local credit market to the same extent as the local companies; as Polish MNE-controlled companies can obtain funding from intra-group sources in the form of equity rather than debt.
When evaluating the correlation between the average D/E ratio of the 61 companies' subset with the total FDI inflows from the main FDI holding countries, it is observed that the correlation is negative with a Pearson coefficient of -.5714 (see Table 11). Such information might suggest that Polish companies under multinational control employ lower levels of long term debt from (either internal or from local credit markets), as the required funding is received via FDI inflows.
Table 11. Comparison of capital structure and FDI inflows from the main FDI stock holding countries -
sample of 61 MNE controlled companies.
Structure |
1999 |
2000 |
2001 |
2002 |
2003 |
2004 |
2005 |
2006 |
2007 |
2008 |
2009 |
2010 |
D/e (mne-controlled) - sample of 61 companies |
0.3943 |
0.5966 |
0.5750 |
0.4652 |
1.1772 |
0.2163 |
0.1943 |
0.1707 |
0.1248 |
0.1760 |
0.1231 |
0.1327 |
FDI inflows from main 6 FDI stock holding countries (in MM USD) |
5597.30 |
7130.90 |
4704.00 |
2949.40 |
2401.90 |
8026.00 |
5654.40 |
13179.80 |
12690.00 |
8514.10 |
9334.60 |
2933.42 |
Source: Own calculations and OECD statistics on FDI inflows into Poland ( http://stats.oecd.org/).
Lastly, with respect to the inter-period variation for the 2005-2010 and 1999-2004 periods, the results are consistent with the previous findings as for the 2005-2010 period, the use of long term debt for the 61 companies' subset decreases in -72.03% with respect to the 1999-2004 period, while the weighted tax rate differential calculated with respect to the 61 companies subset, showed an increase of 88.46% when compared to 1999-2004 as shown in Table 12.
Table 12. Comparison of capital structure and tax rate differentials - sample of 61 MNE controlled companies.
Structure |
Period 1999-2004 (average) |
Period 2005-2010 (average) |
Variation (%) |
D/E (MNE-controlled) - sample of 61 companies |
0.0898 |
0.0251 |
-72.03% |
Tax rate differential (main FDI stock holders vs. Poland) (%) - weighted for the sample of 61 companies |
7.99 |
15.06 |
+88.46% |
Source: Own calculations.
5. Concluding remarks
Within the context of continuous increases in world output, expansion of trade and investment flows, liberalization policies and growing multinationals' activities in the world economy, the topic of profit shifting among members of the MNE becomes a major consideration for governments and supranational bodies as well as for the multinationals themselves.
Profit shifting practices can occur as follows: a) internal transfer prices manipulation, or b) the execution of financing decisions related to the individual firms' capital structure under global tax-minimizing considerations rather than based on the subsidiary's standalone basis.
A country’s tax rate differentials with the outside world not only results in changes in the levels of real economic activities, but also acts as an incentive for multinational companies to develop global profit-maximizing strategies in order to improve their financial results at the consolidated level. Such global strategies might include the artificial shifting of profits or in other words the reallocation of taxable profits towards entities registered in countries with comparatively lower corporate tax rates, as is the case for Poland when compared to its partners.
The results of the Polish study suggest that there is evidence of profit shifting via transfer pricing as multinational-controlled entities in Poland present higher levels of profitability than local entities. Additionally, it is observed that MNE-controlled entities' profitability increases simultaneously with the increase of the corporate tax rate differential between the main FDI holding countries' tax rates and local tax rates.
Similarly, the results also suggest that Polish MNE-controlled entities present lower levels of long term debt with respect to equity than local entities and that the MNE-controlled entities' use of long term debt decreases as the corporate tax rate differential between the main FDI holding countries' rates and local rates increases. Thus, evidence of profit shifting practices could be in line with the development of global profit maximization strategies, in this case, allocating more profits to the Polish entities due to its lower corporate tax rate.
The results of the study on the Polish economy suggest that given its comparatively lower corporate tax rate, Poland may be considered as being on the favoured end of such strategic shifting practice, as both practices, transfer pricing manipulation and capital structure decisions under global strategies actually result in increased taxable profits reallocated towards Poland at the expend of the main investor countries' government tax revenues.
Nevertheless, two considerations need to be made. Firstly, that the increased corporate profits and thus the government's tax revenue might be coming by simultaneously sacrificing a portion of such revenues due to the reduction of the corporate tax rates which ultimately impacts the government's finances. Secondly, the tax rate differentials which currently favoured Poland will continue to evolve and in the future it is possible that such temporary competitive advantage will disappear as a result of on-going global tax competition among countries. Moreover, such potentially harmful practices might be present in other countries across the world, and especially involving less developed economies.
Bibliography and references
Barion, F.; Miniaci, R.; Panteghini, P.; Parisi, M. (2010); “Profit Shifting By Debt Financing In Europe”, Cesifo Working Paper Series 2985.
Bartelsman, E.; Beetsma, R. (2003); “Why Pay More? Corporate Tax Avoidance Through Transfer Pricing In OECD Countries”, Journal Of Public Economics 87, Pp.2225-2252.
Buettner, T., Overesch, M; Schreiber, U; Wamser, G. (2009); “Taxation And Capital Structure Choice – Evidence From A Panel Of German Multinationals”, Economic Letters 105, Pp.309-311.
Buettner, T.; Overesch, M.; Schreiber, U.; Wamser, G. (2006); “The Impact Of Thin-Capitalization Rules On Multinationals' Financing And Investment Decisions”. Cesifo Working Paper Series No. 1817. ZEW Discussion Paper No. 06-68
Buettner, T.; Wamser, G. (2007); “Intercompany Loans And Profit Shifting – Evidence From Company-Level Data”, Cesifo Working Paper Series 1959.
Chowdhry, B.; Coval, J. (1998); “Internal Financing Of Multinational Subsidiaries: Debt Vs. Equity”, Journal Of Corporate Finance, Vol. 4 (1), Pp. 87-106.
Damodaran Online. http://pages.stern.nyu.edu/~adamodar/ (accessed on 13.03.2012).
Dischinger, M. (2007); “Profit Shifting By Multinationals: Indirect Evidence From European Micro Data”, Discussion Papers In Economics 2029, University Of Munich, Department Of Economics.
Dunn, R.; Mutti, J. (2004); International Economics, Taylor & Francis.
Fuest, C.; Hesbousb, S.; Riedel, N. (2011); “International Debt Shifting And Multinational Firms In Developing Economies”, Economics Letters, 113(2), Pp.135-138.
Gerard, M.; Gillard, M. (2004); “Taxation, Financial Intermodality And The Least Taxed Path For Circulating Income Within A Multinational Enterprise”, Annales D'Economie Et De Statistique, Issue 75-76.
Graham, J. (2003); “Taxes And Corporate Finance: A Review”, Review Of Financial Studies, Vol. 16(4), Pp.1075-1129.
Grubert, H.; Mutti, J. (1991); “Taxes, Tariffs And Transfer Pricing In Multinational Corporate Decision Making”, The Review Of Economics And Statistics, Vol. 73, No. 2, Pp.285-293.
Hsbc Global Research (2011) The World In 2050, Hsbc Global Research.
Huizinga, H.; Laeven, L. (2008); “International Profit Shifting Within Multinationals: A Multi-Country Perspective”, Journal Of Public Economics 92, Pp.1164-1182.
Kant, C. (1988); “Foreign Subsidiary, Transfer Pricing And Tariffs”, Southern Economic Journal, Vol. 55, No. 1, Pp.162-170.
MehaFDI, M. (2000); “The Ethics Of International Transfer Pricing”, Journal Of Business Ethics, Vol. 28, No. 4, Pp.365-381.
Newberry, K.; Dhaliwal, D. (2001); “Cross-Jurisdictional Income Shifting By U.S. Multinationals: Evidence From International Bond Offerings”, Journal Of Accounting Research, Vol. 39, No. 3, Pp.643-662.
OECD statistics website. http://stats.oecd.org/index.aspx (accessed on 09.03.2012).
Panteghini, P. (2009); “The Capital Structure Of Multinational Companies Under Tax Competition”, International Tax And Public Finance, Vol. 16(1), Pp.59-81.
Petty, W.; Walker, E. (1972); “Optimal Transfer Pricing For The Multinational Firm”, Financial Management, Vol. 1, No. 3, Pp.74-87
Polish Central Bank. http://nbp.pl/home.aspx?f=/dzienne/stopy_archiwum.htm (accessed on 10.03.2012).
Polish Information and Foreign Investment Agency. http://www.paiz.gov.pl/Poland_in_figures/foreign_direct_investment (accessed on 17.03.2012).
Polish Ministry of Treasury. http://www.msp.gov.pl/portal/en/87/2076/background_information.html (accessed on 10.03.2012).
Satapathy, C. (2001); “Transfer Pricing: Impact On Trade And Profit Taxation”, Economic And Political Weekly, Vol. 36, No. 20, Pp.1689-1692.
Sikka, P.; Willmott, H. (2010); “The Dark Side Of Transfer Pricing: Its Roles In Tax Avoidance And Wealth Retentiveness”, Critical Perspectives In Accounting 21, Pp.342-356.
Trading Economies website. http://tradingeconomics.com/ (accessed on 13.03.2012).
Weichenrieder, A. (1996); “Transfer Pricing, Double Taxation, And The Cost Of Capital”, Scandinavian Journal Of Economics, Vol. 98(3), Pp.445-52.
World Bank database. http://databank.worldbank.org/ddp/home.do (accessed on 11.03.2012).