Manuel Alfonso Garzón Castrillon y André Luís Fischer
Results of the pilot proof of the Likert type instrument. The test was applied to 35 executives who participated in programs for directors’ formation in Dominican Republic. From the pilot survey, the pertinence of items was evaluated. It included the test, which aimed at determining the factors and therefore, a key mechanism in the evaluation of the objectives. With the method of main components, and the supported coefficient of correlation3 in package SPSS 15,0 redundant items were suppressed. The method allows compressing them, generating an index and with the coefficient of correlation4 and the root characteristic of the variance of each item those redundant were eliminated.
The analysis of the results was made considering the dimensions of each one of the areas of evaluation related to organizational learning. Later, based on the correlation matrix, the analysis of main components was disturbed looking for a new indicator to be generated. With the intention of assuring the contribution of the average of the dimension with respect to the total, the correlation between these averages was established. This correlation showed the pertinence of the dimension as analysis variable in the context of organizational learning, obtaining the following results:
Culture variable for organizational learning: 26 affirmations were designed and we managed to eliminate the redundant questions. Ten (10) affirmations were left.
Subject variable of organizational learning: 22 affirmations were designed and redundant questions were eliminated.
Conditions for organizational learning: 25 affirmations were designed and redundant questions were eliminated. Thirteen (13) affirmations were left.
Sources for organizational learning: Fifty six (56) affirmations were designed and they were manipulated to eliminate redundant questions, being left seventeen (17).
Based on the previous results, new methodology pictures were elaborated along with the new version of the instrument proposed for the research, with three variables grouping forty items. The variables not represented in any of the three items concerning subjects of organizational learning were eliminated and, therefore, are not included in the final instrument used in this research.
TABLE No 1
PERTINENCY OF ITEMS IN THE PILOT QUESTIONNAIRE
| Percentage weight of the four variables | ||
|---|---|---|
| Culture | 38.2% |
0.24530947 |
| Levels | 49.4% |
0.31748885 |
| Conditions | 39.9% |
0.25608905 |
| Sources | 28.2% |
0.18111263 |
| Total | 155.8% |
1 |
Source: Elaborated by the authors SPSS 15.0 (2009)
-----
TABLE No 2
DISTRIBUTION OF THE VARIABLES VARIABLES QUESTIONS
| Variables | Questions |
|---|---|
| Culture | 1, 3, 5, 7, 9,11,13 |
| Levels | 15,17,19,21, 23 |
| Conditions | 25,27,29,31,33,35,37,39,2,4 |
| Sources | 6,8,10,12,14,16,18,20,22,24,26,28,30,32,34,36,38,40 |
Source: Elaborated by the authors SPSS 15.0 (2009)
With the factor matrix and the questions, the affinity of variables with each factor was identified and they were suppressed from the measuring instrument. For this reason, variables having correlations with any of the three components greater than 0,6, from 138 variables, 40 variables were selected. With this empirical identification, it is observed that the 3 factors are culture for organizational learning, sources for organizational learning and conditions for organizational learning.
For the analysis of results the following plan of statistical analysis was followed:
The first part of the analysis was developed considering the dimensions of each one of the areas of evaluation related to organizational learning. With the aim of assuring the contribution of the average of the dimension with respect to the total, the correlation between these averages was established. This correlation allows showing the pertinence of the dimension as variable of analysis in the context of organizational learning.
In each dimension, a test of averages equality was developed to prove if organizational learning differs between the countries, hierarchic levels, size of the company and antiquity of the surveyed executives. For ding this we used the procedure of Analysis of Variance - ANOVA- to a route, where the average of the dimension was taken as dependent variable and as factor the surveyed ones (hierarchy levels countries, size of the company and antiquity)
For effects of evaluating which of the surveyed subjects differed by country, size of the company, hierarchic level and antiquity; the Dunet method for multiple comparisons was used. The level of significance to decide if the equality was certain was taken below 5%.
The scale of measurement used for the evaluation of organizational learning is a Likert scale which is an ordinal scale. The analysis is based on the average of the punctuations and these averages are influenced by the extreme values, (1 and 5 in the ordinal scale). It was taken as reference to ratify with the media of the frequency allocations thus to determine the direction or tendency of the answers in items.
The previous statistical procedures were made using statistical package SPSS 15.0
Following are the hypothesis contrasts taking the different methodology models from organizational learning, taking a significance level of 0.05 Alfa.
For the development of this investigation we fixed two factors, the first factor to evaluate is the country of origin and the levels or variables of each country that we have: size of the company, years of experience and hierarchic level or position in the company.
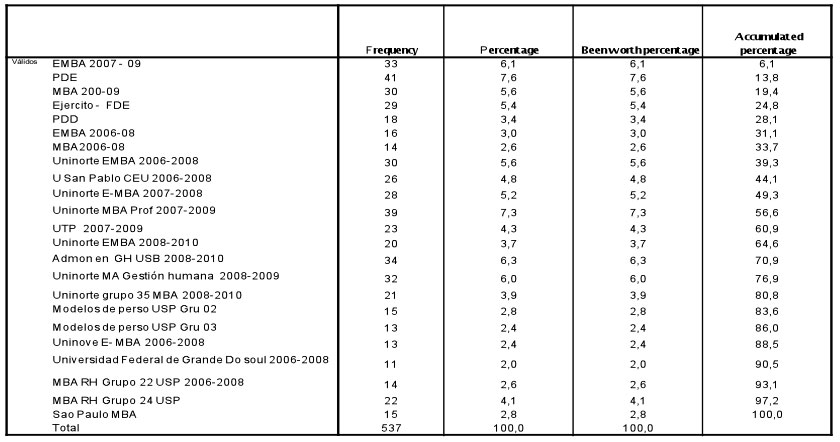
In the present table is the percentage of executives selected of the population, who participated, in the three countries where we developed the investigation. Observing, as the table demonstrates in approximately uniform frequencies, which guarantees that the sampling units have the same probability of being selected, it is assumed that the sampling methodology is random unrestricted.
The population distribution of the executive’s surveys in Colombia, Dominican Republic and Brazil, appear in table Number 3,
TABLE No 3
The hierarchic levels are in Table 4, where we find that 36.5 % belong to low direction, followed by the average direction with 45.6% and High direction with 16.4 % .
TABLE No 4
HIERARCHIC LEVEL OF THE ORGANIZACTION IN COLOMBIA,
DOMINICAN REPUBLIC AND BRAZIL
Frecuency |
Percentage |
Been worth percentage |
Accumulated percentage |
||
|---|---|---|---|---|---|
| Valid | High Direction | 88 |
16,4 |
16,6 |
16,6 |
| Average Direction | 245 |
45,6 |
46,3 |
62,9 |
|
| Low Direction | 196 |
36,5 |
37,1 |
100,0 |
|
| Total | 529 |
98,5 |
100.0 |
||
| Lost | System | 8 |
1,5 |
||
| Total | 537 |
100,0 |
|||
Source: Elaborated by the authors SPSS 15.0 (2009)
The experience of the surveyed population is shown in the next table, where we found that the greatest number have between one and three years of experience and more than ten years of experience.
TABLE No 5
EXPERIENCIE, COLOMBIA, DOMINICAN REPUBLIC AND BRAZIL
Frecuency |
Percentage |
Been worth percentage |
Accumulated percentage |
||
|---|---|---|---|---|---|
| Valid | 1 a 3 years | 250 |
46,6 |
47,5 |
47,5 |
| 4 a 6 years | 102 |
19,0 |
19,4 |
66,9 |
|
| 7 a 9 years | 54 |
10,1 |
10,3 |
77,2 |
|
| More of 10 years | 120 |
22,3 |
22,8 |
100,0 |
|
| Total | 526 |
98,0 |
100,0 |
||
| Lost | System | 11 |
2,0 |
||
| Total | 537 |
100,0 |
|||
Source: Elaborated by the authors SPSS 15.0 (2009)
The size of the company to which the surveyed population belongs is mainly large, with a 67.8%. See Table 6.
TABLE No 6
SIZE OF THE ORGANIZATION IN COLOMBIA, DOMINICAN REPUBLIC AND BRAZIL
Frecuency |
Percentage |
Been worth percentage |
Accumulated percentage |
||
|---|---|---|---|---|---|
| Valid | Big | 362 |
67,4 |
67,8 |
67,8 |
| Medium | 92 |
17,1 |
17,2 |
85,0 |
|
| Small | 47 |
8,8 |
8,8 |
93,8 |
|
| Micro | 33 |
6,1 |
6,2 |
100,0 |
|
| Total | 534 |
99,4 |
100,0 |
||
| Lost | System | 3 |
0,6 |
||
| Total | 537 |
100,0 |
|||
Source: Elaborated by the authors SPSS 15.0 (2009)
----
TABLE No 8
ANOVA COLOMBIA, DOMINICAN REPUBLIC (RD) AND BRAZIL- SIZE
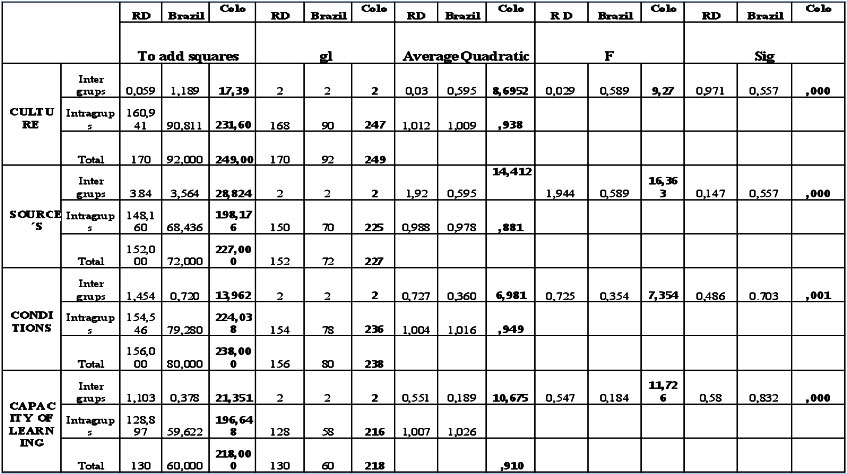
Source: Elaborated by the authors SPSS 15.0 (2009)
We continue with the contrast of hypothesis of each of the involved countries by applying the Analysis of Variance taking as reference each of the methodology models of organizational learning in contrast with the sample size, experience and hierarchic level of the participants. In the case of Brazil for example, the evaluated variables or levels were: Sources of organizational learning, Conditions of organizational learning, the Culture for organizational learning and capacity of organizational learning, in contrast to the size of the company it can be affirmed that there is statistical evidence for not rejecting the hypotheses raised for a level of significance of 5%, because the P thrown values are 0,557; 0,557; 0,703; 0,832, for each of the levels of the methodology model of organizational learning. Therefore for this level of significance it is possible to affirm in this study that the raised null hypotheses are induced under the information sample.
In the Colombian case, according to the analysis of variance, ANOVA it is observed, for the variable sources of organizational learning, conditions of organizational learning, Culture for organizational learning and capacity of organizational learning, in contrast with the size of the company, the sample demonstrates significant P value as it is the case of 0,00; 0,001; 0, 00; 0000 5 for each of the learning models, which is highly significant. This implies a rejection to the raised null hypothesis for a level of significance of 5%.
The decisions taken for each of the presented null hypotheses. 6
The rejection of each one of the null hypotheses implies that sample can be assumed under the evidences determined. There is no significant relation between experience and culture for organizational learning.
There is no significant relation between experience and learning capacity.
There is no significant relation between experience and conditions for organizational learning.
There is no significant relation between experience and learning sources.
In the case of Dominican Republic it can be said that for the null hypotheses H1, H2, H3 and H4 and the given levels of significance in this study of 5%, they adjust to the phenomenon studied. The analysis was done contrasting the evaluated levels: Sources of organizational learning, Conditions of organizational learning, Culture for organizational learning and the capacity of organizational learning against the size of the company, obtained P values are in the order of 0,971, 0.147. 0.486 and 0.58.
For the variable sources of organizational learning, organizational culture, in relation to the hierarchic level that the participants have in the organization, we conclude that the samples were taken from populations with the same average for levels of significance of 0.147, therefore, the hypotheses are accepted but with these levels of significance, thus:
H1: The sources of organizational learning, allow it to appear in the organizations: accepted hypothesis.
TABLE No 9
ANOVA COLOMBIA, DOMINICAN REPUBLIC (RD), AND BRAZIL -EXPERIENCE
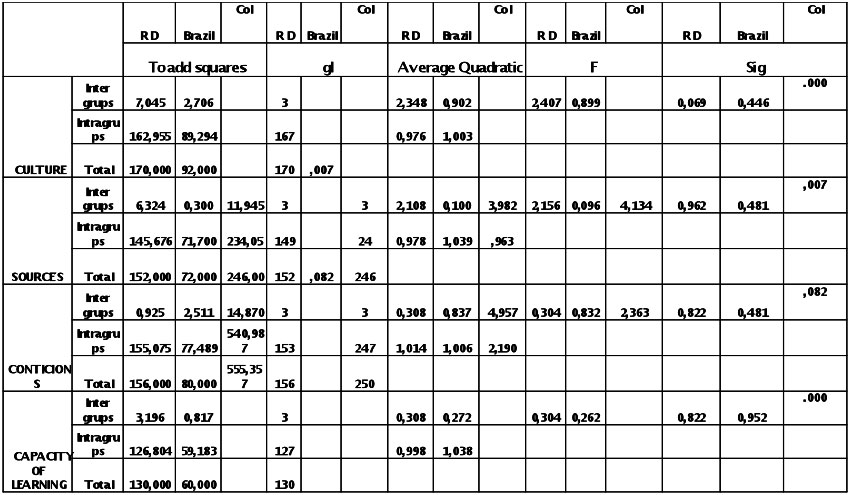
Source: Elaborated by the authors SPSS 15.0 (2009)
In the case of Brazil for example, the evaluated variables or levels: Sources of organizational learning, Conditions of organizational learning, Culture for organizational learning and the capacity of organizational learning, in contrast to the level of experience of the participants in the organization, With P values of 0,446; 0,481; 0,481; 0,952, which implies a rejection of the raised null hypotheses.
It implies that at 0, 05 Alfa of the significance level it can be affirmed that the raised null hypotheses:
Therefore we can affirm that the hypotheses have this behavior:
In the case of Colombia, observing the obtained P values in the table of Analysis of Variance it implies that there:
In a similar way the null hypothesis or affirmation for the variable Sources of organizational learning is rejected, because the P value is of 0.007.7 Nevertheless as far as the Conditions of organizational learning is concerned, in contrast to the experience of the participants the null hypothesis cannot be rejected; this is to say that a relation between the conditions of learning and the experience of the participants in the organization exists; this is demonstrated in the P value of 0,082 that is greater at the level of significance assumed of 0.05.
Therefore the decisions obtained in the raised null hypotheses in the investigation for a level of significance of 5%.
Opposite case
For the case of Dominican Republic ANOVA analysis, for the variables sources of organizational learning, conditions of organizational learning, and capacity of organizational learning, in relation to the experience of the participants in the organization where they work, we can affirm that the samples were taken from populations with the same average for levels of significance of 0,069; 0,962; 0,822; 0,822:
Therefore we can affirm that the hypotheses have this behavior:
In ANOVA analysis, for Culture for organizational learning, in relation to the experience of the participants in the organization where they work, it is possible to state that the samples were taken from populations with the same average for levels of significance of 0.07.
TABLE No 10
ANOVA COLOMBIA, DOMINICAN REPUBLIC (RD), AND BRAZIL –POSITION.
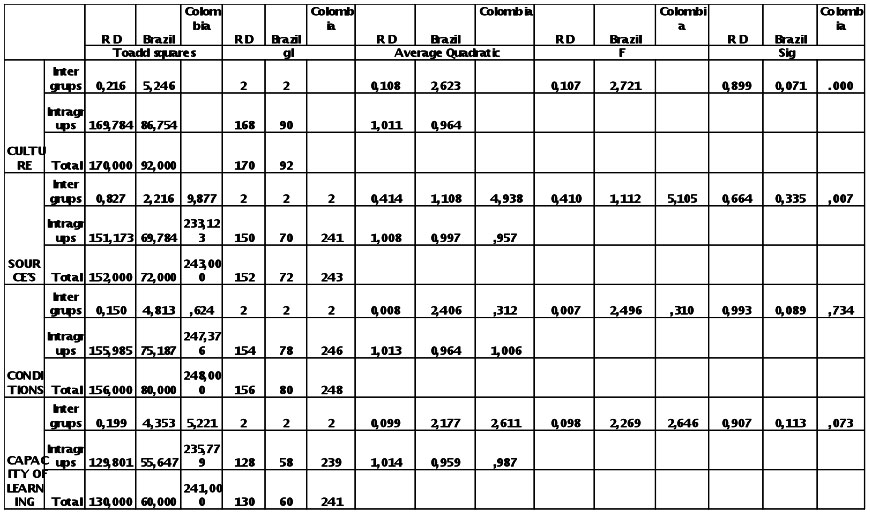
Source: Elaborated by the authors SPSS 15.0 (2009)
The Analysis of Variance shows that for the case of Brazil, and the evaluated variables or levels: Sources of organizational learning, Conditions of organizational learning, Culture for organizational learning and the capacity of organizational learning, in contrast to the hierarchic level of the participant, we can affirm that there is statistical evidence of not rejecting the raised null hypotheses for a level of significance of 5%, because the P thrown values are 0,071; 0,335; 0.089 and 0.113, for each one of the levels of the methodology model of organizational learning. 9
This induces to make the following decisions under the sample evidences.
As with Brazil, these null hypotheses are not rejected when applied for Dominican Republic. Observe the P values obtained of 0,899, 0,664, 0,993 and 0.907. 10
Nevertheless for the case of Colombia, the level Source of organizational learning with P value of 0,007, is significant, indicating that a significant relation between the Source of organizational learning and the hierarchic level does not exist.
ANOVA analysis for the variables, sources and capacity of organizational learning, in relation to the hierarchic level of the participants in the organization, allow us to conclude that the samples were taken from populations with the same average for levels of significance of 0.007 and 0.073, therefore the hypothesis is accepted with these levels of significance.
Therefore we can affirm that the hypotheses have the following behavior:
Observations: There is no significant relation between position and culture for organizational learning, therefore:
The models of organizational learning, Conditions of organizational learning and capacity of organizational learning are of little significance, with P values of 0,734, 0.073
For Dominican Republic ANOVA analysis, for the variables Sources, conditions, culture and capacity of organizational learning, in relation to the hierarchic level of the participants in the organization, we can affirm that the samples were taken from populations with the same average for significance levels of 0.899; 0,664; 0,993; 0,907, therefore it can be affirmed the hypotheses have the following behavior:
Table No 11
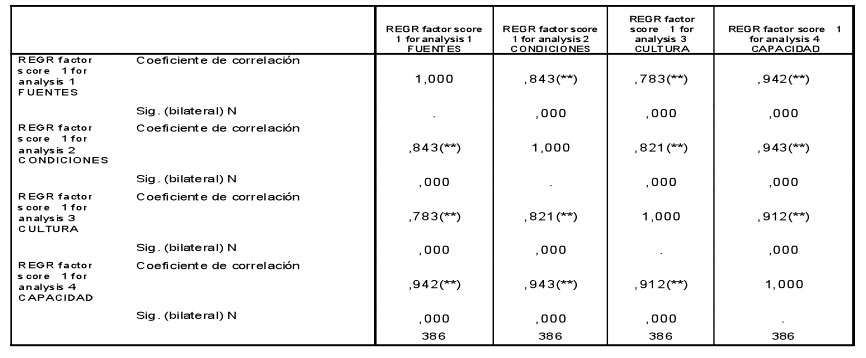
Source: Elaborated by the authors SPSS 15.0 (2009)
The correlation is significant al level 0.01 (bilateral).
In this table it is demonstrated, under the test of Pearson that there is a strong correlation between sources and conditions of 843 and with significance of 000, as well as between sources and culture, of 783, with a significance of 000. It can also be observed a strong correlation between sources and capacity of 942 and with a significance of 000; the same happens between the variable conditions and culture with 821 of correlation and significance of 000 and between conditions and capacity with 943 and significance of 000; the same can be observed between culture and capacity. Therefore, what we observe in the three countries is that there is a high correlation between sources versus conditions, sources versus culture and conditions versus culture. This implies that the null hypothesis that there are no correlations between sources, conditions and culture, must be rejected.11
The compiled and analyzed data set was put under statistical tests that allowed measuring the validity of the affirmations on the characteristics of organizational learning, starting with descriptive statistical procedures, the factorial ANOVA analysis and correlation of Pearson.
Of the ten (10) sources of organizational learning approached by different authors like: Palace (2000); Lopez (1996); Senge (2002); Gore (1998); Argirys (1999); Davenport et al. (2001); Jeffrey (1994); Muñoz-Seca et al (2003); Kikawa (2001); Nonaka et al (1999); Rugles (2000); Fuir (2002); Chaoo (1998); Kleiner (2000) Norman et al. (2002); Pelufo et al. (2004); Wagner (2002); in the three studied countries seven are favored, that is to say: Clients, Crisis and problems, Specialized units, Competition, the experience and the medical instructors, the technology and history.
3 The correlation coefficient measures the association between pairs of variables in this case. The correlation tends to 1 it means that practically the two variables measure the same and that he is redundant therefore is possible to be come off one of them (the one who are more difficult to obtain data). In the measurement that two variables have low correlation is because they contribute more to the explanation of the concept. Statistical Package of Social Science.
4
It serves to determine which items contribute more to explain the concept.
5 It is observed that the P value is highly significant, observes the P values of 0,00, 0,00, 0,001, 0,000 that they indicate that the source, culture, conditions and capacity are variable significant (very important) for the methodology model of learning when the size of the company is considered.
6 This implies in the study that there does not exist a linear or quadratic relation between these variables; this is to say an adjustment or change in one does not affect the other. In other words there exists in a certain way independence between the variables.
7 The first variable experience in years is significant, for the Colombian case, culture, source and capacity but is not significant for the conditions. This implies that a linear relation between the culture, source and capacity can exist and the experience in years, but this linear relation does not exist for the variable conditions.
8 This implies in the study that there is no linear or quadratic relation between these variables; that is to say an adjustment or change in one does not affect the other, therefore there exists in certain way, independence between the variables.
9
It is observed that in Dominican Republic the variables source of learning and culture, are less related 0,783 than the one found in Brazil 0.802.
10 It is observed in the first table values such as 0,857 that imply that the linear relation between the variable conditions is stronger than learning source, that the variables learning source and culture with 0,802; in this case a modification in the learning sources affects more the conditions than the culture.
11 In this work the linear relation is relatively strong, as there exist values like 0,857 near 90%. This value of Pearson oscillates between -1 and 1. Value 0 indicates independence between the variables and values near 1 or -1, discard relation between the variables.
Vol. 31 (1) 2010
[Índice]